Summary by Kirstin A.M. Nackers, MD, Melissa C. Weddle, MD, MPH, and Patricia K. Kokotailo, MD, MPH
100
Based on “Principles of Addiction Medicine” Chapter by Melissa C. Weddle, MD, MPH, and Patricia K. Kokotailo, MD, MPH
Epidemiology has historically been defined as “the study of the distribution of a disease or a physiological condition in human populations and of the factors that influence this distribution.” Within this framework, epidemiology of adolescent substance use documents the incidence and correlates of substance use. Because adolescent substance use may be viewed as a continuum from experimentation to alcohol or substance use disorder, it is more helpful to describe use patterns (behaviors that may influence health), rather than incidence of disease.
There are multiple excellent sources of this type of information; the source for this chapter is the 2013 Monitoring the Future, a national survey of drug use administered annually since 1975 that offers a comprehensive view of the factors that influence drug use. In addition to surveying young people about drug use, it addresses important factors such as beliefs about the dangers and the perceived availability of drugs. In 2013, Monitoring the Future surveyed 41,700 students from 389 public and private schools, chosen to offer a nationally representative sample. Between 1975 and 1991, the survey included 12th graders only; 8th and 10th graders have been included since 1991. Because this survey is administered within the school setting, groups at high risk of substance use such as truants, dropouts, and runaways are not included, and thus the data are adjusted statistically to account for this. A subset of the high school graduates are also invited to participate in follow-up surveys into adulthood.
Throughout this chapter, the prevalence of use for each substance is indicated. For most substances, we present the data on “lifetime use” (having ever used/tried a substance), “annual use” (use within the previous year), and additional contextual information.
PREVALENCE AND TRENDS
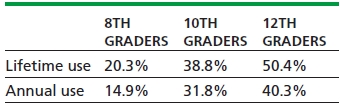
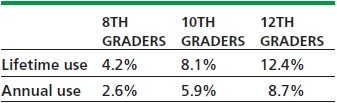
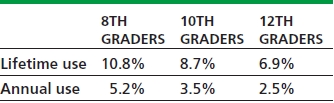
When Monitoring the Future began in 1975, 55.2% of young people reported having used an illicit drug by the time they left high school. By 1980, this had increased to 65.4% before gradually declining to 40.7% in 1992. The proportion again increased to 54.7% in 1999, declining gradually to 47% in 2007 to 2009, rising again to 50.4% in 2013. Since the inclusion of 8th and 10th graders in the 1991 survey, their trends have paralleled those of 12th graders, though at lower levels (Table 100-1).
TABLE 100-1. ANY ILLICIT DRUG USE, 2013
Alcohol
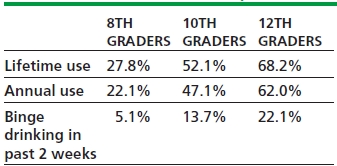
Trends of alcohol use have overall followed the trends of illicit drug use, rising and falling in concert (Table 100-2). After initial declines, alcohol use (particularly binge drinking) rose in the 1990s. By the late 1990s, alcohol and illicit drug use leveled and then began a gradual decline with alcohol use reaching historic lows recently.
TABLE 100-2. ALCOHOL USE, 2013
College students show different trends in alcohol use compared with both 12th-grade students and age-matched young adults not attending college. In times when alcohol use declined, college students showed smaller decreases. College students have lower daily drinking rates than do age-matched young adults not attending college. The data suggest a pattern of heavy drinking primarily on weekends; overall frequency of binge drinking has changed little among college students. Further, males report higher rates of binge drinking than do females (for both college and high school students), though the gender differences have narrowed.
Tobacco
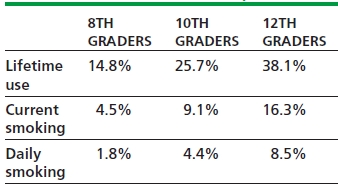
Since the survey began in 1975, cigarettes have been the substance most frequently used on a daily basis by high school students (Table 100-3). Most recently, rates of current smoking (defined as having smoked in the past 30 days) peaked in 1996–1997 at 21.0%, 30.4%, and 36.5% for 8th, 10th, and 12th graders and have declined since. Boys consistently report daily use of cigarettes more than girls with the exception of 1991–2006 when rates were similar between the genders.
TABLE 100-3. TOBACCO USE, 2013
Among college students, the current and daily smoking rates peaked at 31% and 19% in 1991, thereafter declining steadily. Age-matched young adults not attending college have shown a less dramatic decrease in smoking, and their smoking rate is much higher than that of college students or 12th-grade students. From 1980 until 1993, college females generally smoked at higher rates than did males, but rates have been similar since.
There has been concern that as prevalence of conventional cigarette smoking decreases, teens may turn to alternative forms of tobacco use. Questions were added to Monitoring the Future in 2010 about smoking tobacco by hookah water pipes and again in 2011 about newer forms of tobacco—snus (a moist form of snuff placed under the upper lip) and dissolvable tobacco (pellets, strips, or sticks that dissolve in the mouth). In 2013, 21.4% of 12th graders reported smoking with a hookah during the preceding year, but only about 14% reported smoking with a hookah more than two times during the year, suggesting a considerable amount of light or experimental use. In 2013, 7.7% of 12th graders reported using snus in the past year with 1.9% reporting use of dissolvable tobacco over the same period.
Marijuana
Of the illicit drugs, marijuana use remains most prevalent (Table 100-4). Before the initiation of the Monitoring the Future study, marijuana use rose sharply during the late 1960s and early 1970s up to an annual prevalence rate 51% for 12th graders in 1979. Use has overall declined since, but with suggestion of a recent resurgence since 2009. Comparison of daily marijuana use between college students, young adults not attending college, and 12th graders shows highest use among young adults not attending college—8.3% in 2012 compared with 4.8% of college students.
TABLE 100-4. MARIJUANA USE, 2013
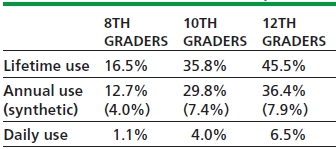
Questions about synthetic marijuana were first included in the survey in 2011, and use appears to be declining parallel to marijuana use. This is the fourth most widely used substance among 10th and 12th graders after alcohol, tobacco, and marijuana and fifth most widely used among 8th graders (as inhalants are fourth most common in this age group).
Amphetamines
Questions about nonprescription amphetamine use were added to the survey in 1982 as annual prevalence of use was increasing. Most recently, use has decreased since the late 1990s (Table 100-5).
TABLE 100-5. AMPHETAMINE USE, 2013
Methamphetamine
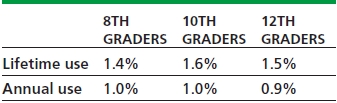
Because of rising public health concerns, Monitoring the Future has included questions about use of “ice” (crystallized methamphetamine, typically smoked) since 1990. Use increased during the 1990s, although now it is declining since 1999 perhaps related to significant media attention (Table 100-6).
TABLE 100-6. METHAMPHETAMINE USE, 2013
Ecstasy and Other “Club Drugs”
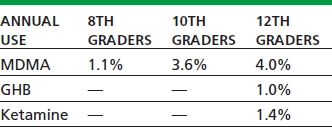
College students and young adults not attending college were first asked about ecstasy (3,4- methylenedioxy-N-methylamphetamine, MDMA) use in 1989; questions about ecstasy were then added to the secondary school surveys in 1996. Use of MDMA, gamma-hydroxybutyrate (GHB, one of the “date rape drugs”), and ketamine has declined since recent peak levels of use in 2001 (Table 100-7).
TABLE 100-7. ANNUAL USE OF ECSTASY AND OTHER “CLUB DRUGS,” 2013
Cocaine
For both powdered cocaine and crack cocaine (the rock form of cocaine), use rapidly increased during the early 1980s (Table 100-8). Thereafter, annual prevalence dropped sharply and has remained quite low, likely because of its perception as a dangerous drug (see sidebar, “Adolescents’ Attitudes Toward Alcohol and Other Drugs”).
TABLE 100-8. COCAINE USE, 2013
Inhalants
Inhalants include common household substances such as glues, aerosols, and solvents that are inhaled to get high. Unlike most other drugs, these are used more by younger adolescents, and use tends to decline with age. There was a marked increase in inhalant use during the early 1990s, followed by a decrease after 1995 (Table 100-9).
TABLE 100-9. INHALANT USE, 2013
Heroin
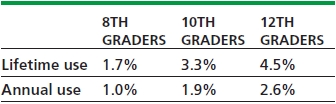
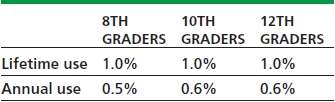
Between 1975 and 1979, the annual prevalence use of heroin fell from 1.0% to 0.5%, thereafter remaining stable until 1994 when use doubled or tripled among 12th graders and college students. This was likely related to the decline in perceived risk as well as the availability of more pure heroin that allowed use by means other than injection. Between 2000 and 2002, use began to decrease, and in 2011, all groups had annual prevalence rates below the recent peaks (Table 100-10).
TABLE 100-10. HEROIN USE, 2013
Stay updated, free articles. Join our Telegram channel

Full access? Get Clinical Tree


