- what is meant by the term epidemiology;
- the concepts underlying the terms ‘normal, abnormal and disease’ from a (i) sociocultural, (ii) statistical, (iii) prognostic, (iv) clinical perspective;
- how one may define a case in epidemiological studies.
What is epidemiology?
Trying to explain what an epidemiologist does for a living can be complicated. Most people think it has something to do with skin (so you’re a dermatologist?) wrongly ascribing the origin of the word to epidermis. In fact the Greek origin is epidēmia – ‘prevalence of disease’ (taken from the Oxford online dictionary) – and the more appropriate related term is epidemic. The formal definition is
‘The study of the occurrence and distribution of health-related states or events in specified populations, including the study of the determinants influencing such states and the application of this knowledge to control the health problems’ (taken from the 5th edition of the Dictionary of Epidemiology)
An alternative way to explain this and easier to comprehend is that epidemiology has three aims (3 Ws).
| Whether | To describe whether the burden of diseases or health-related states (such as smoking rates) are similar across different populations (descriptive epidemiology) |
| Why | To identify why some populations or individuals are at greater risk of disease (risk-factor epidemiology) and hence identify causal factors |
| What | To measure the need for health services, their use and effects (evidence-based medicine) and public policies (Public Health) that may prevent disease – what we can do to improve the health of the population |
Population versus clinical epidemiology – what’s in a name?
The concept of a population is fundamental to epidemiology and statistical methods (see Chapter 3) and has a special meaning. It may reflect the inhabitants of a geographical area (lay sense of the term) but it usually has a much broader meaning to a collection or unit of individuals who share some characteristic. For example, individuals who work in a specific industry (e.g. nuclear power workers), born in a specific week and year (birth cohort), students studying medicine etc. In fact, the term population can be extended to institutions as well as people; so, for example, we can refer to a population of hospitals, general practices, schools etc.
Populations can either consist of individuals who have been selected irrespective of whether they have the condition which is being studied or specifically because they have the condition of interest. Studies that are designed to try and understand the causes of disease (aetiology) are usually population-based as they start off with healthy individuals who are then followed up to see which risk factors predict disease (population-based epidemiology). Sometimes they can select patients with disease and compare them to a control group of individuals without disease (see Chapter 5 for observational study designs). The results of these studies help doctors, health-policy-makers and governments decide about the best way to prevent disease. In contrast, studies that are designed to help us understand how best to diagnose disease, predict its natural history or what is the best treatment will use a population of individuals with symptoms or clinically diagnosed disease (clinical epidemiology). These studies are used by clinicians or organisations that advise about the management of disease. The term clinical epidemiology is now more often referred to as evidence-based medicine or health-services research. The same methodological approaches apply to both sets of research questions but the underlying questions are rather different.
One of the classical studies in epidemiology is known as the Framingham Heart Study (see http://www.framinghamheartstudy.org/about/history.html). This study was initially set up in 1948 and has been following up around 5200 men and women ever since (prospective cohort study). Its contribution to medicine has been immense, being one of the first studies to identify the importance of elevated cholesterol and high blood pressure in increasing the risk of heart disease and stroke. Subsequent randomised trials then went on to show that lowering of these risk factors could importantly reduce risk of these diseases. Furthermore the Framingham risk equation, a prognostic tool, is commonly used in primary care to identify individuals who are at greater risk of future coronary heart disease and to target interventions (see http://hp2010.nhlbihin.net/atpiii/calculator.asp).
Regardless of the purpose of epidemiological research, it is always essential to define the disease or health state that is of interest. To understand disease or pathology, we must first be able to define what is normal or abnormal. In clinical medicine this is often obvious but as the rest of this chapter will illustrate, epidemiology has a broader and often pragmatic basis for defining disease and other health-related states.
What is dis-ease?
Doctors generally see a central part of their job as treating people who are not ‘at ease’ – or who in other words suffer ‘dis-ease’ – and tend not to concern themselves with people who are ‘at ease’. But what is a disease? We may have no difficulty justifying why someone who has had a cerebrovascular accident (stroke), or someone who has severe shortness of breath due to asthma, has a disease. But other instances fit in less easily with this notion of disease. Is hypertension (high blood pressure) a disease state, given that most people with raised blood pressure are totally unaware of the fact and have no symptoms? Is a large but stable port wine stain of the skin a disease? Does someone with very protruding ears have a disease? Does someone who experiences false beliefs or delusions and imagines her/him-self to be Napoleon Bonaparte suffer from a disease?
The discomfort or ‘dis-ease’ felt by some of these individuals – notably those with skin impairments – is as much due to the likely reaction of others around the sufferer as it is due to the intrinsic features of the problem. Diseases may thus in some cases be dependent on subjects’ sociocultural environment. In other cases this is not so – the sufferer would still suffer even if marooned alone on a desert island. The purpose of this next section is to offer a structure to the way we define disease.
A sociocultural perspective
Perceptions of disease have varied greatly over the last 400 years. Particular sets of symptoms and signs have been viewed as ‘abnormal’ at one point in history and ‘normal’ at another. In addition, some sets of symptoms have been viewed simultaneously as ‘abnormal’ in one social group and ‘normal’ in another.
Examples abound of historical diseases that we now consider normal. The ancient Greek thinker Aristotle believed that women in general were inherently abnormal and that female gender was in itself a disease state. In the late eighteenth century a leading American physician (Benjamin Rush) believed that blackness of the skin (or as he termed it ‘negritude’) was a disease, akin to leprosy. Victorian doctors believed that women with healthy sexual appetites were suffering from the disease of nymphomania and recommended surgical cures.
There are other examples of states that we now consider to be diseases, which were viewed in a different light historically. Many nineteenth-century writers and artists believed that tuberculosis actually enhanced female beauty and the wasting that the disease produces was viewed as an expression of angelic spirituality. In the sixteenth and seventeenth centuries gout (joint inflammation due to deposition of uric acid) was widely seen as a great asset, because it was believed to protect against other, worse diseases. Ironically, recent research interest has suggested a potential protective role of elevated uric acid, which may cause gout, for both heart and Parkinson’s disease.
In Shakespeare’s time melancholy (what we would now call depression) was regarded as a fashionable state for the upper classes, but was by contrast stigmatised and considered unattractive among the poor. The modern French sociologist Foucault points out that from the eigtheenth century onwards those who showed signs of what we would now call mental illness were increasingly confined in institutions, as tolerance of ‘unreason’ declined. Whereas previously ‘mad’ people had often been viewed as having fascinating and desirable powers (and were legitimised as holy fools and jesters), increasingly they were seen as both disruptive and in need of treatment. Other examples exist of the redefinition of socially unacceptable behaviour as a disease. Well into the second half of the last century single mothers were viewed as being ill and were frequently confined for many years in psychiatric institutions.
As some diseases have been accepted as part of the normal spectrum of human behaviours so new ones have been labelled. Newly recognised diseases include alcoholism (previously thought of simply as heavy drinking), suicide (previously thought of as a criminal offence, it was illegal in the UK until the 1960s so that failed suicides were prosecuted and successful suicides forfeited all their property to the State), and psychosomatic illness (previously dismissed as mere malingering).
Some new disease categories have arisen simply because new tests and investigations allow important differences to be recognised among what were previously thought of as single diseases. For example people died in past times of what was believed to be the single disease of dropsy (peripheral oedema), which we now know to be a feature of a wide range of diseases ranging across primary heart disease, lung disease, kidney disease and venous disease of the legs. There are still disagreements in modern medicine about the classification of disease states. For example, controversy remains around the underlying pathophysiology of chronic fatigue syndrome (myalgic encephalomyelitis) and Gulf War syndrome.
The sociocultural context of health, illness and the determinants of health-care-seeking behaviour as well as the potential adverse effects of labelling and stigma are main topics of interest for medical sociologists and health psychologists and the interested reader may wish to read further in other texts (see Further reading at the end of this chapter).
Abnormal as unusual (statistical)
In clinical medicine – especially in laboratory testing – it is common to label values that are unusual as being abnormal. If, for example, a blood sample is sent to a hospital haematology laboratory for measurement of haemoglobin concentration the result form that is returned may contain the following guidance (the absolute values will differ for different laboratories and units will differ by country):
| Male reference range | Female reference range |
| 130–170 g/L | 115–155 g/L |
This reference range is derived as follows: a large number (several hundred) of samples from people believed to be free of disease (usually blood donors) are measured and the reference range is defined as that central part of the range which contains 95% of the values. By definition, this approach will result in 5% of individuals who may be completely well, being classified as having an abnormal test result.
Normal (Gaussian) distributions
In practice, as with haemoglobin concentration above, many distributions in medical statistics may be described by the Normal, also known as Gaussian distribution. It is worth noting that the statistical term for ‘Normal’ bears no relation to the general use of the term ‘normal’ by clinicians. In statistics, the term simply relates to the name of a particular form of frequency distribution. The curve of the Normal distribution is symmetrical about the mean (see Chapter 2) and bell-shaped.
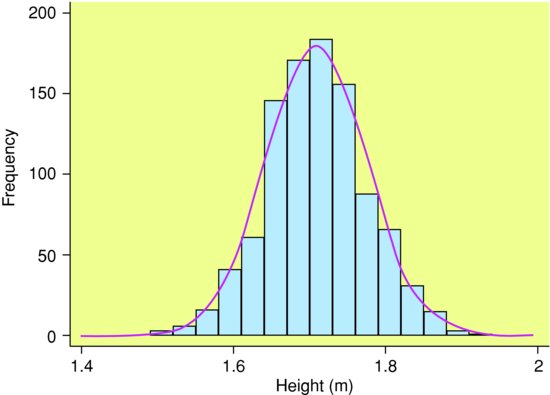
The theoretical Normal distribution is continuous. Even when the variable is not measured precisely, its distribution may be a good approximation to the Normal distribution. For example in Figure 1.1, heights of men in South Wales were measured to the nearest cm, but are approximately Normal.
Figure 1.1 Heights of 1,000 men in South Wales. Note: This figure is known as a histogram and is used for displaying grouped numerical data (see Chapter 2) in which the relative frequencies are represented by the areas of the bars (as opposed to a bar chart used to display categorical data, where frequencies are represented by the heights of the bars).The superimposed continuous curve denotes the theoretical Normal distribution.
Stay updated, free articles. Join our Telegram channel

Full access? Get Clinical Tree


