- how to distinguish between validity and reliability;
- how results may be misleading due to bias and the difference between selection, measurement, differential and nondifferential biases;
- what is meant by the term confounding and the different approaches to try and control confounding.
This chapter will introduce you to some key concepts in epidemiology that are essential to understand when trying to interpret the results of epidemiological studies. These are validity, reliability, bias and confounding. We often use these terms in everyday conversation but as you will see the epidemiological definitions may sometimes not exactly match our lay definitions.
Validity (accuracy) and reliability (precision)
It is important to distinguish between the validity (accuracy) and reliability (precision) of a sample statistic. Consider shooting a target where the bullseye in the centre represents the population parameter we are trying to estimate. We take seven shots at this target, representing seven statistics calculated from seven samples. Then we might see one of the patterns of shots illustrated in Figure 3.1.
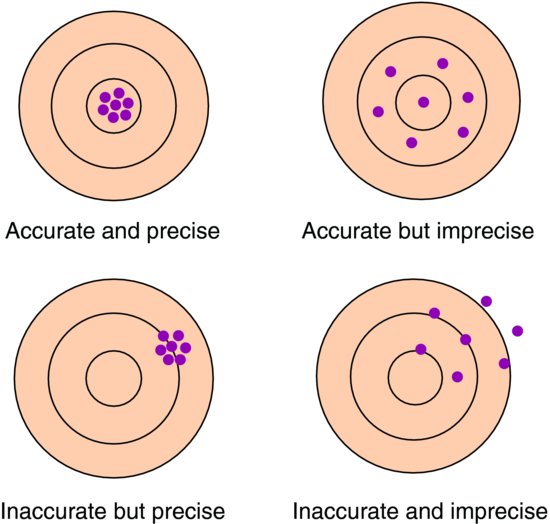
The validity relates to how representative the sample is of the population. If systematic bias is introduced into the study then on average any sample estimate will differ from the population parameter and the statistic will be inaccurate. If there is no systematic bias then on average sample statistics will be the same as the population parameter. We discuss different reasons for bias later in this chapter. Similarly, if the study sample is not representative of the target population, then the study sample result may be different to the true result in the population. In this case the results from the study sample cannot be generalised to the population and are thus an inaccurate reflection of the true population value.
The reliability concerns the amount of variation between sample statistics. The more precise the statistics, the smaller the variability between the sample statistics and the more we can narrow down the likely values of the population parameter. The precision of a single sample statistic can be considered by calculation of a confidence interval, which is introduced in Chapter 4.
We would ideally like to achieve accurate and precise results but research occurs cumulatively so even if our results are accurate but imprecise, this is better than inaccurate but precise as in the longer term it is likely the data of one study will be pooled with other studies (see Chapter 12) which will increase precision.
Bias in epidemiological studies
In an epidemiological study we aim to estimate a population parameter with as much accuracy (and precision) as possible. In a cross-sectional study this is generally the prevalence of a particular exposure or disease, and in an analytical study (such as a randomised controlled trial, cohort or case control) we measure the association between an exposure and an outcome (analytical studies). All of these studies will be dealt with in later chapters. Bias in such studies relates to a departure from the true value that we are trying to estimate.
There are many different names that have been given to the various types of bias that can affect different epidemiological studies and we will introduce many of these throughout the book. However, in practice bias can be classified as relating either to the selection of participants into (or out of) a study or to the measurement of exposure and/or outcome.
Selection bias
As stated above, in a cross-sectional study interest lies in the estimate of the prevalence of a particular exposure or outcome. If there is systematic bias in the selection of participants we may end up answering a different question to that intended. If the way in which people are selected for the study is biased in some way our results may not be representative of the population of interest. For example, volunteers to advertisements for studies often have a personal interest in the area of study. The prevalence of disease or exposures in a volunteer group may be very different from that in the underlying population, hence this may result in either an over- or underestimate of the true prevalence. Therefore, if the estimate of interest is a prevalence then a sample that is not representative of the target population will result in an inaccurate estimate which cannot be generalised to the target population. This bias could operate in either direction; for example, healthier individuals may be more able to take part or in contrast individuals with the studied disease will be more interested in the study and hence agree to take part.
In analytical studies, selection bias relates to the estimate of the association between exposure and an outcome. In terms of systematic sampling error, the following distinction can be made in analytical studies:
Nondifferential selection
So long as any systematic errors in the selection of participants occur equally to all groups being compared (e.g. treatment groups in a randomised controlled trial or exposure groups in a cohort study), then whilst the results may not be representative of any groups in the target population underrepresented in the sample, the estimate of the association between exposure and outcome will be unbiased. Hence, in analytical studies an unrepresentative sample does not necessarily lead to selection bias. For example a trial of an antihypertensive drug (versus placebo) recruits patients from an outpatient clinic. It is noted that of all eligible patients, those from ethnic minority groups are less likely to participate in the trial thereby creating an unrepresentative sample and reducing the generalisability of the findings. However, the distribution of ethnic minority patients is the same across treatment and placebo arms, so the overall effect of the drug on lowering blood pressure is likely to be unbiased.
Differential selection
If, however, any systematic bias in the selection of participants occurs differentially across groups, then selection bias may be present and result in either an under- or overestimate of the association between exposure and outcome. Thus if we continue with the above example, if ethnic minority patients were more likely to be allocated to the treatment arm and pharmacologically were less responsive to the treatment, then the estimate of the drug effect would be biased downwards and be an underestimate.
Measurement bias
There will also be errors in the measurement of exposure and/or outcome in any epidemiological study. For example, an individual’s blood pressure will vary from day to day or even throughout the day, hence different measurements taken on the same individual will vary around their usual blood pressure at random. Alternatively, the device measuring blood pressure may be imprecise so there again will be random variation in readings. Indeed, there will always be some degree of random error in the measurement of exposures and outcomes. If however, the device is inaccurate such that it always under- or overestimates blood pressure, or for example the health care professional using the device always rounds measurements up or down, then there will be some degree of systematic error.
Random and systematic errors in such measurements can lead to the misclassification of a participant with respect to the exposure and/or outcome. If the error is random, misclassification will also be random and the proportions classified into each category will be right. However, systematic error will lead to systematic misclassification with the wrong proportions of individuals classified into different groups.
In a cross-sectional study systematic measurement error may lead to an inaccurate estimate of prevalence. In an analytical study, where we are interested in the accuracy of the estimate of the association between an exposure and outcome, bias can be introduced by both random and systematic measurement error. It is important to ascertain whether errors are likely to be differential across the exposure and outcome groups.
Nondifferential misclassification
Whether measurement errors are random or systematic, if the errors and any resulting misclassification occur equally in all groups we have nondifferential misclassification and the estimate of the association between exposure and outcome will be underestimated (diluted) since the errors will tend to make the groups more similar.
Differential misclassification
If however, measurement error and subsequent misclassification is different across the groups the estimate of the association between exposure and outcome may be either under- or overestimated, and it is often impossible to know which way the bias may have affected the results. For this reason we are generally more concerned with differential misclassification than nondifferential.
Each of these types of bias will be considered in more detail in the context of different analytical study designs throughout the book.
Confounding in epidemiological studies
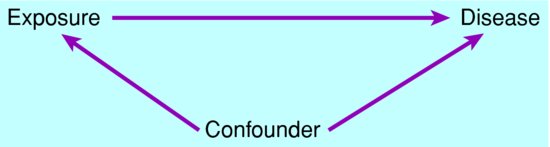
A crucial issue in interpreting the results of epidemiological studies is whether there is an association with a third variable that provides an alternative explanation for the observed association between exposure and disease. This is known as confounding.
Confounding can occur when the exposure (E) under study is also associated with a third factor (confounder) (C), which also affects the chance or amount of disease (D). This is depicted in Figure 3.2. In this case, their association with the confounder may influence the apparent association between exposure and disease.
Figure 3.2 Circumstances in which a third factor can bias the association between exposure and disease.
Stay updated, free articles. Join our Telegram channel

Full access? Get Clinical Tree


