KEY TERMS
This chapter examines epidemiology more closely, defining some of its basic terms and describing how epidemiologists use the terms to describe the patterns of disease occurrence. The chapter also explains the different kinds of epidemiologic studies, with examples of the types of information each form of epidemiologic study can provide.
Epidemiology is defined as “the study of the distribution and determinants of disease frequency in human populations” (emphasis added).1(p.1) Each of these terms must be clearly understood.
First, the epidemiologist must define the disease in a clear way so that there is no doubt about whether an individual case should or should not be counted. Some diseases are easier to identify than others. In a hepatitis outbreak, the symptoms are fairly nonspecific, and not every patient who comes to an emergency room with vomiting and diarrhea has hepatitis. Therefore, the epidemiologist must include the results of blood tests for liver function in his/her case definition. In a study of deaths from gunshot wounds, on the other hand, the cases are fairly easy to count since virtually 100 percent of deaths are reported, and the cause of death is usually identified easily and listed on the death certificate. With a new disease like eosinophilia-myalgia syndrome, working out the case definition might be the most important part of the investigation.
In defining a disease to be studied, epidemiologists use the term “disease” broadly: “Health outcome” is a more accurate but cumbersome description of what is to be studied. For example, epidemiologists might study the frequency and distribution of high blood cholesterol, which is not a disease but is related to the risk of heart attack, or they might study injuries due to traffic accidents, which are not diseases but are certainly significant to health. In both cases, an epidemiologic study may point to ways of preventing the negative health outcome.
In measuring disease frequency, it is necessary not only to count the number of cases but to relate that number to the size of the population being studied, yielding a rate. Six cases of Legionnaires’ disease among 1000 vacationers on a cruise ship, as happened in June 1994, is of much greater concern than if the same number of cases were diagnosed in the whole country. In calculating a rate, the denominator is generally the population at risk. The rate of ovarian cancer in a city of one million, for example, would be calculated by dividing the number of cases by the female population, not the total population of the city.
Two kinds of frequency measures are commonly used in epidemiology: incidence rates and prevalence rates. Incidence is the rate of new cases of a disease in a defined population over a defined period of time. For notifiable diseases, it is ascertained by counting cases reported to the local or state health departments and dividing by the population at risk. Incidence measures the probability that a healthy person in that population will develop the disease during that time. Incidence rates are useful in identifying causes of a disease. For example, the incidence of birth defects in Europe rose dramatically in 1960 after the introduction of thalidomide, a drug used in sleeping pills. This sudden increase and its timing aroused suspicions that thalidomide use by pregnant women was the cause of limb deformities in their infants, a suspicion that was soon confirmed by epidemiologic studies.2
Prevalence is the total number of cases existing in a defined population at a specific time. It would generally be measured by doing a survey. Incidence and prevalence are related to each other, but the relationship depends on how long people live with the disease. A disease with high incidence could have a low prevalence if people recover from it rapidly, or if they die from it in a short period of time. However, for chronic diseases that are not lethal—arthritis, for example—the prevalence will be much higher than the incidence. For most diseases, prevalence rates change slowly and are less useful for epidemiologic studies. They are most useful in assessing the societal impact of a disease and planning for healthcare services.
Death rates, or mortality rates (the incidence of death), are often used as a measure of frequency for diseases that are usually fatal. Death rates are close to incidence rates for the most lethal diseases, such as pancreatic cancer. For diseases such as breast cancer, which many women survive, the mortality rate will be much smaller than the incidence rate. Death rates are not at all useful as a measure of frequency for diseases that are rarely fatal, such as arthritis.
The distribution of disease is comprised of the answers to the who, when, and where questions. The who question characterizes the disease victims by such factors as age, sex, race, and economic status. For example, the incidences of cancer and heart disease are greater in older people; measles and chicken pox occur more often in the young. Old women and young men are more likely to suffer broken bones than old men and young women. During the early months of the AIDS epidemic, the answer to the who question was gay men and intravenous drug abusers. This information led to some obvious hypotheses as to how the disease was transmitted.
The when question looks for trends in disease frequency over time: Is the incidence increasing, decreasing, or remaining stable? The incidence of lung cancer in American men, for example, increased steadily from the 1930s to about 1990, when it peaked and began to decrease. Meanwhile, the incidence of stomach cancer has been declining. Posing another kind of when question, epidemiologists look for seasonal variations in incidence. The incidence of respiratory infections is always higher in the winter.
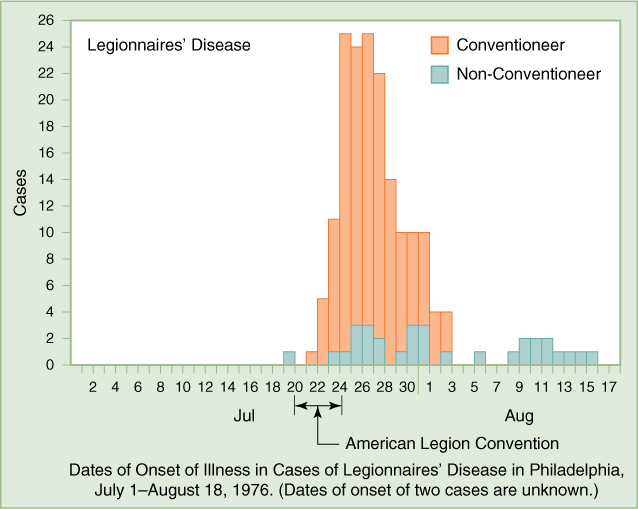
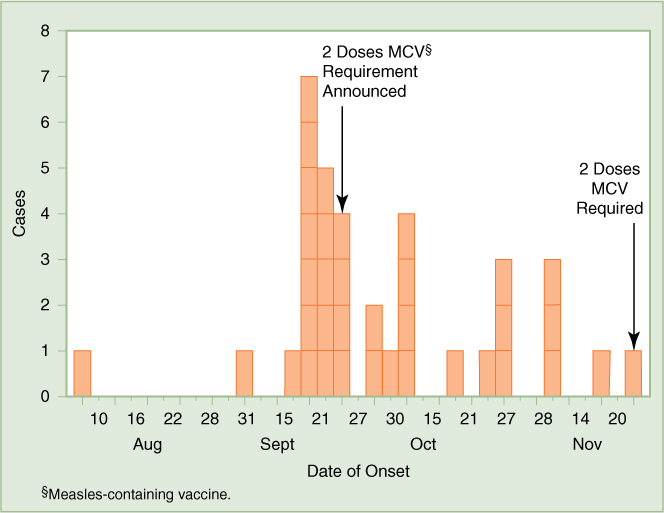
The when question is crucial in tracking an outbreak of infectious diseases such as hepatitis and legionellosis. Epidemiologists construct epidemic curves, like those shown in Figures 5-1 and 5-2, by plotting the number of cases identified over a period of time. (FIGURE 5-1) shows the epidemic curve for the 1976 outbreak of Legionnaires’ disease in Philadelphia. It is clear from the epidemic curve that most of the victims were exposed to the virus at about the same time, and therefore, probably from the same source. Comparing the dates of onset with the dates of possible exposure, epidemiologists calculated an incubation period of 2 to 10 days. An epidemic curve such as the one shown in (FIGURE 5-2) is typical of a disease that has been passed from one person to another.

FIGURE 5-1 Epidemic Curve for Legionnaires’ Disease Outbreak
Data from the Centers for Disease Control and Prevention, Steps of an Outbreak Investigation, 2004. www.cdc.gov/publichealth101/documents/introduction-to-epidemiology.pdf, accessed August 25, 2015

FIGURE 5-2 Number of Confirmed Measles Cases, by Date of Rash Onset, by 3-Day Interval—Anchorage, Alaska, August 10–November 23, 1998
Reproduced from U.S. Centers for Disease Control and Prevention, Morbidity and Mortality Weekly Report 47 (1999): 1110. www.cdc.gov/mmwr/preview/mmwrhtml/00056144.htm, accessed September 12, 2015.
The where question looks at comparisons of disease frequency in different countries, states, counties, or other geographical divisions. It may also look at comparisons between urban and rural populations. The hypothesis that fluoride protects against tooth decay arose from the observation that dental cavities were less common in children who lived in parts of the country that had high concentrations of fluoride in the water. Statistics on causes of death in different countries can be very suggestive in generating hypotheses about the causes of disease. The wide international variation in death rates from heart disease has been interpreted in a variety of ways, including that diet is a factor and that the pressures of urban life have a negative effect on health.
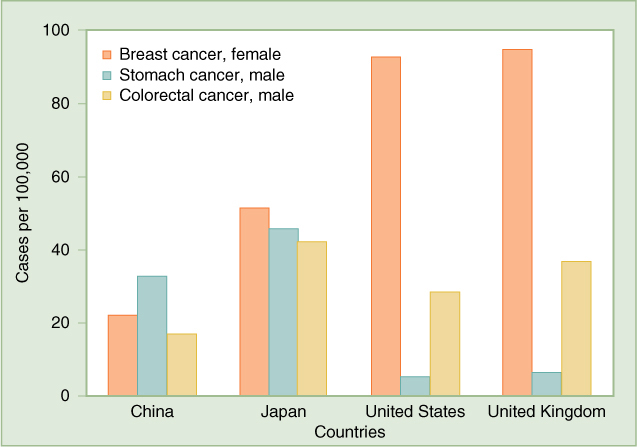
Thus, information on the distribution of disease gives clues about the determinants of disease. International comparisons of cancer incidence, such as those shown in (FIGURE 5-3), have led to hypotheses on causes of various kinds of cancer. For example, cancer of the colon and rectum was much more common in industrialized countries than in developing countries, which led to the hypothesis that the difference is due to differences in diet: Americans eat meals rich in fat, meat, and dairy products, while diets in China are traditionally high in fiber, cereals, and vegetables. Evidence that environmental factors rather than genetics are to blame comes from studies of people who move from a low-rate country to a high-rate country. They tend to develop higher rates of the disease as they acquire the habits of the host country. In Japan, the rates of colorectal cancer more than doubled between the 1950s and the 1990s as Japanese adopted more Western-style diets.3 In the United States, colon cancer rates have fallen dramatically since 1980. The decline has been attributed to increased use of colonos-copy screening, during which precancerous polyps may be removed. However, only 59 percent of people aged 50 or older, for whom the tests are recommended, have actually been screened.4

FIGURE 5-3 Cancer Rates in Four Countries, 2012. Age-standardized incidence rates, cases per 100,000 population.
World Health Organization, International Agency on Research on Cancer, Globocan 2012: Estimated Cancer Incidence, Mortality and Prevalence Worldwide in 2012, globocan.iarc.fr/Pages/fact_sheets_population.aspx, accessed August 30, 2015.
International patterns of breast cancer are somewhat similar to those of colorectal cancer, higher in the West, lower in Asia, suggesting that similar dietary factors may play a role.5,6 However, as more is learned about other risk factors for breast cancer, such as hormonal and reproductive history, it has become clear that diet is not the whole story.6 The incidence of breast cancer in Japan is less than half the rate in the United States. Rates of stomach cancer are much higher in China and Japan than in the United States, evidence that different dietary factors may be involved; diets high in smoked foods, salted meat or fish, and pickled vegetables increase the risk of stomach cancer. However Helicobacter pylori, the bacteria that cause ulcers, also play an important role in causing stomach cancer.5
The relevance of the who and when questions is clearly illustrated in the evidence that smoking is a determinant of lung cancer. Men began smoking cigarettes early in the 20th century, and lung cancer rates began rising 20 years later. Women did not begin smoking in large numbers until the 1940s and 1950s. Lung cancer rates for women did not begin to rise sharply until the 1960s.
Why are broken bones in young people more common in males, while among the elderly, they are more common in females? This question leads to an investigation of the determinants of broken bones. It turns out that these injuries in boys and young men are usually the result of accidents stemming from reckless behavior, in which males are more likely to engage than females. In the elderly, however, broken bones are usually the result of osteoporosis, or weakening of the bones, which is more common in older females.
Epidemiology studies human populations, usually using observational rather than experimental methods. The alternative approach to investigating causes of disease is the biomedical approach, often using animal models of the disease. There are advantages and disadvantages to each approach. Experiments done on animals can yield clear answers as to cause and effect, while for ethical reasons experiments cannot usually be done on humans. However, there are always uncertainties about the relevance of animal studies to humans and whether the findings in animals can be extrapolated to people.
Kinds of Epidemiologic Studies
Answers to the who, when, and where questions provide clues about the causes of a disease or the source of an outbreak. This type of analysis is called descriptive epidemiology. The hypotheses generated by descriptive epidemiology are tested by formal epidemiologic studies, designed to confirm or disprove the hypothesis. For example, in investigating the eosinophilia-myalgia syndrome (EMS) outbreak in New Mexico, epidemiologists found an apparent link with the use of L-tryptophan. To test the hypothesis, they conducted a study comparing 12 cases of EMS with 24 controls, a case-control study (described later in the chapter) that confirmed the link.7
Epidemiologic studies are sometimes referred to as being prospective or retrospective. Prospective studies start in the present and monitor groups of people into the future, or they may start at a point in time in the past and look forward from there. Retrospective studies look into the past for causes of diseases from which people currently suffer. In both cases, investigators are looking for associations between exposure to the suspected causative factor and disease (or other health outcome).
Intervention Studies
Intervention studies are the exception to the rule that epidemiologists do not do experiments. These studies are conducted in very much the same way as those of laboratory experiments on animals. They are usually done to test a new treatment for a disease, such as a chemotherapy drug for cancer, or a preventive measure, such as a vaccine. In a clinical trial, one group is exposed to the intervention, while a control group is not exposed. The investigators then watch and wait to see whether the response of the treatment group is different from that of the control group. Of course, only a limited number of interventions lend themselves to being tested in clinical trials for ethical reasons or because a trial is too difficult to conduct. In testing treatments for serious diseases, there must be enough doubt about the effectiveness of the intervention to justify withholding it from people who could be helped and enough evidence that it will not harm the people on whom it is tested.
The control group may be given a placebo—an inactive substance similar in appearance to the drug or vaccine being tested. When a treatment for a disease is already known to exist, trials may compare the new treatment with the existing treatment. The purpose of the placebo is to prevent subjects from knowing whether they are receiving the intervention. Many trials over the years have found that up to a third of patients respond to a placebo as if it were the intervention, reporting that they feel better or that they suffered side effects. This is the placebo effect. The drug being tested must show a higher response rate than the placebo if it is to be considered effective.
The most convincing clinical trials are conducted in a randomized, double-blind manner. Randomized means that each subject is assigned to the treatment group or the control group at random. This helps to equalize the groups with respect to unknown and known factors that might affect the results. Double-blind means that both the patient and the doctor are blind as to whether the patient is receiving the drug or a placebo. One reason that the doctor should also be blinded is that studies have shown patients to respond more favorably to a treatment that the doctor believes in. Another reason is to prevent the possibility that doctors might interpret the patient’s condition differently if they know how the patient is being treated.
In a therapeutic clinical trial, both the experimental group and the control group are composed of patients who have the disease for which a therapy is being tested. Thousands of therapeutic trials are being conducted each year by pharmaceutical companies testing new drugs. The Food and Drug Administration (FDA) requires that the safety and effectiveness of any new drug must be demonstrated in a properly conducted clinical trial before it can be approved for marketing.
A classic example of a randomized, double-blind clinical trial of a preventive intervention is the field trial of the polio vaccine in 1954. Polio, then a greatly dreaded disease in the United States, killed and paralyzed children and adults. President Franklin Roosevelt, for example, had paralysis of the legs from polio, which he had contracted at the age of 39 when he was already active in politics and public service.8 In 1952, 21,269 cases of paralytic polio were reported in the United States.9 The development of a vaccine by Jonas Salk offered great hope for prevention of this scourge. Preliminary tests had shown the vaccine to be safe and to stimulate disease-fighting antibodies in the blood of people who had been vaccinated. Before the vaccine could be approved for widespread use, however, it had to be tested in a clinical trial to determine if it really could protect a large number of people against the disease. In 1954, some 400,000 school children in 11 states were given the Salk vaccine or a “dummy” vaccine (the placebo); they were then tracked through the end of the year to see whether they became ill with polio. The incidence of polio among the children who had received the vaccine turned out to be less than half that of those given the placebo vaccine.10 This result demonstrated that polio immunization could reduce the incidence of disease; in fact, the use of the vaccine (or an oral vaccine developed by Albert Sabin in the 1960s) has virtually eliminated polio in the United States.
Another randomized controlled trial of a preventive intervention is the Physicians’ Health Study, in which 22,000 American physicians participated. Two hypotheses were being tested: whether aspirin reduced mortality from heart disease and whether beta carotene decreased the incidence of cancer. The physicians were randomly divided into four groups: those who took aspirin and beta carotene, those who were given one or the other and a placebo, and those who were given placebos only. The trial began in 1983 and was scheduled to run until 1995. The aspirin part of the trial was halted in 1988, however, because it was clear by that time that the physicians taking aspirin had a much-reduced risk of suffering a heart attack.11 They were only 56 percent as likely to have a heart attack as the group taking the placebo. The beta carotene part of the trial, which continued until 1995, found no significant difference in the incidence of cancer between the group receiving the beta carotene and the placebo group.12
The Kingston–Newburgh study of fluoride for the prevention of tooth decay was another form of intervention study—a community trial. Before the study began, the schoolchildren of these two small cities on the Hudson River in New York State were similar in general health and in the prevalence of tooth decay. For the study, fluoride was added to the water supply of Newburgh, beginning in 1945, while Kingston’s water was not fluoridated. Ten years later, dental examinations were conducted on the schoolchildren in both cities. The children of Newburgh were found to have approximately half as many decayed, missing, or filled teeth as the children of Kingston had. No adverse health effects were found in the Newburgh children. This evidence was strongly supportive of the value of fluoridation in preventing tooth decay.13
Cohort Studies
Since such experiments are not possible for most hypotheses that epidemiologists want to test, methods have been devised by which investigators can link exposures to results by observation alone, without actively intervening in the lives of the study subjects. Probably the most accurate of these methods is the cohort study. In a typical cohort study, large numbers of people—all healthy at the time the study begins—are questioned concerning their exposures. They are then observed over a period of time to see whether those who were exposed to the factor being studied are more likely to develop the disease than those who were not. This approach is similar to performing an experiment, except that the people themselves have chosen whether they belong to the “exposed” group or the control group.
The Framingham Heart Study is a cohort study, as were the Doll–Hill and Hammond–Horn studies of smoking and lung cancer. Another well-known cohort study, still under way, is the Nurses’ Health Study, which since 1976 has been following some 120,000 married female nurses, looking for factors that may be related to the development of breast cancer and other diseases. The participating nurses have been sent questionnaires every two years, asking about their diet, drinking and smoking habits, and use of drugs, including oral contraceptives. The study found that nurses had a 50 percent higher risk of breast cancer while they were taking oral contraceptives, but the risk fell back to normal after they stopped taking them. Another finding was that regular consumption of alcohol increases the risk of breast cancer by 10 to 40 percent.14,15
Epidemiologic studies are designed to determine not only the existence of an association between an exposure and a disease, but also the strength of that association. The measure of the strength of association obtained by cohort studies and intervention studies is the relative risk, which is the ratio of the incidence rate for persons exposed to the factor to the incidence rate for persons in the unexposed group. A relative risk of 1.0 means that there is no association between the exposure and the disease. A value greater than 1.0 indicates an increased risk from exposure, while a value less than 1.0 indicates a decreased risk.
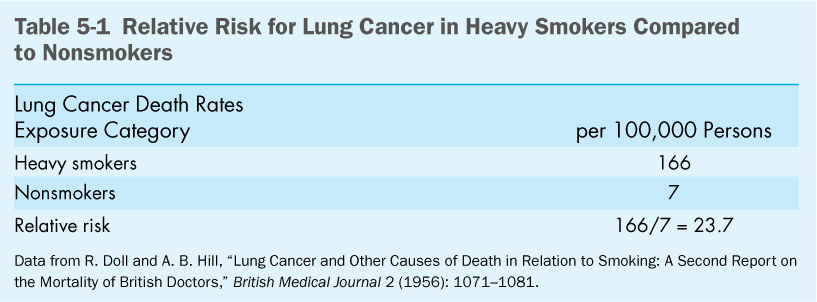
Doll and Hill, in their study of British physicians, found that the relative risk of lung cancer in heavy smokers compared to nonsmokers was 23.7, a major effect.16 The calculation that led to this conclusion is shown in (Table 5-1). In the Nurses’ Health Study, the relative risk of breast cancer for current contraceptive use is 1.5, while that for past use is 1.0. These findings are not very dramatic but they do call for further investigation. In the Physicians’ Health Study, the relative risk of a heart attack for men taking aspirin was 0.56.11 The decrease was significant enough to recommend that most older men might benefit from this preventive measure, but the recommendation would carry much less weight than a recommendation to stop smoking.
Case-Control Studies
In contrast with cohort studies, which start out by measuring exposure and watching for the development of disease, case-control studies start with people who are already ill and look back to determine their exposure. Case-control studies are much more efficient than cohort studies in that they focus on a smaller number of people and can be completed relatively quickly. In a case-control study, cases—people who have the disease—are compared with controls, healthy individuals chosen to match the cases as much as possible in age, sex, and other factors that might be relevant to the disease. The investigator asks all participants the same questions concerning the extent of their exposure to factors hypothesized to have caused the disease. Small case-control studies are commonly done to follow up a hypothesis generated by “shoeleather epidemiology,” as was done in the investigation of EMS and L-tryptophan described elsewhere in this book.
An important case-control study conducted in the mid-1980s sought the cause of Reye’s syndrome, a deadly disease of children that occurred a few weeks after a child had recovered from a viral infection such as chicken pox. The study tested the hypothesis that the development of Reye’s syndrome was linked to medications the child was given during the viral illness.17 The cases were children who had been diagnosed with Reye’s syndrome and reported a previous respiratory or gastrointestinal illness or chicken pox. Controls were children who did not have Reye’s syndrome but who had recently been diagnosed with chicken pox or a respiratory or gastrointestinal illness. Parents of the children in both groups were asked about what medications their children had received during the viral illness. Results of the study are shown in (Table 5-2).

Stay updated, free articles. Join our Telegram channel

Full access? Get Clinical Tree


