(1)
The Goodman Faculty of Life Sciences, Bar Ilan University, Ramat Gan, Israel
Abstract
Most proteins are nanomachines that are selected to execute specific functions and therefore should have some degree of flexibility. The driving force that excites specific motions of domains and smaller chain elements is the thermal fluctuations of the solvent bath which are channeled to selected modes of motions by the structural constraints. Consequently characterization of the ensembles of conformers of proteins and their dynamics should be expressed in statistical terms, i.e., determination of probability distributions of the various conformers. This can be achieved by measurements of time-resolved dynamic non-radiative excitation energy transfer (trFRET) within ensembles of site specifically labeled protein molecules. Distributions of intramolecular segmental end-to-end distances and their fast fluctuations can be determined, and fast and slow conformational transitions within selected sections of the molecule can be monitored and analyzed. Both ensemble and single-molecule detection methods can be applied for data collection. In combination with synchronization methods, time-resolved FRET was also used for studies of fast conformational transitions, in particular the folding/unfolding transitions.
Key words
Protein conformational dynamicsTime-resolved FRETSingle-molecule detectionSite-specific labelingDistance distributionsIntramolecular diffusion coefficientFast fluctuations and conformational transitions1 Introduction
Measurements of dynamic non-radiative excitation energy transfer (FRET) [1–7], which is based on the distance dependent interactions between excited state dipoles, can be applied for the determination of long-range distances between aminoacyl residues in protein molecules. This method has several advantages which makes it uniquely suited to the study of protein conformation and dynamics: close to ideal time resolution; very high sensitivity, up to single-molecule detection; accuracy at distances representing molecular dimensions (10–100 Å); measurements of intermolecular interactions; detection of protein–protein interactions; and oligomerization and the ability to recover distributions of intramolecular distances of fast fluctuating disordered protein molecules.
A series of parameters can be chosen to characterize the partially folded states of protein molecules. These include the mean, the width, the number of subpopulations, and the shape of the distributions of the intramolecular distances. Ensemble time-resolved FRET (trFRET) and single-molecule detected FRET (smFRET) measurements of double-labeled protein samples can provide all these parameters.
In their disordered states and in most cases also in the folded state, protein molecules undergo rapid conformational fluctuations. The lifetime of the excited states of donor probes in trFRET experiments (nanoseconds) defines time windows that enable the detection of rapid fluctuations of intramolecular distances both in the ensemble and in the single-molecule modes. Slower fluctuations can be detected by single-molecule FRET spectroscopy or autocorrelation analysis of intensity fluctuations of double-labeled protein samples [8, 9]. Various modes of trFRET measurements, either in the ensemble of the single-molecule detection, are particularly powerful in studies of flexible protein molecules, of fully or partially unfolded states of globular proteins, and of the intrinsically disordered proteins (IDPs).
FRET measurements are also useful for detection and analysis of intermolecular interactions. A common characteristic of many proteins is the tendency to form amyloid aggregates, protein–protein or protein–ligand interactions. The protein/protein interactions can be monitored by various modes of intermolecular FRET measurements.
We shall first briefly review the theoretical basis of the FRET-based methods and then describe protocols for preparation of labeled samples of proteins suitable for FRET experiments. This will be followed by sections describing the various analysis methods that were developed.
1.1 Theoretical Background
1.1.1 Non-radiative Excitation Energy Transfer
Non-radiative transfer of excitation energy requires some interaction between a donor molecule and an acceptor molecule (Fig. 1). This transfer can occur if at least some vibronic levels in the donor have the same energy as corresponding transitions in the acceptor. Energy transfer can result from different interaction mechanisms. The interactions may be Coulombic and/or due to intermolecular orbital overlap. The Coulombic interactions consist of long-range dipole–dipole interactions (Förster’s mechanism) and short-range multipolar interactions. In the energy transfer process, the initially excited electron on the donor, D, returns to its ground state orbital on D, while simultaneously, an electron on the acceptor, A, is promoted to an excited state. For permitted transitions on D and A, the Coulombic interaction is predominant, even at short distances. This is the case of the singlet–singlet transfer:
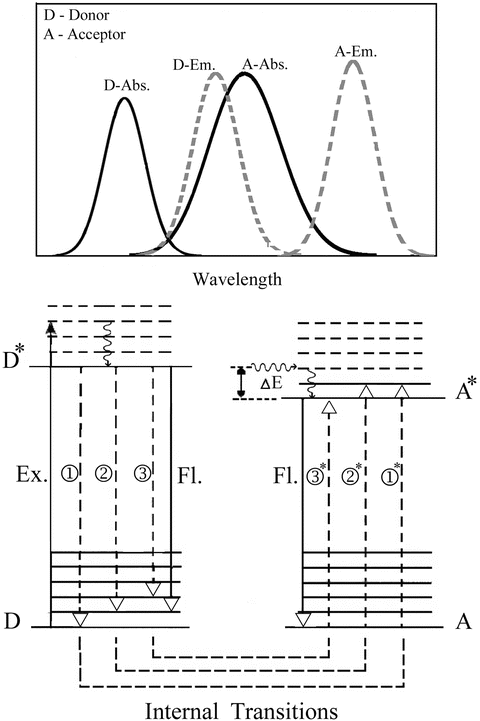
 which is effective over a long interaction range (up to 80–100 Å).
Fig. 1
Energy level diagram demonstrating the mechanism of resonance coupling of the non-radiative transitions in the donor and acceptor probes under conditions where the vibrational relaxation is faster than the energy transfer (very weak coupling). The non-radiative transitions are shown in dashed lines and the radiative transitions are shown as continuous vertical lines. The upper inset shows a scheme of the corresponding absorption and emission spectra of the probes and the overlap integral
Two main mechanisms are relevant in the context of the application of energy transfer for IDP research: the Förster’s mechanism for long-range interactions and the triplet–triplet transfer for the detection of shorter-range interactions.
1.1.2 Rate of Non-radiative Excitation Energy Transfer Within a Donor: Acceptor Pair
A molecule in an electronically excited state (donor) can transfer its excitation energy to another molecule (acceptor) [1] provided that the donor-acceptor pair fulfills several conditions: (a) The energy of the donor must be luminescent; (b) the emission spectrum of the donor should have some overlap with the absorption spectrum of the acceptor; and (c) the distance between the two probes must not exceed an upper limit (usually within the range of up to 100 Å); (d) orientation dependence, see further. The transfer is readily observed when two different probes are involved, but transfer within a homogeneous population of chromophores can occur, as well. Such transfer was first detected in 1927 by Perrin, who detected the loss of polarization of the emitted light [10].
The dipole–dipole interaction which leads to the transfer of excitation energy is very weak, usually of the order of ~2–4 cm−1, while the spectroscopic energies that are transferred are much higher, ~15,000–40,000 cm−1.
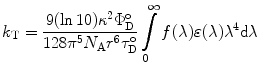
Förster’s theory describes the rate of energy transfer for an isolated pair of chromophores, which fulfill the requirements for energy transfer by the dipole–dipole interaction to be:
where  (θ DA is the angle between the donor and the acceptor dipoles, θ D and θ A are the angles between the donor and the acceptor dipoles and the line joining their centers, and φ is the angle between the projections of the transition moments on the plane perpendicular to the line through the centers). κ 2 can in principle assume values from 0 (perpendicular transition moments) to 4 (collinear transition moments) or 1 (when the transition moments are parallel);
  and
and  are the quantum yield and the fluorescence lifetime of the donor in the absence of an acceptor; r is the distance between the centers of the two dipoles (donor and acceptor); N A is Avogadro’s number per mmole; f(λ) is the fluorescence intensity of the donor in the range of λ to λ + dλ normalized so that
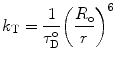
  ; and ε(λ) is the absorption coefficient of the acceptor at the wavelength λ. In Eq. 1, r and λ are in cm units, ε(λ) is in cm2/mol, and J(λ) in units of cm6/mol−1. When those units are used R o is defined by Eq. 2 and is given by:
where J is the overlap integral in Eq. 1. The energy transfer process competes with the spontaneous decay of the excited state of the donor, characterized by the rate constant  . If ε(λ) is given in cm−1 mol−1 units, then
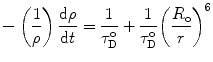
  . Thus, the probability ρ for the donor to retain its excitation energy at the time t after excitation is given by:
and the efficiency E of energy transfer is expressed by:

(1)
(1a)
(θ DA is the angle between the donor and the acceptor dipoles, θ D and θ A are the angles between the donor and the acceptor dipoles and the line joining their centers, and φ is the angle between the projections of the transition moments on the plane perpendicular to the line through the centers). κ 2 can in principle assume values from 0 (perpendicular transition moments) to 4 (collinear transition moments) or 1 (when the transition moments are parallel); and are the quantum yield and the fluorescence lifetime of the donor in the absence of an acceptor; r is the distance between the centers of the two dipoles (donor and acceptor); N A is Avogadro’s number per mmole; f(λ) is the fluorescence intensity of the donor in the range of λ to λ + dλ normalized so that ; and ε(λ) is the absorption coefficient of the acceptor at the wavelength λ. In Eq. 1, r and λ are in cm units, ε(λ) is in cm2/mol, and J(λ) in units of cm6/mol−1. When those units are used R o is defined by Eq. 2 and is given by:(2)
. If ε(λ) is given in cm−1 mol−1 units, then . Thus, the probability ρ for the donor to retain its excitation energy at the time t after excitation is given by:(3)
(4)
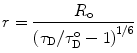
R o is thus the inter-dipole distance at which the transfer efficiency (and the donor lifetime) is reduced to 50 % and has the strongest dependence on changes of that distance (Fig. 2). (At very short interprobe distances where quadrupole interactions become efficient, the point dipole approximation does not hold neither the inverse six power relation between distance and transfer efficiency.)
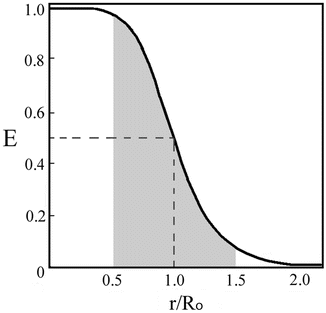
Fig. 2
Variation of the transfer efficiency, E, as a function of the distance between the donor and the acceptor probes. The shadowed range represents the limits of the distance range where reliable measurements of distances are possible
There is a strong experimental support for Förster’s Eqs. 1, 2, 3, and 4 (reviewed by Steinberg [4]). Weber and Teale [11] and Latt et al. [12] showed the dependence on the overlap integral. The R −6 dependence was demonstrated by Stryer and Haugland [13].
Equation 4 shows that the distance between a donor and an acceptor can be determined by measuring the efficiency of transfer, provided that r is not too different from R o and that all molecules in the sampled ensemble share the same intramolecular distance between the labeled residues. If this is not the case, an average distance r av that would be extracted from the measured transfer efficiency does not correspond to any simple “average” distance.
The efficiency of energy transfer is independent of the value of the lifetime of the excited state of the donor. Efficient energy transfer can occur even for “long life” excited states (e.g., for phosphorescence emission) provided that the quantum yield of emission is reasonably high. Such transfer phenomena have been observed. Equations 3 and 4 thus define the characteristic time and distance ranges (“windows”) in which the transfer efficiency, E, is most sensitive to conformational transitions and their rates (Fig. 2). Typical values available for probes that are used in protein chemistry are in the range of 10–80 Å and down to picosecond time intervals. Many conformational changes and processes in folded and unfolded proteins occur on these time scales. Hence, the researcher can design experiments with the time and distance resolutions most suitable for each molecular question.
1.1.3 The Orientation Factor
Distance determination by measurements of transfer efficiencies is complicated by the strong dependence of the probability for energy transfer on the orientation of the interacting dipoles. Therefore, knowledge of the orientation factor, κ 2, is essential for applications of FRET in studies of protein conformations. When the two dipoles undergo rapid orientational averaging during the lifetime of the excited state of the donor, the orientation factor can be averaged to yield a numerical value of 2/3. The large span of possible κ2 values, between 0 and 4, makes it the primary source of uncertainty in distance determination by FRET measurements (see Notes 8 and 9).
2 Materials
Prepare all solutions using ultrapure water and analytical grade reagents. Use spectroscopic grade solvents for fluorescence studies. All materials used should be checked for fluorescence emission in the relevant spectral range.
3 Methods
3.1 Strategies for Site-Specific Double Labeling of Proteins
Despite major biotechnological developments, preparation of homogeneous well-defined samples is still a major biochemical challenge.
Site specific labeling can be achieved by at least nine basic strategies: (a) Use of natural probes including the tyrosine or tryptophan residues and a few prosthetic groups. Site-directed mutagenesis can be applied for the preparation of single tryptophan and single tyrosine mutants [14, 15]. (b) Nonselective chemical modification of reactive side chains and chain terminal reactive groups (amine, carboxyl, and mainly sulfhydryl groups) combined with high-resolution or affinity chromatography-based separation methods [16–20]. (c) Solid-phase synthesis of protein fragments and ligation of synthetic peptide fragments or of a genetically truncated protein fragment and a synthetic, labeled complementing fragment [21]. Total synthesis of labeled protein molecules is applicable for medium-sized proteins, e.g., the total synthesis of Aβ fragments [22, 23]. (d) Production of edited mutants with no more than one pair of exposed reactive side chains, preferably cysteine residues [24, 25] or one cysteine and one tryptophan [15, 26–28] at the desired sites, followed by chemical modification and chromatographic separation. Nitration of tyrosine residues has also been successfully applied [29]. (e) Cell-free protein synthesis and the use of edited t-RNAs and edited genetic code for the incorporation of non-natural amino acids into selected sites in the chain [30]. (f) Enzyme-catalyzed insertion of fluorescent substrates, taking advantage of the specificity and mild conditions of the enzymatic reaction. (g) Use of a protein genetically fused with one or two fluorescent proteins [31]. (h) Exploitation of natural mechanisms for posttranslational chemical modification for either attachment of a fluorescence probe to a selected side chain or production of a nonnative reactive site chain followed by chemical modification for attachment of a reactive probe group[32]. (i) Use of labeled ligands, which can be selective when applied in vivo [33], e.g., tagged antibodies, SNAP tags, and chelating tails that chelate rare-earth ions (see Notes 1–3).
Strategy (a) avoids the potential artifacts caused by labeling procedures and uncertainties such as the labeling ratio. On the other hand, the main limitations of using the natural probes are the limited arsenal of available probes, their less than ideal spectral characteristics, the limited range of R o values that can be achieved by using them, and the fact that most proteins contain several Trp and Tyr residues. Applications of strategy (b) are limited to small proteins or proteins where a limited number of the reactive side chains can be found [20]. Nitration of tyrosine residues was also successfully applied in few cases [34, 35] but that is not a “clean” reaction. Strategy (c) is the ultimate one, which achieves full freedom for the designer of protein derivatives best suited for testing well-defined working hypotheses. This strategy will most probably become the method of choice in the field of spectroscopic research of protein folding [30, 36]. The limited scope of application of this approach at the present time is mainly due to the very sophisticated and multistep operations involved and the low yields. These yields are limiting only in the case of measurements of folding kinetics, where high amounts of samples are employed (e.g., the stopped-flow double-kinetics experiment). In most FRET experiments, the sensitivity of the fluorometric detection systems makes this method satisfactory and promising. Strategy (e) is theoretically the ideal strategy; using such techniques, any protein with any number of Cys or Trp residues can be labeled. But, even though the technique was developed more than 20 years ago, it is still not widely used due to its sophistication and low yields.
Strategy (f) is not of general use due to the limited number of known suitable enzymatic reactions and the multiplicity of reactive side chains. The well-documented catalysis of peptide bond synthesis by proteolytic enzymes was described (for C-terminal labeling of RNase A), but it is not easy to apply as a general method. Strategy (h) is attractive but still has the problem of multiple sites that can be modified. Transglutaminase catalysis of insertion of primary amino groups attached to fluorescent probes was also attempted [18, 37, 38], but the development of strategy (d) offers simpler route. Strategy (g) is good for in vivo experiments, but not so useful for structural studies in vitro due to the very large size of the “probes.”
Strategy (d) is currently the most practical approach for several reasons: first, exposed cysteine residues are rare, and in many proteins these residues can be replaced by Ser or Ala residues without major perturbations of structure and function. Thus, most proteins can be engineered to have two exposed sulfhydryl side chains. Second, the arsenal of sulfhydryl reactive pairs of probes covering a wide range of spectroscopic characteristics and R o values is abundant, and the experimental design can be optimized to meet a wide variety of distances and labeling conditions. Third, these reagents can be selectively targeted at the cysteine residues, and huge amounts of labeled mutants suitable for kinetic experiments can be produced [15, 39–42].
3.1.1 Preparation of Double-Labeled Mutants Using Engineered Cysteine Residues (Strategy D)
Although reagents for selective alkylation of sulfhydryl residues are available, the challenge here is to develop methods for selective modification of each one of the two reactive sulfhydryl groups in the same protein molecule.
Sub-milligram amounts of labeled proteins can suffice for a full set of FRET experiments under equilibrium conditions. Such minute amounts of site-specific double-labeled protein samples can be prepared, using high-resolution chromatography. This chromatography is a mixture of the possible products, following a nonselective reaction of two Cys mutants with a fluorescent reagent. Homogeneous double-labeled products can be obtained in a second cycle of reaction and separation. Hundred-fold larger preparations of labeled proteins are needed for stopped-flow kinetic experiments. In this case, it is desirable to develop methods in which the selectivity is achieved by differential reactivity of selected sites on the protein molecule. A general systematic procedure was developed for high-yield selective labeling of each one of two cysteine residues in mutant protein molecules (see Notes 4 – 7). The determination of individual reaction rate constants of the engineered SH groups and the optimization of reaction conditions enabled high yields (25 %) of the preparation of pure, site-specific double-labeled E. coli adenylate kinase (AK) mutant. These high yields make some otherwise difficult experiments feasible, such as the double-kinetics time-resolved FRET measurements [43].
Jacob et al. [44] improved the prediction of the rates of reactions of engineered cysteine residues at selected sites in a protein. They based this on the observed correlation between reactivity of engineered sulfhydryl groups and the effect of neighboring charged groups (due to dependence of its pK a) and the freedom of rotation of the side chain (Fig. 3). The selectivity of the labeling reaction can be further enhanced by local increase or reduction of reactivity of selected side chains by means of conformational effects. Solvent composition (organic solvents, salt components, and pH) and temperature are the most common variables that can differentially affect the reaction rate constants of selected side chains. In this work, the ratio of the reaction rate constants was examined only under a range of temperatures and salt concentrations. More drastic effects can be obtained by addition of ligand (substrates, inhibitors, or protein–protein interactions) [17] (see Notes 4 and 5).
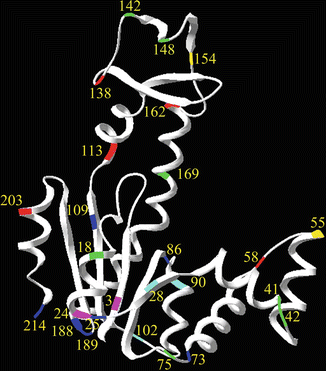
Fig. 3
Color-coded AK sequence positions for which cysteine–DTNB reaction rates were determined: five cysteines reacted extremely quickly (red, 50–200 ms), seven very fast (green, 200–1,000 ms), two fast (yellow, 2 and 3 s), three slowly (cyan, 5–30 s), seven very slowly (blue, 30–200 s), and two extremely slowly (magenta, 20 min and 15 h). These differences can be the basis for selectivity in the reaction of fluorescent probes with one of two cysteine residues in a protein molecule (reprinted with permission from Jacob et al. [44])
The level of homogeneity required for spectroscopic measurements makes the chromatographic separation steps indispensable. Separation of the reaction products can be enhanced when one of the labels is either charged or very hydrophobic [20]. Yet, either hydrophobicity or extra electrostatic charges can affect the folding pathway of proteins and can be a disadvantage when the modifications are made for structural studies. Affinity chromatography was also used for separating multiple-labeled protein derivatives. It is also possible to use a mixed disulphide resin for separation of fractions with free cysteine residues in the process of labeling two-cysteine mutants. The single-labeled mutants which are used for the reference measurements can be prepared by straightforward labeling of single cysteine mutants. Caution must be taken since in several cases it was shown that the spectroscopic properties of a probe attached at one site on a protein are significantly modified when the second cysteine is inserted at the second site for the double labeling. In this case, it is desirable to use the corresponding single-labeled protein sample of the two-cysteine mutant in which the second cysteine residue is blocked by a non-fluorescent alkylation reagent such as iodoacetamide (see Notes 1 and 4 – 7).
3.2 Determination of Intramolecular Distances in Double-Labeled Protein Molecules Using FRET Measurements
Clear presentation of theoretical background for the methods described below may be found in the monographs by B. Valeur [45], J.R. Lakowicz [46], and B.W. van der Meer [6] and numerous reviews such as [4, 26, 47–49, 50] published over the past 40 years.
The first pioneering application of FRET investigation of a natural flexible polypeptide was reported by Edelhoch, Brand, and Wilchek in 1963 [51, 52]. Edelhoch and his colleagues applied strategy (a), using a pair of intrinsic probes (Tyr to Trp transfer). Since then, the technology of both site-specific labeling and time-resolved fluorescence measurements has advanced; together with the methodological developments, the number and power of the applications of FRET measurements in characterization of disordered peptides and proteins proliferated.
3.2.1 Single Distance Between Donor and Acceptor
Determination of distances by determination of FRET efficiency, E, is possible by measuring the decrease of donor emission or an enhancement of the acceptor emission by steady-state and time-resolved methods:
(5)
Due to the comparative nature of this mode of determination of E, the concentrations of the probes (and hence the labeled protein molecules) and their microenvironments must be the same for each set of measurements.
3.3 Time-Resolved FRET Detection Methods
Time-resolved emission of the donor or the acceptor fluorescence provides direct information regarding the transfer rates independent of the concentrations, as this information is provided by the shape of the fluorescence decay curves and not the amplitudes. The donor and the acceptor fluorescence decay curves contain additional information not available from the steady-state measurements. This information, which can be extracted directly by proper analytical procedures, is of particular interest for studies of protein dynamics, unfolded states of proteins, protein folding, and intrinsically disordered proteins (IDPs). Analysis of trFRET experiments can resolve conformational subpopulations, distributions of distances, and fast conformational fluctuations on nanosecond time scales.
3.3.1 Determination of Donor Fluorescence Decay Rates
When an acceptor is located close enough to the donor, two competing processes affect τ D, the lifetime of the excited state of the donor, and the transfer rate:
(6)
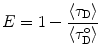
The ensemble average transfer efficiency can be determined using the fluorescence lifetimes of the donor:

and the apparent mean distance is calculated by:
(7)
(8)
When a non-exponential decay of the donor alone ( ) is observed, a common situation due to heterogeneity of microenvironments, average lifetime values can be used to calculate E, provided that the deviation from monoexponentiality is moderate:
where 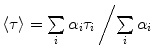
) is observed, a common situation due to heterogeneity of microenvironments, average lifetime values can be used to calculate E, provided that the deviation from monoexponentiality is moderate:(9)
When the heterogeneity of the decay rates is enhanced by the FRET effect, distribution analysis accompanied by appropriate control experiments should be applied.
3.3.2 Determination of Intramolecular Distance Distributions
The distance between two selected residues in a protein is by definition nonuniform, and hence, Eqs. 6 or 9 should be replaced by distance analysis, assuming a probability distribution of the intramolecular distance between the labeled sites, N o(r), with finite full width at half maximum (FWHM) will be determined. In that case, the FRET efficiency determined by steady-state measurements is averaged over the efficiencies of all fractions in the distribution:
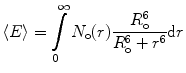
where N o(r)dr is the probability of the fraction of molecules with D−A pairs at distance r to r + dr. N o(r) can be resolved when the experiment is repeated with several pairs of probes of different R o values [53]. A single time-resolved experiment contains all the information needed for the determination of N o(r).
(10)
When the fast conformational exchange within the ensemble of labeled protein molecules is slow relative to the lifetime of the excited state of the donor, N o(r) can be recovered by modeling i(t) using the expression:
![$$ i(t)=k\int\limits_0^{\infty } {{N_{\mathrm{ o}}}(r) \exp \left[ {-\frac{t}{{\tau_{\mathrm{ D}}^{\mathrm{ o}}}}\left( {1+{{{\left( {\frac{{{R_{\mathrm{ o}}}}}{{{r^6}}}} \right)}}^6}} \right)} \right]} \mathrm{ d}r $$](/wp-content/uploads/2017/03/A299540_1_En_7_Chapter_Equ000712.gif)
where k is a proportionality factor. Knowledge of R o and  enables the extraction of N o(r) from the multiexponential decay curve, i(t).
(11)
enables the extraction of N o(r) from the multiexponential decay curve, i(t). 3.3.3 Evaluation of the Effect of Fast Conformational Fluctuations and Determination of Intramolecular Diffusion Coefficients
When exchange of conformers occurs between fractions of an ensemble of protein molecules under equilibrium conditions (where the equilibrium probability distribution of the distances is unchanged), the transfer efficiency is enhanced. For analysis of trFRET experiments this enhancement is modeled as an intramolecular diffusion of the labeled sites on the chain, which acts towards restoration of the equilibrium probability distribution. This phenomenon can be viewed as a process of diffusion under the conformational force field which governs the equilibrium probability distribution of the intramolecular distance, N o(r) [54, 55]. Equation 12 considers both the energy transfer reaction term, k(r), and the restoration force by the diffusion term. Equation 12 is the basis for the experimental data analysis [54–57] for determination of the parameters of the distribution, N o(r):
![$$ \frac{{\partial {{\overline{N}}_i}(r,t)}}{{\partial t}}=\frac{D}{{{N_0}(r)}}\times \frac{\partial }{{\partial r}}\left[ {{N_0}(r)\frac{\partial }{{\partial r}}{{\overline{N}}_i}(r,t)} \right]-{k_i}(r){{\overline{N}}_i}(r,t) $$](/wp-content/uploads/2017/03/A299540_1_En_7_Chapter_Equ000713.gif)
where i denotes the ith species of the donor fluorescence decay (in the absence of an acceptor), N * i (r,o) = N 0(r) (the equilibrium distance distribution), N*i(r,t)dr is the probability for molecules with an excited state species i of the donor to have an intramolecular distance in the range r to r + dr, and  . D is defined as the intramolecular diffusion coefficient of the segments carrying the two probes. In the following equations τ i and α i are the lifetime and the normalized pre-exponential factor, respectively, of the excited state of the ith species of the donor in the absence of an acceptor, and k i (r), the reaction term, includes the spontaneous emission rate and the Förster energy transfer rate:
(12)
. D is defined as the intramolecular diffusion coefficient of the segments carrying the two probes. In the following equations τ i and α i are the lifetime and the normalized pre-exponential factor, respectively, of the excited state of the ith species of the donor in the absence of an acceptor, and k i (r), the reaction term, includes the spontaneous emission rate and the Förster energy transfer rate:(13)
τ r is the radiative lifetime of the donor, and the other terms were defined in Eqs. 1 and 1a. Equation 13 considers the variation of R o due to variations of the donor quantum yield  . This is represented by the ratio of the donor lifetime components and the radiative lifetime, which is assumed to be independent of local environmental effects.
. This is represented by the ratio of the donor lifetime components and the radiative lifetime, which is assumed to be independent of local environmental effects.In the case of ensemble measurements the solution of Eq. 12 is obtained by numerical methods. Since the boundaries are chosen in such a way that the distribution function is very small at both the upper and lower extreme distances, reflective boundary conditions are arbitrarily used [58]:
![$$ {{\left[ {\partial \overline{N}(r,t)\partial /r} \right]}_r}=r \min,r \max =0 $$](/wp-content/uploads/2017/03/A299540_1_En_7_Chapter_Equ000715.gif)
(14)
 , the calculated fluorescence decay curve of the donor, is readily obtained from
  by the relationship [56]:
![$$ i_{\mathrm{ c}}^{\mathrm{ D}} = m\int\nolimits_{{{{\mathrm{ r}}_{\max}}}}^{{{{\mathrm{ r}}_{\max }}}} {{N_0}(r)} \left[ {\sum\limits_i {{\alpha_i}{{\overline{N}}_i}(r,t)} } \right]\mathrm{ d}r $$](/wp-content/uploads/2017/03/A299540_1_En_7_Chapter_Equ000716.gif)
(15)
The ideal case is such that the fluorescence decay of the donor in the absence of an acceptor is mono-exponential. In such a case, all molecules share a single value of R o , the sum in Eq. 15 reduces to one term, and the reactive term, k i (r) Eq. 13, can be replaced by a simpler expression:
![$$ k(r)=-1/\tau \left[ {1+{{{({R_{\mathrm{ o}}}/r)}}^6}} \right] $$](/wp-content/uploads/2017/03/A299540_1_En_7_Chapter_Equ000717.gif)
(16)
In a case where the diffusion rate is known to be negligible on the time scale of the lifetime of the excited state of the donor, the Fick term in Eq. 12 is zero and N o(r) can be derived directly from an analysis of the donor decay curve. In such a case, Eq. 12 can be replaced by [59] (see Notes 10 and 11):
(17)
3.4 Experimental Methods of trFRET Applications in Characterization of Protein Conformation and Dynamics and Intermolecular Interactions
The transfer efficiency in an ensemble of protein molecules cannot be used for calculation of mean interprobe distances due to its nonlinear distance dependence and the intrinsic heterogeneity of conformations. Only quasi-mean distances can be determined, and changes of FRET efficiency can be related to changes in the distances. This limitation highlights the strength of methods of time-resolved FRET measurements in the ensemble and the single-molecule detection modes.
3.4.1 Time-Resolved Measurements
Equations 6, 7, 8, and 9 are used for the determination of the average FRET efficiency by time-resolved measurements. The main technical advantage of this measurement is that there is no need to know the concentrations of the proteins, and the accuracy of the lifetime measurements surpasses that of the steady-state intensity measurements.
The fluorescence decay curves of the probes in trFRET experiments contain detailed information on heterogeneity of the ensembles of proteins (Fig. 4).
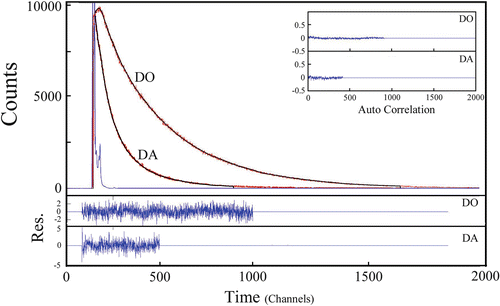
Fig. 4
Fluorescence decay curves of tryptophan in mutants of α-synuclein, one labeled with the donor-only (the DO experiment) and the other labeled by both probes (the DA experiment). The associated residuals and the autocorrelation function are shown in the lower and upper insets. The decay rate of the tryptophan residue in the DA mutant is accelerated due to the FRET effect. The residuals (bottom) and the corresponding autocorrelation functions (upper right) served as indicators of the quality of fit of the experimental data to a multiexponential function. The average lifetime of tryptophan for the DO mutant was 2.2 ns. The time equivalent of each channel is 12.5 ns and the lifetime components were τ 1 ≈ 4 ns (30–55 %), τ 2 ≈ 1.8–2.3 ns (30–45 %), and τ 3 ≈ 0.8 ns (15–30 %)
The technology of time-resolved fluorescence measurements matured during the last quarter of the twentieth century. Fluorescence decay can be detected either by the single-photon counting method or by the phase modulation method, and in principle, both methods are equivalent. While phase experiments are relatively easy to perform, single-photon counting techniques offer more straightforward methods for incorporation of acceptor decay curves in the analysis and easier control of background subtraction and other corrections.
3.4.2 Data Analysis
The basic procedure used for analysis of time-resolved FRET experiments is based on curve fitting methods. In this procedure, the parameters of the distance distribution function, the diffusion coefficient, the fluorescence lifetimes, and their associated pre-exponents are searched [60, 61].
The calculated fluorescence decay profile,  , is composed of both the donor and the acceptor decay curves,
  and
and  , respectively, which are calculated using the Förster theory applied to the relevant model distribution:
, is composed of both the donor and the acceptor decay curves, and , respectively, which are calculated using the Förster theory applied to the relevant model distribution:(18)
Several computational methods were developed to search for the set of free parameters. The maximum entropy method (MEM) is also applied to the analysis of time-resolved fluorescence and FRET experiments. These methods yield the theoretical decay curve best fitted to the experimentally recorded fluorescence decay curves  [62, 63]. This procedure is inherently difficult since the analysis of any multiexponential decay curve is a mathematically “ill defined” problem [64, 65]. The quality of fit of the experimental and calculated curves is judged by the minimization to the χ 2 values and the tests for randomness of the deviations [60, 65].
[62, 63]. This procedure is inherently difficult since the analysis of any multiexponential decay curve is a mathematically “ill defined” problem [64, 65]. The quality of fit of the experimental and calculated curves is judged by the minimization to the χ 2 values and the tests for randomness of the deviations [60, 65].The differential equation 15 does not have a simple general analytical solution (except for specific cases). Consequently, a numerical solution based on the finite difference (FA) method [66, 67] was applied. Therefore, the most common current practice is the use of model distribution functions for N o(r) with a small number of free parameters (Fig. 5). The model used in the experiments described below is a Gaussian distribution (N o(r) = C{f4πr 2 exp[−a 1(r−μ 1)]2+(1−f) 4πr 2 exp [−a 2(r−μ 2)]2}), where a i and μ i are free parameters which determine the width and the mean of the distributions, respectively, f is the equilibrium fraction of subpopulation 1, and C is a normalization factor. (When two subpopulations are assumed, Eq. 15 is solved for each subpopulation, and the two computed decay curves are then summed up and fitted to the experimental curve.) A model including the contribution of intramolecular diffusion can also be used in this context.
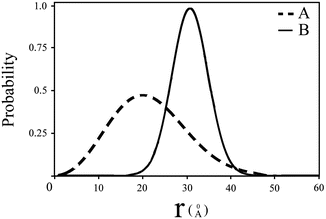
Fig. 5
Intramolecular end-to-end distance distributions which were obtained by analysis of fluorescence decay curves of the probes attached to a protein molecule which exist in two conformations in solution. The analysis is based on solution of Eq. 12 and the curve fitting algorithm. The parameters of interest are the mean and the width of the distributions and the ratio of the two subpopulations
Uncertainty ranges in the value of each parameter obtained by the fitting procedure are enhanced by the random noise level and correlations between the parameters. These ranges are routinely reduced by computing each set of parameters by global analysis of multiple independent measurements monitoring one system. In particular, coupled analysis of the fluorescence decay of both the donor and the acceptor probes contributes to overdetermination of the free parameters. Whatever methods are used for data analysis, the best fit must be tested by the statistical tests and fine details of the distribution of the residuals (see Note 11).
3.5 Single-Molecule Detection-Based trFRET Methods
Single-molecule detection (SMD) technology enables determination of FRET efficiency and time-resolved (tr)FRET determination of one molecule at a time in an ensemble of double-labeled molecules. The main advantages of using this technology are (a) resolution of subpopulations in ensembles of FRET active molecules (since the characteristics of the ensemble are determined by summing up the individual systems in the ensemble, free of any assumed model) and (b) resolution of dynamic changes between and within subpopulations; in contrast, ensemble detection methods (which depend on population synchronization) are limited in both these respects. General rules can be derived only from knowledge of characteristics of ensembles of molecules, due to the stochastic nature of the elementary steps of all molecular processes. Yet, an ensemble of labeled protein molecules can be assumed to be an ergodic system that will yield the same description by measuring either an infinite number of individual molecules for a brief time period or a single system for infinite time. Current SMD technology allows us to track each photon emitted from a labeled protein, along with several of its properties: the time of emission, the energy (wavelength range), and polarization.
The main factors that limit the applicability of trFRET measurements under SMD measurements are the inherent limits of the flux of fluorescence photons from any single molecule and the finite number of excitation/emission cycles’ that organic molecules can undergo before photobleaching. The rate of accumulation of a statistically significant number of photons in such experiments is usually much lower than the fundamental rates of protein conformational dynamics. Therefore, even in the SMD mode of measurement, the results represent an average of a structural characteristic of the labeled protein molecule over a finite time interval. In an ensemble measurement, a high number of molecules from the ensemble contribute to the signal. Methods were developed to maximize the quality and types of data that can be obtained in SMD-trFRET experiments.
3.6 Typical Single-Molecule FRET (smFRET) Experiment Setup and Measurements
A drop (generally at picomolar concentration) of single- or double-labeled protein (using probes with high extinction coefficient and quantum yield) with FRET donor and acceptors is placed on top of a cover slip on a confocal microscope stage. The solution is excited by either continuous wave (cw) or pulsed laser illumination tightly focused inside the solution. The excitation power is weak (tens of microwatts) so that only at the focal volume will the flux of photons be sufficiently high to yield high local excitation intensity inside a Gaussian illumination profile, with a typical volume of 1 femtoliter. (This volume usually contains none or one molecule at a time and with low probability even two or more.) When a single molecule is in the focal volume it will be excited; photons are emitted either from donor fluorescence or from acceptor fluorescence after excitation energy is transferred due to FRET. These photons are then collected by at least two sensitive detectors (typically avalanche photodiodes). The wavelength range detected by each detector is selected by optical filters specific for either the donor or the acceptor fluorescence spectra. Each photon detected by each detector is registered with an absolute arrival time relative to the beginning of the measurement, called the macrotime. The photon arrival macrotimes are recorded in the donor/acceptor detection channels. The detection channels register all detection events including shot-noise-related events. Those are events that do not originate from fluorescence but from scattering leakage, from thermal electrons, or from detector afterpulsing [68, 69]. The shot-noise signals are weak but frequent in comparison to the signal events originating from fluorescence. A signal event that exceeds a certain predefined threshold of photon flux within a predetermined time window is called a photon burst.
When performing smFRET measurements, the detection channels register photon bursts originating from the donor fluorescence and acceptor bursts generated from acceptor fluorescence. The Proximity Ratio (PR) Eq. 19, used for FRET determination, is defined as the ratio of the number of single-photon events registered at the acceptor channel (under excitation at the donor excitation wavelength) in one burst,  , divided by the total events (in all channels and also under excitation at the donor excitation wavelength) registered for that given burst,
  :
:
, divided by the total events (in all channels and also under excitation at the donor excitation wavelength) registered for that given burst, :(19)
Figure 6 illustrates how data is collected and accumulated to a FRET histogram. Photon counts (including donor and acceptor bursts) are accumulated in predetermined time intervals, called time bins (usually in the ms range, comparable to typical diffusion times of macromolecules through the focal volume) for both the donor and the acceptor detection channels. For those time bins having total number of photons higher than a predetermined threshold (e.g., 25 photons), the PR value is calculated. A histogram is then constructed showing the number of events (bursts) as a function of the calculated PR values (see Notes 13 and 14 for experimental details). Various modes of data analysis were developed for extracting subpopulation and dynamic characteristics of the molecules as described below.
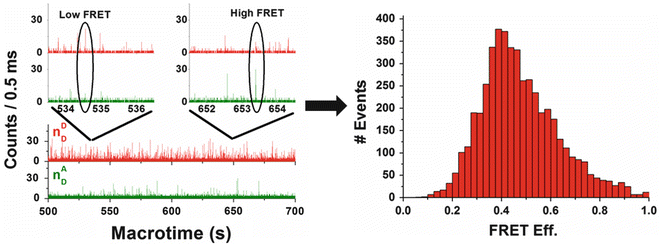
Fig. 6
An example of the mode of accumulation of FRET-related single-molecule bursts towards formation of a FRET histogram. A sample of AK molecules labeled at the CORE domain as well as at the ATP-binding (LID) domain was used. The plot on the top focuses on typical smFRET bursts out of a long train of bursts (middle). FRET efficiency is calculated for each burst that had a combined number of photons above a given threshold (here, 25 photons). The FRET efficiency values are then accumulated into a FRET histogram. The skewed histogram suggests two subpopulations
The calculated PR values are affected by several sources of non-FRET-related photons that might affect the FRET efficiency calculation: (a) The photons detected in the acceptor channel,  , include photons resulting from direct excitation of the acceptor [70–72]. (b) The red edge of the donor emission may be passed through the filter selecting for the acceptor emission (“leakage” problem) [72]. (c) The two detectors may have different detection efficiencies, and the two dyes (donor and acceptor labels) often have different fluorescence quantum yields. A correction factor, the γ factor, is therefore used. It is proportional to the ratio of the quantum yields of the acceptor and the donor and the ratio of the corresponding channel detection efficiencies. Corrections for direct acceptor excitation (a), donor fluorescence leakage to the acceptor channel (b), and the quantum yield and detection efficiency ratios (c) should be taken into account to yield the energy transfer efficiency, E (see Note 15).
, include photons resulting from direct excitation of the acceptor [70–72]. (b) The red edge of the donor emission may be passed through the filter selecting for the acceptor emission (“leakage” problem) [72]. (c) The two detectors may have different detection efficiencies, and the two dyes (donor and acceptor labels) often have different fluorescence quantum yields. A correction factor, the γ factor, is therefore used. It is proportional to the ratio of the quantum yields of the acceptor and the donor and the ratio of the corresponding channel detection efficiencies. Corrections for direct acceptor excitation (a), donor fluorescence leakage to the acceptor channel (b), and the quantum yield and detection efficiency ratios (c) should be taken into account to yield the energy transfer efficiency, E (see Note 15).The E values of each burst are accumulated to yield an energy transfer efficiency histogram such as that shown in Fig. 6. Such a histogram is the main mode of data presentation for smFRET experiments. It produces “model-free distribution,” which is a distance-related characteristic of conformational subpopulations in ensembles of labeled protein molecules. A minimal width of the FRET efficiency distribution is contributed by the shot noise, defined by Eq. 20 [73]:
(20)
It has also been established that energy transfer efficiency histograms with widths higher than the shot-noise-limited width qualitatively report on the existence of more than one subpopulation of molecules and possible dynamic exchange between subpopulations [69, 74]. In millisecond time intervals (a typical time bin), a single molecule might undergo transitions between different conformations (see Note 16). Using Eq. 20 one can clearly understand that the apparent skewness of the FRET histogram shown in Fig. 6 is actually two FRET efficiency populations combined and could not be explained by a shot-noise-limited single population.
The mean and the width of the FRET efficiency histograms are a function of both the equilibrium distribution of conformations in the ensemble and the rates of their interconversion. The dynamic and time-independent characteristics can be resolved either by FRET fluorescence cross-correlation spectroscopy (FRET–FCCS) [8, 75–77] or by analyzing the rates of decay of the fluorescence of the donor and the acceptor probes. All the information needed for either modes of analysis is available in the registered photon arrival times. In the FRET-related FCCS analysis, the data originating from donor and acceptor detected bursts of a given E subpopulation are cross correlated. If an exponential anticorrelated trend appears in the cross-correlation function, this represents the interconversion relaxation time of the molecules between different distance-related states for times faster than typical diffusion time through the focal volume. Analysis of single-molecule trFRET data can further resolve the number of fast interconverting populations and the structural characteristics of each such one of them.
3.7 The Strength of Time-Resolved smFRET Analysis
In time-correlated single-photon counting (TCSPC) with a single-molecule fluorescence detection system, the time elapsed between the moment of excitation and the moment of detection of each detected photon event is registered. This is the photon’s microtime. A histogram graphing the number of photon counts vs. their microtime values yields the donor and acceptor fluorescence decays. That histogram can be accumulated by adding all photon events collected over extended period of time yielding fluorescence decays identical to the ones achieved by ensemble-level measurements.
Microtime histograms can be accumulated per single bursts by a method called burst-integrated fluorescence lifetime (BIFL) [78]. Best fits to single lifetime exponential functions yield an average fluorescence lifetime for a given burst. The burst-related fluorescence lifetimes as well as E values are accumulated in two-dimensional histograms, such as that shown in Fig. 7, in a method called multiparameter fluorescence detection (MFD) [70, 79–84]. In the example shown, the E–τ correlogram is obtained by analysis of the single-molecule trFRET experiment using double-labeled AK molecule labeled at its CORE domain as well as at its ATP-binding LID domain. On a millisecond time scale, it has two shot-noise-limited E subpopulations and at least four donor average lifetime components. When correlating lifetime components and FRET populations, it is evident that the low FRET population has two characteristic donor lifetimes. Since donor fluorescence lifetime is directly linked to FRET efficiency, such results indicate that there are two states represented by two different distance distributions, which interconvert at least ten times faster than the 1 ms time bin used. This interpretation relies on the assumption that each state distance distribution is represented by a single fluorescence lifetime. An E–τ correlogram can be quantitatively analyzed on the basis of models that distinguish static from dynamic phenomena [70, 81] (see Notes 17 and 18).
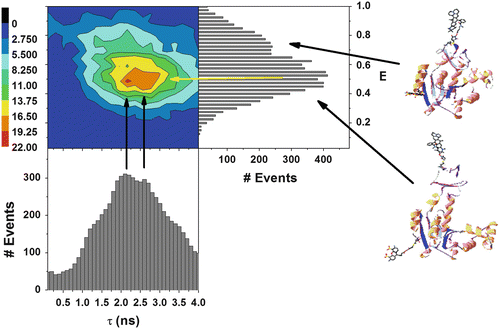
Fig. 7
Multiparameter fluorescence detection (MFD) FRET. Average donor lifetimes (x axis) as well as E values per burst (y) are accumulated into an E–τ correlogram, for analysis of the registered photon events obtained from smFRET measurement of double-labeled AK molecules (labeled at the CORE and the LID domains). Here, one can see that in the apo-AK, the molecule has two conformations characterized by two states of the interface between the LID and CORE domains; these open– and closed-like states interconvert with a time constant in the range of the burst bin time (1 ms) or slower. The open conformation has two characteristic average fluorescence lifetimes, which suggest additional dynamics occurring faster than the burst time scale
In a further analysis, microtime histograms can also be accumulated vs. the smFRET E values of the bursts [85], as shown in Fig. 8. A fluorescence decay curve obtained from a single burst is affected by and, hence, contains information regarding the average rates of conformational fluctuations in a single molecule. These occur on a time scale orders of magnitude faster than the burst duration. Each fluorescence decay component resolved in analysis of molecules sharing the same E value describes a sub-ensemble of all molecules having a given averaged FRET efficiency, i.e., most probably sharing a similar mean intramolecular distance. The example presented in Fig. 8 shows the smFRET histogram as well as its donor and acceptor fluorescence decays at different E value intervals obtained for the same AK sample shown in Fig. 7. Two distinct smFRET subpopulations are resolved. The donor fluorescence decays are a single exponential for E value ranges in which the overlap between FRET populations is low (E is 0.2–0.3; E is 0.7–1) and exhibit a clear deviation from a single exponent for E value ranges where the two FRET populations overlap (E is 0.3–0.7). Acceptor fluorescence decay curves can also be similarly analyzed (see Note 18).
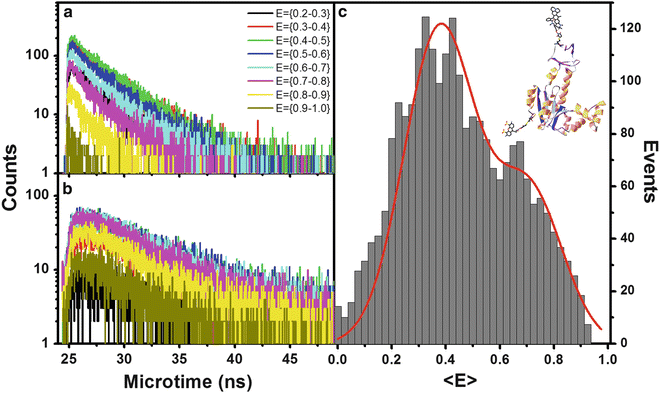
Fig. 8
Fluorescence decays per E values obtained from analysis of apo-E. coli adenylate kinase labeled at the LID and CORE domains. Donor fluorescence decay is single exponential for E values of the low FRET population with no overlap with the high FRET population (E = (0.2–0.43)); when overlap starts, a bi-exponential decay emerges. At high E values when population overlap ends (0.7–1.0), the bi-exponential trend ends and a short lifetime monoexponential decay is found. FRET in acceptor fluorescence decays is recognized by the grow-in phase of the intensity vs. time curve
Thus, fluorescence decay kinetics as a function of either a burst or an E value resolve subpopulations in the ensemble. Therefore, as in ensemble-level trFRET, such data should be fitted to a model that takes into account a distance distribution and an interchromophoric diffusion coefficient for each fast interconverting population. There are many advantages but also caveats for this approach (see Notes 18 and Note 19). The combination of smFRET to resolve slow interconverting conformational populations, FCCS to detect the existence of faster dynamics, and trFRET in both the ensemble and single-molecule modes is generally most effective for characterization of conformational dynamics over the nanosecond to seconds time regimes.
Stay updated, free articles. Join our Telegram channel

Full access? Get Clinical Tree


