FIGURE 13-1. The hypothalamus may secrete a releasing hormone in response to low levels of stimulating, inhibitory, or target organ hormone. This releasing hormone causes the release of a stimulating or inhibitory hormone that in turn controls the release of target organ hormone.
GLUCOSE HOMEOSTASIS
Glucose serves as the fuel for most cellular functions and is necessary to sustain life. Carbohydrates ingested from a meal are metabolized in the body into glucose. Glucose is absorbed from the gastrointestinal (GI) tract into the bloodstream where it is utilized in skeletal muscle for energy.
Glucose is also stored in the liver in the form of glycogen (glycogenesis) and is converted in adipose tissue to fats and triglycerides (lipogenesis). Insulin, which is produced, stored, and released from beta cells of the pancreas, facilitates these anabolic processes. The liver, skeletal muscle, brain, and adipose tissue are the main tissues affected by insulin. To induce glucose uptake, insulin must bind to specific cell-surface receptors. Most secreted insulin is taken up by the liver, while the remainder is metabolized by the kidneys. About 80% of glucose uptake is independent of insulin. These insulin-independent cells include nerve tissue, red blood cells (RBCs), mucosal cells of the GI tract, and exercising skeletal muscle.1,2
In the fasting state, insulin levels decrease, resulting in an increase in glycogen breakdown by the liver (glycogenolysis) and an increase in the conversion of free fatty acids to ketone bodies (lipolysis).1,2
When glucose concentrations fall below 70 mg/dL, an event known as hypoglycemia occurs resulting in the release of glucagon by the alpha cells of the pancreas. Glucagon stimulates the formation of glucose in the liver (gluconeogenesis) and glycogenolysis. Glucagon also facilitates the breakdown of stored triglycerides in adipose tissue into fatty acids (lipolysis), which can be used for energy in the liver and skeletal muscle. In addition to glucagon secretion, hypoglycemia leads to secretion of counter regulatory hormones such as epinephrine, cortisol, and growth hormone. Glucagon and, to a lesser degree, epinephrine promote an immediate breakdown of glycogen and the synthesis of glucose by the liver. Cortisol increases glucose levels by stimulating gluconeogenesis. Growth hormone inhibits the uptake of glucose by tissues when glucose levels fall below 70 mg/dL.3,4
Other hormones, amylin and incretin, affect glucose concentrations. Amylin, a beta-cell hormone co-secreted with insulin at a molar ratio of 1:20–50 in response to a glucose challenge, was discovered in 1987. Amylin is a neuroendocrine hormone that complements the actions of insulin by restraining the vagus nerve-mediated rate of gastric emptying, thereby slowing intestinal carbohydrate absorption and resulting in lower postprandial glucose (PPG) levels. This delay in gastric emptying has been found to be the same in patients with type 1 and type 2 DM mellitus (DM) that were without complications. Amylin also suppresses hepatic glucose output by inhibiting glucagon after ingestion of a meal.5-8 In animal studies, amylin was found to induce postprandial satiety in direct proportion to food intake.6 The administration of amylin has been reported to decrease food intake, thereby resulting in weight loss in patients with type 2 DM.9,10
Recent studies have shown that beta-cell response is greater after food ingestion or when glucose is given orally versus after intravenous (IV) glucose infusion. This difference in insulin secretion has been termed the incretin effect, which implies that food ingestion causes the release of specific gut hormones known as incretins that enhance insulin secretion beyond the release caused by the rise in glucose secondary to absorption of digested nutrients.11,12 Studies in humans and animals have shown that the incretin hormones glucagon-like peptide-1 (GLP-1) and glucose-dependent insulinotropic peptide (GIP) stimulate insulin release when glucose levels are elevated.12-14
After food is ingested, GIP is released from K cells in the proximal gut (duodenum), and GLP-1 is released from L cells in the distal gut (ileum and colon). Under normal circumstances, dipeptidyl-peptidase 4 (DPP-4) rapidly degrades these incretins to their inactive forms after their release into the circulation. As a result, the plasma half-life of GIP and GLP is less than 5 minutes.12
GLP-1 and GIP stimulate insulin response in pancreatic beta cells, and GLP-1 (but not GIP) also suppresses glucagon production in pancreatic alpha cells when the glucose level is elevated. The subsequent increase in glucose uptake in muscles and reduced glucose output from the liver help maintain glucose homeostasis. Thus, the incretins GLP-1 and GIP are important glucoregulatory hormones that positively affect glucose homeostasis by physiologically helping to regulate insulin in a glucose-dependent manner.12,15 The kidney contributes to glucose homeostasis primarily by the reabsorption and return of glucose to the circulation. Glucose is freely filtered by the glomerulus, and in healthy individuals, approximately 180 g of glucose are filtered daily and almost all of this is reabsorbed by the proximal tubule. Glucose reabsorption by the kidney is mediated by a class of specific glucose transport proteins, the sodium glucose cotransporters (SGLTs). One member of this family, SGLT2, is responsible for the majority of renal glucose reabsorption and is located on the luminal side of cells in the initial part of the nephron, the early proximal convoluted tubule. Another member of this family, SGLT1, is expressed mainly in the intestine, but it is also present in skeletal muscle, heart, and, based on animal studies, in the late proximal tubule where it accounts for additional glucose reabsorption from the glomerular filtrate. Glucose is taken up into the cell by SGLTs and exits across the basolateral membrane into the interstitium by facilitative diffusion via the facilitative glucose transporters GLUT2 and GLUT1.16
In individuals without diabetes, once plasma glucose concentrations exceed approximately 180 mg/dL (the renal threshold), renal glucose reabsorption is saturated and glucose starts to appear in the urine. In hyperglycemic individuals, the renal threshold may be exceeded, and large amounts of glucose may be excreted in the urine. However, the kidneys continue to reabsorb glucose, and in patients with type 2 DM, the renal capacity to reabsorb glucose may be increased, which further contributes to hyperglycemia.17
In summary, glucose concentrations are affected by any factor that can influence glucose production or utilization, glucose absorption from the GI tract, glycogen catabolism, insulin production, or secretion. Fasting suppresses the rate of insulin secretion, and feasting generally increases insulin secretion. Increased insulin secretion lowers serum glucose concentrations, while decreased secretion raises glucose concentrations.1–4
DIABETES MELLITUS
The three most commonly encountered types of DM:
- Type 1 DM (formally known as insulin-dependent diabetes mellitus [IDDM])
- Type 2 DM (formerly known as adult onset or noninsulin dependent diabetes mellitus [NIDDM])18
- Gestational DM
Type 1 DM is characterized by a lack of endogenous insulin, predisposition to ketoacidosis, and an abrupt onset. Some patients present with ketoacidosis after experiencing polyuria, polyphagia, and polydipsia for several days. Typically, this type of DM is diagnosed in children and adolescents but may also occur at a later age. In contrast, patients with type 2 DM are not normally dependent on exogenous insulin to sustain life and are not ketosis prone, but they are usually obese and are more than 40 years old. There is an alarming increase in the number of children and adolescents diagnosed with type 2 DM. Although there is a genetic predisposition to the development of type 2 DM, environmental factors such as high-fat diets and sedentary lifestyles contribute to the disorder. Type 2 DM patients are both insulin deficient and insulin resistant (Table 13-1).1,2
Many type 2 DM patients are asymptomatic so diagnosis often depends on laboratory studies. Concentrations of ketone bodies in the blood and urine are typically low or absent, even in the presence of hyperglycemia. This finding is common because the lack of insulin is not severe enough to lead to abnormalities in lipolysis and significant ketosis or acidosis.
Because of the chronicity of asymptomatic type 2 DM, many patients with type 2 DM present with evidence of microvascular complications (neuropathy, nephropathy, and retinopathy) and macrovascular complications (coronary artery, cerebral vascular, and peripheral arterial disease) at the time of diagnosis. Type 2 DM is often discovered incidentally during glucose screening sponsored by hospitals and other healthcare institutions.1,2
Gestational diabetes mellitus, a third type of glucose intolerance, develops during the third trimester of pregnancy. Patients with gestational DM have a 30% to 50% chance of developing type 2 DM.19 A woman with diabetes who becomes pregnant, or a woman diagnosed with diabetes early in her pregnancy, are not included in this category.
Pathophysiology
Type 1 DM usually develops in childhood or early adulthood and accounts for up to 10% of all patients with diabetes. Patients are usually thin, have an absolute lack of insulin, and require exogenous insulin to prevent diabetic ketoacidosis (DKA) and sustain life. Genetics as well as environmental and immune factors are the major factors thought to cause type 1 DM.20
Over 90% of all type 1 DM patients have a combination of human leukocyte antigen (HLA)-DQ coded genes, which increase the risk of developing type 1 DM. Type 1 DM may result from a trigger, which could be environmental or viral. Viral infections may stimulate monocytes and macrophages that activate T cells, which attack beta cells, thereby decreasing insulin production. Bovine serum albumin has also been identified as an environmental trigger. Therefore, it is believed that exposure to cow’s milk may increase the risk of developing type 1 DM in patients with a genetic predisposition. An immunologic attack against insulin may also occur. The combination of an autoimmune attack on beta cells and on circulating insulin results in insulin insufficiency.20-22
Type 2 DM involves multiple organ dysfunction that results in insulin resistance and insulin deficiency. During the early stages of type 2 DM, the ability of insulin to facilitate the diffusion of glucose into the cell is impaired. Defects in insulin receptor function, insulin receptor-signal transduction pathway, glucose transport and phosphorylation, and glycogen synthesis and oxidation contribute to muscle insulin resistance. The pancreas compensates for this deficiency by secreting larger amounts of insulin. Patients remain euglycemic until the pancreatic beta cells are no longer able to compensate for the insulin resistance. Hence, insulin is unable to suppress hepatic glucose production and hyperglycemia results (Figure 13-2).1,22-24
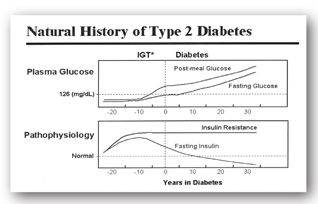
FIGURE 13-2. In the early stages of type 2 DM, the pancreatic beta cells compensate for insulin resistance by secreting more insulin. Over time, these cells burn out resulting in insulin deficiency and hyperglycemia. IGT = impaired glucose tolerance. (Source: Adapted from International Diabetes Center [IDC], Minneapolis, MN.)
Recently, other causes for the excessive postprandial increase in plasma glucose levels have been identified. Because amylin is co-secreted with insulin, there is an absolute deficiency of this hormone in patients with type 1 DM. In patients with type 2 DM, amylin levels decrease progressively. Whether due to the destruction of pancreatic beta cells in patients with type 1 DM or the progressive exhaustion of beta-cell function in patients with type 2 DM, amylin deficiency is now recognized as a contributor to the development of DM.12-15
The incretin effect is abnormal in those with type 2 DM mellitus. The diminished incretin effect observed in patients with type 2 DM may be due to reduced responsiveness of pancreatic beta cells to GLP-1 and GIP or to impaired secretion of the relevant incretin hormone.13
Secondary Causes
Diabetes mellitus may be the result of other pancreatic and hormonal diseases, medications, and abnormalities of the insulin receptor.13 Pancreatic cell destruction may be related to diseases, such as cystic fibrosis, or autoimmune conditions. It can be related to drugs (e.g., L-asparaginase, streptozocin, and pentamidine). Similarly, hyperglycemia may result from hormonal disease in which concentrations of circulating catecholamines and glucocorticoids are increased (e.g., catecholamine-secreting pheochromocytoma and Cushing syndrome, respectively).13
Various medications or chemicals may induce hyperglycemia and glucose intolerance. Beta-adrenergic blocking agents may decrease or impair insulin secretion in patients with diabetes. Beta-adrenergic blocking agents may decrease glycogenolysis and gluconeogenesis. Diazoxide and phenytoin may decrease insulin secretion resulting in increased glucose levels. High doses of thiazides and loop diuretics may cause hyperglycemia by an unknown mechanism.24 It should be noted that potassium-sparing diuretics have little or no effect on glucose levels.
Estrogen products influence glucose tolerance to varying degrees, depending on the formulation. In one study, women taking combination oral contraceptives for at least 3 months had plasma glucose concentrations 43% to 61% higher than controls.25 Monophasic and triphasic combination products diminished glucose tolerance, whereas progestin-only products did not. Insulin resistance was the proposed mechanism, and fasting plasma glucose (FPG) concentrations were not adversely affected. Table 13-2 lists medications with the potential to cause hyperglycemia.
aLoop diuretics are furosemide, bumetanide, torsemide, and ethacrynic acid. Torsemide has less effect on glucose concentrations.24
bClinical significance is less clear.
cProgestin-only products do not affect glucose tolerance.
dOral sympathomimetics, such as those found in decongestants, are unlikely to be more of a cause of increased glucose than the “stress” from the illness for which they are used.
eAfter initial hypoglycemia, which occurs in about 4–14 (average 11) days.
Diagnostic Laboratory Tests
C-Peptide
Fasting range: 0.78–1.89 ng/mL (0.26–0.62 nmol/L SI unit) Range 1 hr after a glucose load: 5.00–12.00 ng/mL (during a glucose tolerance test)
C-peptide levels are used to evaluate residual beta-cell function. A C-peptide test is done to
- Distinguish between type 1 and type 2 DM
- Identify the cause of hypoglycemia
- Check to see whether a tumor of the pancreas (insulinoma) was completely removed
Insulin is synthesized in the beta cells of the islets of Langerhans as the precursor, proinsulin. Proinsulin is cleaved to form C-peptide and insulin, and both are secreted in equimolar amounts into the portal circulation. By measuring the levels of C-peptide, the level of insulin can also be calculated. High levels of C-peptide generally indicate high levels of endogenous insulin production. This may be a response to high levels of blood glucose caused by glucose intake and/or insulin resistance. High levels of C-peptide also are seen with insulinomas (insulin-producing tumors) and may be seen with hypokalemia, pregnancy, Cushing syndrome, and renal failure.
Low levels of C-peptide are associated with low levels of insulin production. This can occur when insufficient insulin is being produced by the beta cells, when production is suppressed by exogenous insulin, or with suppression tests that involve substances such as somatostatin.26
A C-peptide test can be done when DM has just been found and it is not clear whether type 1 or type 2 DM is present. A patient with type 1 DM has a low level of insulin and C-peptide. A patient with type 2 DM has a normal or high level of C-peptide. When a patient has newly diagnosed type 1 or type 2 DM, C-peptide can be used to help determine how much insulin the patient’s pancreas is still producing. With type 2 DM, the test may be ordered to monitor the status of beta-cell function and insulin production over time and to determine if/when insulin injections may be required.
A C-peptide test can also help identify the cause of hypoglycemia, such as excessive use of medicine to treat diabetes or a noncancerous growth (tumor) in the pancreas (insulinoma). Because synthetic insulin does not have C-peptide, a patient with hypoglycemia from taking too much insulin will have a low C-peptide level. An insulinoma causes the pancreas to release too much insulin, which causes hypoglycemia. Such a patient will have a high level of C-peptide in the blood.26
Even though they are produced at the same rate, C-peptide and insulin leave the body by different routes. Insulin is processed and eliminated mostly by the liver, while C-peptide is removed by the kidneys. The half-life of C-peptide is about 30 minutes as compared to the half-life of insulin, which is 5 minutes. Thus, there will be usually about 5 times as much C-peptide in the bloodstream as insulin.26
Diabetes-Related Autoantibody Testing
Diabetes-related (islet) autoantibody testing is used to distinguish between type 1 DM and type 2 DM. Determining which type of diabetes is present allows for early treatment with the most appropriate therapy to avoid complications from the disease. The four most common autoantibody tests used to distinguish between type 1 DM and type 2 DM are islet cell cytoplasmic autoantibodies (ICA), glutamic acid decarboxylase autoantibodies (GADA), insulinoma-associated-2 autoantibodies (IA-2A), and insulin autoantibodies (IAA).
The autoantibodies seen in children are often different than those seen in adults. Insulin autoantibodies is usually the first marker to appear in young children. As the disease evolves, this may disappear and ICA, GADA, and IA-2A become more important. Insulinoma-associated-2 autoantibodies is less commonly positive at the onset of type 1 DM than either GADA, or ICA. Whereas about 50% of children with new-onset type 1 DM will be IAA positive, IAA positivity is not common in adults.
A combination of these autoantibodies may be ordered when a person is newly diagnosed with diabetes and the healthcare provider wants to distinguish between type 1 and type 2 DM. In addition, these tests may be used when the diagnosis is unclear in persons with diabetes who have been diagnosed as type 2 DM but who have great difficulty in controlling their glucose levels with oral medications. If ICA, GADA, and/or IA-2A are present in a person with symptoms of DM, the diagnosis of type 1 DM is confirmed. Likewise, if IAA is present in a child with DM who is not insulin-treated, type 1 DM is the cause. If no diabetes-related autoantibodies are present, then it is unlikely that the diabetes is type 1 DM. Some people who have type 1 DM will never develop detectable amounts of islet autoantibodies, but this is rare. The majority of people, 95% or more, with new-onset type 1 DM will have at least one islet autoantibody.26
Laboratory Tests to Assess Glucose Control
The two most common methods used for evaluating glucose homeostasis are the FPG and glycosylated hemoglobin (A1c). The oral glucose tolerance test (OGTT) is mainly used to assess equivocal results from these two tests. Glycosylated hemoglobin and fructosamine tests are used to monitor long- and medium-term glucose control, respectively. Urine glucose monitoring in patients with DM has been replaced by fingerstick blood glucose tests. Therefore, discussion of this test is relatively brief.
With all of these tests, proper collection and storage of the sample and performance of the procedure are important. Improper collection and storage of samples for glucose determinations can lead to false results and interpretations. After collection, RBCs and white blood cells (WBCs) continue to metabolize glucose in the sample tube. This process occurs unless (1) the RBCs can be separated from the serum using serum separator tubes, or (2) metabolism is inhibited using sodium fluoride–containing (gray-top) tubes or refrigeration. Without such precautions, the glucose concentration drops by 5–10 mg/dL (0.3–0.6 mmol/L) per hour, and the measured glucose level will not reflect the patient’s FPG at collection time. In vitro, metabolic loss of glucose is hastened in samples of patients with leukocytosis or leukemia.27
Fasting Plasma Glucose and 2-Hour Postprandial Glucose
The categories of fasting plasma glucose (FPG) values are as follows:
- FPG <100 mg/dL (5.5 mmol/L) represents normal fasting glucose
- FPG ≥100 (5.5 mmol/L) and <126 mg/dL (7.0 mmol/L) represents prediabetes (previously termed impaired fasting glucose [IFG])
- FPG ≥126 mg/dL (7.0 mmol/L) represents provisional diagnosis of diabetes (the diagnosis must be confirmed as described below)18
An FPG concentration is the best indicator of glucose homeostasis. This test measures the ability of endogenous or exogenous insulin to prevent fasting hyperglycemia by regulating glucose anabolism and catabolism. Fasting plasma glucose may be used to monitor therapy in patients being treated for glucose abnormalities. For this test, the patient maintains his or her usual diet, and the assay is performed on awakening (before breakfast). This timing usually allows for an 8-hour fast. An FPG greater than 126 mg/dL (>7.0 mmol/L), found on at least two occasions, is diagnostic for DM (Table 13-3).
DM = diabetes mellitus; FPG = fasting plasma glucose; A1c = glycosylated hemoglobin; OGTT = oral glucose tolerance test.
aMultiply number by 0.056 to convert glucose to International System (SI) units (mmol/L).
The diagnosis of DM usually can be made if the 2-hour postprandial glucose (PPG) is equal to or greater than 200 mg/dL (>11.2 mmol/L), especially if previous tests reveal fasting hyperglycemia (Table 13-3).28 Testing in asymptomatic people should be considered in adults of any age who are overweight or obese (BMI ≥25 kg/m2) with one or more risk factors18:
- Physical inactivity
- A1c ≥5.7%, impaired glucose tolerance or impaired fasting glucose on a previous testing
- First-degree relative with diabetes
- Polycystic ovary syndrome
- Vascular disease, hypertension, or dyslipidemia
- High-risk ethnic groups (e.g., Native Americans, Latino/Hispanics, African Americans, Pacific Islanders)
- Women with a prior history of gestational DM)
- Individuals without these risk factors should be screened no later than 45 years of age. The American College of Endocrinology recommends that individuals from high-risk groups, aged greater than 30 years, be screened for DM every 3 years.29
Oral Glucose Tolerance Test
The categories for the oral glucose tolerance test (OGTT) are as follows:
- 2-hour postload glucose (PG), <140 mg/dL represents normal glucose tolerance
- 2-hour PG 140–199 mg/dL represents prediabetes (previously termed impaired glucose tolerance [IGT])
- 2-hour PG ≥200 mg/dL represents provisional diagnosis of diabetes (the diagnosis must be confirmed as described above)
The OGTT is used to assess patients who have signs and symptoms of DM but whose FPG is normal or suggests prediabetes (<126 mg/dL or <7.0 mmol/L). The OGTT measures both the ability of the pancreas to secrete insulin following a glucose load and the body’s response to insulin. Interpretation of the test is based on the plasma glucose concentrations drawn before and during the exam. This exam may also be used in diagnosing DM with onset during pregnancy if the disease threatens the health of the mother and fetus. The OGTT is not required for patients who have FPG levels greater than 126 mg/dL on at least two separate occasions as such values confirm the diagnosis of DM.28
The OGTT is performed by giving a standard 75-g dose of an oral glucose solution over 5 minutes following an overnight fast. The pediatric dose is 1.75 g/kg up to a maximum of 75 g. Blood samples commonly are drawn before the test, between 0 and 2 hours, and at 2 hours. The samples should be collected into tubes containing sodium fluoride, unless the assay will be performed immediately.28
If the patient vomits the test dose, the exam is invalid and must be repeated. The OGTT is diagnostic for DM if the 2-hour plasma glucose is at least 200 mg/dL (11.2 mmol/L). The patient is considered to have prediabetes if the 2-hour concentration is 140–199 mg/dL (7.8–11.2 mmol/L).
Pregnant women with risk factors (overweight or obese with a BMI greater than 25, family history of type 2 DM, hypertension, hyperlipidemia, high-risk ethnic group [Hispanic, African American, Native American, South or East Asian, or of Pacific Island descent]) should be screened at the first prenatal visit using standard diagnostic criteria. Pregnant women not previously known to have DM or risk factors, can be screened for gestational DM at 24–28 weeks gestation. A screening test is performed that measures plasma glucose fasting and plasma glucose at 1 and 2 hours after a 75-g oral glucose load. The diagnosis of gestational DM can be made when any of the following plasma glucose values are exceeded:
The OGTT should not be performed on individuals who are chronically malnourished, consume inadequate carbohydrates (<150 g/day), or are bedridden. Alcohol consumption and medications that cause hyperglycemia (Table 13-2) should be stopped if possible 3 days prior to the examination. Coffee and smoking are not permitted during the test.28
Glycosylated Hemoglobin
Normal range: 4% to 5.6%
A1c, also known as glycosylated or glycated A1c, is a component of the hemoglobin molecule. During the 120-day lifespan of an RBC, glucose is irreversibly bound to the hemoglobin moieties in proportion to the average serum glucose. The process is called glycosylation. Measurement of A1c is, therefore, indicative of glucose control during the preceding 2–3 months. The entire hemoglobin A1 molecule—composed of A1a, A1b, and A1c—is not used because subfractions A1a and A1b are more susceptible to nonglucose adducts in the blood of patients with opiate addiction, lead poisoning, uremia, and alcoholism.30,31 Because the test is for hemoglobin, the specimen analyzed is RBC and not serum or plasma.
Results are not affected by daily fluctuations in the blood glucose concentration, and a fasting sample is not required. Results can reflect overall patient compliance to various treatment regimens. With most assays, 95% of a normal individual’s hemoglobin is 4% to 6% glycated. An A1c ≥7% suggests poor glucose control. Patients with persistent hyperglycemia may have an A1c up to 20% (Table 13-4).30
aData in parentheses are 95% CIs. Linear regression eAG (mg/dL) = 28.7 × A1c − 46.7.
Source: Adapted from reference 35.
For years, the A1c has been used to monitor glucose control in people already diagnosed with DM. Initially it was not recommended for diagnosis since the test variability from laboratory to laboratory was too great for a diagnostic test. The A1c cut point of ≥6.5% identifies one-third fewer cases of undiagnosed DM than a fasting glucose cut point of ≥126 mg/dL. However, the lower sensitivity of the test at the cut point is offset by the test’s greater practicality, and wider use of this more convenient test may result in an increase in the number of diagnoses made.18
A few situations confound interpretation of test results. False elevations in A1c may be noted with uremia, chronic alcohol intake, and hypertriglyceridemia.31 Patients who have diseases with chronic or episodic hemolysis (e.g., sickle cell disease and thalassemia) generally have spuriously low A1c concentrations caused by the predominance of young RBCs (which carry less A1c) in the circulation. In splenectomized patients and those with polycythemia, A1c is increased. If these disorders are stable, the test still can be used, but values must be compared with the patient’s previous results rather than published normal values. Both falsely elevated and falsely lowered measurements of A1c may also occur during pregnancy. Therefore, A1c should not be used to screen for gestational DM.32-34
Affinity chromatography and colorimetric assay methods measure total A1c including subfractions A1a and A1b. Ion-exchange chromatography and high-performance liquid chromatography only measure the subfraction. The Cholestech GDX® and the Metrika A1cNow® are portable analyzers, which provide A1c results within 5–8 minutes.34 The American Diabetes Association (ADA) recommends A1c testing 1–2 times a year for patients with good glycemic control and quarterly in patients with poor control or whose therapy has changed.18
Fructosamine
Normal range: <285 µmol/L
Fructosamine is a general term that is applied to any glycosylated protein. Unlike the A1c test, only glycosylated proteins in the serum or plasma (e.g., albumin)—not erythrocytes—are measured. In nondiabetics, the unstable complex dissociates into glucose and protein. Therefore, only small quantities of fructosamine circulate. In patients with DM, higher glucose concentrations favor the generation of more stable glycation, and higher concentrations of fructosamine are found.
Fructosamine has no known inherent toxicological activity but can be used as a marker of medium-term glucose control. Fructosamine correlates with glucose control over 2–3 weeks based on the half-lives of albumin (14–20 days) and other serum proteins (2.5–23 days). As a result, high fructosamine concentrations may alert caregivers to deteriorating glycemic control earlier than increases in A1c.
Falsely elevated results may occur when
- Serum (not whole blood) hemoglobin concentrations are greater than 100 mg/dL (normally <15 mg/dL)
- Serum bilirubin is greater than 4 mg/dL
- Serum ascorbic acid is greater than 5 mg/dL36
Methyldopa and calcium dobesilate (the latter is used outside the United States to minimize myocardial damage after an acute infarction) may also cause falsely elevated results. Serum fructosamine concentrations are lower in obese patients with DM as compared to lean patients with DM.36 Some clinicians advocate the use of fructosamine concentrations as a monitoring tool for short-term changes in glycemic control (e.g., gestational DM). However, more clinical studies are required to determine if this test provides useful clinical information.37, 38
Normal range: negative
Glucose “spills” into the urine when the serum glucose concentration exceeds the renal threshold for glucose reabsorption (normally 180 mg/dL). However, a poor correlation exists between urine glucose and concurrent serum glucose concentrations. This poor correlation occurs because urine is “produced” hours before it is tested, unless the inconvenient double-void method (urine is collected 30 minutes after emptying of the bladder) is used. Furthermore, the renal threshold varies among patients and tends to increase in diabetes over time, especially if renal function is declining.
Urine testing gradually has been replaced by convenient fingerstick blood sugar testing, Urine glucose testing should be recommended only if the patient is unable or unwilling to perform blood glucose monitoring.39
The presence and amount of glucose in the urine can be determined by two different techniques. Commercial products that use copper-reducing methods (e.g., Clinitest®) provide the most quantitative estimate of the degree of glycosuria. Therefore, this method is preferred for patients who spill large quantities of glucose into the urine. The two-drop method can detect higher concentrations of glucose up to 5% as compared to the five-drop method, which can quantitate up to only 2%. Generally, copper-reducing products have poor specificity for glucose.
Contrary to popular belief, isoniazid, methyldopa, and ascorbic acid do not interfere with Clinitest®. The literature is unclear on whether chloral hydrate, nitrofurantoin, probenecid, and nalidixic acid interfere with this method. Patients should be aware that a “pass-through” phenomenon occurs with this test when more than 2% glucose is in the urine. During the test, a fleeting orange color may appear at the climax of the reaction and fade to a greenish-brown when the reaction is complete. The latter color (0.75% to 1%) may be incorrectly used to assess glucose levels, and the glucose concentration actually may be underestimated.
The second method of urine glucose testing is specific for glucose and provides a more qualitative assessment of it in the urine. Commercial products of this type (e.g., Tes-Tape®, Clinistix®, Diastix®, and Chemstrip®) consist of plastic dipsticks with paper pads that have been impregnated with glucose oxidase. These tests are sensitive to 0.1% glucose (100 mg/dL). Substances that may cause false-negative results with this type of test include ascorbic acid (high dose), salicylates (high dose), and levodopa. Interference also has been reported with phenazopyridine and radiographic contrast media, but the likelihood is less clear.40,41
Self-Monitoring Tests of Blood Glucose
Blood glucose meters and reagent test strips are commercially available so that patients may perform blood glucose monitoring at home. These systems are also used frequently in hospitals, where nurses rely on quick results for determining insulin requirements. The meters currently marketed are lightweight, relatively inexpensive, accurate, and user-friendly.
The first generation of self-monitoring blood glucose (SMBG) meters relied on a photometric analysis that was based on a dye-related reaction. This method, also termed reflectance photometry, light reflectance, or enzyme photometric, involves a chemical reaction between capillary blood and a chemical on the strip that produces a change in color. The amount of color reflected from the strip is measured photometrically. The reflected color is directly related to the amount of glucose in the blood. The darker color the test strip, the higher the glucose concentration. The disadvantages of this method are that the test strip has to be developed after a precise interval (the blood has to be washed away), a large sample size of blood (>12 microliter) is required, and the meter requires frequent calibration.42
Most SMBG meters today utilize an electrochemical or enzyme electrode process, which determine glucose levels by measuring an electric charge produced by the glucose-reagent reaction. These second-generation glucometers can further be subdivided according to the electrochemical principle used: amperometry or colorimetry. Amperometry biosensor technology requires a large sample size (4–10 µL). Furthermore, alterations in temperature or hematocrit levels may result in inaccurate results with this method. Such SMBG meters that employ the amperometry method include Sidekick Testing System® and Prestige IQ®.42
The colorimetry method involves converting the glucose sample into an electrochemical charge, which is then captured for measurement. An advantage of this system is that a small amount of blood (e.g., 0.3 mL) is enough to determine the blood glucose level. The colorimetry method is not influenced by changes in temperature and hematocrit levels. These monitors can use blood samples extracted from the arm and thigh too. At these alternative sites, there are fewer capillaries and nerve endings, allowing for a less painful needle stick. Some examples of second-generation glucometers that use the colorimetry method include Reli-On Ultima®, OneTouch Ultra®, and Freestyle® (Table 13-5).
| TABLE 13-5. Blood Glucose Monitorsa | ||||
| COMPANY AND CONTACT INFORMATION | METER NAME | KEY FEATURES | BLOOD SAMPLE SIZE (MICROLITER) | USER CODING NEEDED? |
| Abbott Diabetes Care (www.abbotdiabetescare.com) | FreeStyle Freedom Lite | C | 0.3 | No |
| FreeStyle Lite | B, C | 0.3 | No | |
| Precision Xtra | B, C, K | 0.6 | Yes | |
| AgaMatrix (www.wavesense.info) | WaveSense Jazz | B, C | 0.5 | No |
| WaveSense KeyNote | B, C | 0.5 | Yes | |
| WaveSense KeyNote Pro | B, C | 0.5 | Yes | |
| WaveSense Presto | B, C | 0.5 | No | |
| Arkray (customerservice@arkrayusa.com) | Glucocard 01 | C | 0.3 | No |
| Glucocard 01-mini | 0.3 | No | ||
| Glucocard Vital | C | 0.5 | No | |
| Bayer (www.simplewins.com) | Breeze2 | C | 1.0 | No |
| Contour | C | 0.6 | No | |
| Contour TSb | C | 0.6 | No | |
| Contour USB | C | 0.6 | No | |
| Bionime (www.bionimeusa.com) | Rightest GM100 | 1.4 | No | |
| Rightest GM300b | C | 1.4 | Yes | |
| Rightest GM550 | B, C | 1.0 | No | |
| Biosense Medical Devices (www.solometers.com) | Solo V2 | A, C | 0.7 | No |
| Diabetic Supply of Suncoast (www.dsosi.com) | Advocate Redi-Code Dash | 0.7 | No | |
| Advocate Redi-Code Duo | A, BP, C | 0.7 | No | |
| Diagnostic Devices (www.prodigymeter.com) | Prodigy Autocode | A, C | 0.7 | No |
| Prodigy Pocket | C | 0.7 | No | |
| Prodigy Voice | A, C | 0.7 | No | |
| Entra Health Systems (www.myglucohealth.net) | MyGlucoHealth Wireless | A, C | 0.3 | No |
| Fifty50 Medical (www.fifty50.com) | Fifty50 Blood Glucose Monitoring System 2.0 | C | 0.5 | No |
| Fora Care (www.foracare.com/usa) | Fora D10 | A, BP, C | 0.7 | Yes |
| Fora D15 | BP, C | 0.7 | Yes | |
| Fora D20 | A, BP, C | 0.7 | Yes | |
| Fora G20 | C | 0.5 | No | |
| Fora G71a | 0.5 | No | ||
| Fora G90 | B, C, K | 0.7 | No | |
| Fora Premium V10 | A, C | 0.5 | No | |
| Fora V20 | A, C | 0.7 | No | |
| Gluco Com (www.glucocom.com) | Codefree | C | 0.7 | No |
| Infopia www.infopiausa.com | Eclipse | C | 1.0 | Yes |
| Element | C | 0.3 | No | |
| Element Plus | A C | 0.3 | No | |
| Envision | C | 1.5 | No | |
| Evolution | C | 0.3 | No | |
| GlucoLab | C | 1.0 | Yes | |
| Xpres | 0.3 | No | ||
| LifeScan (www.onetouch.com) | OneTouch Pinga | B, C, P | 1.0 | Yes |
| OneTouch Selectb | C | 1.4 | Yes | |
| OneTouch Ultra2 | B, C | 1.0 | Yes | |
| OneTouch UltraMini | C | 1.0 | Yes | |
| OneTouch UltraSmart | B, C | 1.0 | Yes | |
| Nipro Diagnostics (www.niprodiagnostics.com) | Sidekick | 1.0 | No | |
| True2Go | 0.5 | No | ||
| Trubalanceb | C | 1.0 | No | |
| Trueresult | C | 0.5 | No | |
| Truetrack | C | 1.0 | Yes | |
| Nova Biomedical (www.novacares.com) | Nova Max Link | C, P | 0.3 | No |
| Nova Max Plus | C, K | 0.3 for blood glucose; 0.8 for ketones | No | |
| Oak Tree International Holdings (www.oaktreeint.com) | EasyMax Light | B, C | 0.6 | No |
| EasyMax No Code | C | 0.6 | No | |
| EasyMax Voice | C | 0.6 | No | |
| EasyMax Voice 2nd Generation | C | 0.6 | No | |
| EasyPlus T2 | C | 0.6 | No | |
| Omnis Health (www.omnishealth.com) | Embrace | A | 0.6 | No |
| Roche www.accu-chek.com/us | Accu-Chek Aviva | C | 0.6 | Yes |
| Accu-Chek Compact Plus | C | 1.5 | No | |
| U.S. Diagnostics (www.usdiagnostics.net) | Acura | 0.5 | No | |
| Control | C | 1.0 | Yes | |
| EasyGluco | 1.5 | Yes | ||
| EasyGluco Plus | B | 0.5 | No | |
| Infinity | C | 0.5 | No | |
| Maxima | 0.5 | Yes | ||
| Walmart (www.relion.com) | ReliOn Confirm | C | 0.3 | No |
| ReliOn Micro | 0.3 | No | ||
| ReliOn Ultima | B, C | 0.6 | Yes | |
A = audio capability; B = backlight on display; BP = dual meter that measures both blood glucose and blood pressure; C = computer download capability; K = also tests blood ketones; P = communicates with insulin pump.
aAvailable by mail order only.
bAdapted from the American Diabetes Association Resource Guide 2002. Blood glucose monitors and data management. Diabetes Forecast. 2012;36-51.
While new SMBG meters report as plasma values, older meters may report whole blood values, which are approximately 10% to 15% lower than plasma values. The ADA recommends whole blood fasting readings of 80–120 mg/dL and bedtime readings between 100–140 mg/dL. Plasma fasting readings should be between 90–130 mg/dL and bedtime readings between 110–140 mg/dL.43
Special features of glucose meters. Blood glucose testing can be challenging for adults with poor vision or limited dexterity as well as children with small hands. Patients should try out several meters by checking their ease of use with the lancing device and lancets, test strips, and packaging, and meter features before committing to one. Meters with a backlight or test strip port light should be recommended for individuals with visual impairment. Many meters also offer an audio function that is available in several different languages. Persons with limited dexterity, such as patients with arthritis, neuropathy, Parkinson disease, etc., may consider either the Breeze 2, which has a disk that holds 10 strips, or the Accu Check Compact Plus meter, which holds a drum of test strips. The test strip for these meters is easily dispensed with a push of a button. Individuals with visual impairment may benefit from larger display screen, screen back light, or test strip port light. Examples of meters that offer a screen back light include the Freestyle Lite, OneTouch Ultra 2, ReliOn Ultima, and WaveSense KeyNote. The Contour USB and Freestyle Lite meters also have a test strip port light.
Some children are more comfortable monitoring their blood glucose than others. Some children may like glucometers that come in bright or “cool” colors. The Arkray’s Glucocard 01-mini and Diabetic Supply of Suncoast’s Advocate Redi-Code Dash come in fun colors and patterns that may be appealing to younger patients. Many “auto-code” or “no-code” meters, which do not require manually programming the meter to recognize a specific group of test strips, are ideal choices for children who are learning how to monitor their blood glucose levels. Parents should select a meter that requires a very small blood sample size. Children or adolescents who enjoy video games might enjoy the Didget meter, which plugs into a handheld Nintendo DS system.
Most meters hold from 100 to 450 test results, though a few save well over 1000. This makes it easier to track blood glucose control over time. Many meters on the market have computer download capability through a USB connection. These meters come with their own software that can be downloaded directly to a desktop on both Mac and PC computers. Meter results can also be exported to an Excel file.44
An additional method to assess glucose control is called continuous glucose monitoring (CGM), which provides readings every few minutes throughout the day. This method allows patients and providers an opportunity to observe trends in glucose levels throughout the day and make the appropriate adjustments to medication, meal, or exercise regimens. A small sterile disposable glucose-sensing device called a sensor is inserted into the subcutaneous tissue. This sensor measures the change in glucose levels in interstitial fluid and sends the information to a monitor that can store 3–7 days worth of data. The monitor must be calibrated daily by entering at least three blood glucose readings obtained at different times using a standard blood glucose meter. The monitors have an alert system to warn patients if their blood glucose level is dangerously low or high (Table 13-6).45
Generally, blood glucose concentrations determined by these methods are clinically useful estimates of corresponding plasma glucose concentrations measured by the laboratory. Therefore, home blood glucose monitoring is preferred to urine testing. Home blood testing clarifies the relationship between symptomatology and blood glucose concentrations. The best meter for a patient is an individual decision. Patients should be encouraged to try different brands of meters to find the device with which they are most comfortable.42,43
Quality control, which consists of control solution testing, calibration, and system maintenance, is a necessary component of accurate glucose testing. Most manufacturers supply control solutions with SMBG meters that can be used to assess the accuracy of the test strip. This method of verifying accuracy operates the same way that the patient analyzes a drop of blood. A few meters require manual calibration prior to use, but most have an automatic calibration mode for ease of use. In photometric meters, the blood sample intended for the strip may come in contact with the meter and soil the optic window resulting in inaccurate results. Pharmacists should guide patients through the instructions for cleaning the meter that are usually provided by the manufacturer.
Factors affecting glucose readings. Environmental factors such as temperature, humidity, altitude, and light may influence the accuracy of glucose readings. Exposing glucometers to extremes of temperature can alter battery life and performance. Therefore, glucometers should be stored at room temperature to ensure accuracy (most will function at temperatures between 50°F and 104°F). The ReliOn Precision Xtra will function at higher temperatures (122oF maximum) while the Sidekick glucose meter is ideal for lower temperatures (34oF minimum).40,51 Temperature changes and humidity may decrease the shelf life of test strips resulting in inaccurate test results. Test strips should not be stored in areas of high humidity, such as a bathroom, or in areas with notable temperature changes, such as the car. Individuals should check the expiration date of the test strips. Because test strips are costly, patients are often tempted to use expired strips that result in inaccurate readings.51 Most test strips expire within 90–180 days after being opened.
At higher altitudes, changes in oxygen content and temperature alter glucose testing results. Results of studies evaluating the accuracy of glucometers at altitudes greater than 10,000 feet have revealed major alterations in blood glucose levels. These changes were attributed to variations in metabolic rate, hydration, diet, physical exercise, hematocrit, and temperature associated with higher altitudes. Patients should be educated on how to use glucometers at high altitudes. Changes in light exposure can also alter results with photometric glucometers.43 Additional variables such as hypotension, hypoxia, high triglyceride concentrations, and various drugs can alter readings; each patient should be evaluated for the presence of such variables and medication-related effects.
User error is the most common reason for inaccurate results. Some of the most common errors include not putting enough blood on the reagent. Patients should be asked periodically to demonstrate how they operate the meter.43
Frequency of glucose monitoring. Glucose monitoring requirements may vary based on the pharmacologic therapy administered. Patients who are well-controlled on oral medications should monitor blood glucose levels at least daily and more frequently if there are any changes in drugs or drug doses. Patients who are poorly controlled on oral medications should monitor blood glucose levels 2–4 times daily. Patients taking insulin injections twice a day should check blood glucose levels at least twice a day. Patients on intensive insulin therapy should monitor blood glucose levels 3–4 times a day. Patients on insulin pumps need monitoring 4–6 times a day to determine the effectiveness of the basal and bolus doses. In general, premeal glucose measurements are needed to monitor the effectiveness of the basal insulin dose (e.g., glargine or detemir) dose. Two-hour PPG readings are needed to monitor rapid-acting insulins (e.g., lispro, glulisine, and aspart). Oral blood glucose lowering agents, such as metformin, thiazolidinediones, sitagliptin, and glipizide, are evaluated using the 2-hour postprandial readings. Pregnancy requires frequent monitoring of blood glucose levels 4–6 times a day to ensure tight control, and premeal testing is required during acute illness to determine the need for supplemental insulin.53-60
Diagnosis of Hyperglycemia
The diagnosis of patients with hyperglycemia commonly falls into one of three categories: (1) DM or prediabetes, (2) DKA, and (3) hyperosmolar hyperglycemia state (HHS).
Diabetes Mellitus or Prediabetes
Goals of therapy. Once DM is diagnosed, the clinician needs to establish a therapeutic goal with respect to glucose control. The ideal goal would be to maintain concentrations at normal physiological levels. For type 1 patients, this effort requires tight control. Tight control could include preprandial plasma glucose concentrations of 90–130 mg/dL (5.0–7.2 mmol/L) and postprandial concentrations of less than 180 mg/dL (less than 10 mmol/L). Tight control requires intensive therapy and monitoring (i.e., three or more insulin injections per day and self-monitoring of glucose concentrations).5
Data from the Diabetes Control and Complications Trial (DCCT) suggest that this approach leads to significant health benefits.61 Overall, the study showed that in patients with type 1 DM, intensive therapy delays the onset and slows progression of microvascular complications (e.g., diabetic retinopathy, nephropathy, and neuropathy), and macrovascular diseases (e.g., large vessel, peripheral vascular diseases, stroke, and ischemic heart disease).
The United Kingdom Prospective Diabetes Study (UKPDS 33) compared the effects of intensive drug therapy with a sulfonylurea (e.g., chlorpropamide and glipizide) insulin and conventional therapy (diet) in 3867 patients with newly diagnosed type 2 DM from 1977 until 1991.62 The results of the UKPDS show that intensive drug therapy decreased the risk of microvascular complications when compared with conventional therapy. The investigators reported that patients in the intensive group with a 1% median reduction in A1c had a 25% reduction in risk of microvascular complications (p=0.0099).
Basal secretion of insulin from the pancreas occurs at a rate of 0.5–1 unit/hr. Bolus secretion of insulin occurs when blood sugar levels are above 100 mg/dL after ingestion of food. Therefore, the normal physiologic release pattern of insulin is one of valleys or basal secretion and peaks or bolus secretions (Figure 13-3a). The normal pancreas secretes 25–50 units of insulin daily.63-64
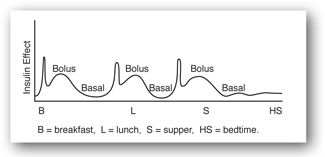
FIGURE 13-3A. Normal physiologic release pattern of insulin in adult. Adapted with permission from reference 64.
Because the most common and effective means to manage insulin deficiency is with insulin, the importance of the relationship between insulin injection and interpretation of glucose concentrations is briefly discussed. In general, 1 unit of any type of insulin produces the same metabolic response. Every 1–2 unit increase in the insulin dose usually leads to a 30–50 mg/dL decrease in the glucose concentration. Although the amount of total activity is equal for any given number of units of any insulin, the activity is not elicited evenly over time. A clinician must know the activity-over-time profiles of various insulin types at various injection sites to anticipate correctly a dose’s effect on glucose concentrations at a particular time (Table 13-7).63
The starting dose of insulin is based on clinical assessment of insulin deficiency and insulin resistance, as well as the patient’s lifestyle (i.e., eating patterns, exercise, and waking/sleep patterns). In general, insulin requirements for patients with type 1 DM with a BMI less than 25 kg/m2 are 0.5–1.0 unit/kg/day. Insulin requirements may vary during illness or stress. Insulin requirements may decrease during the “honeymoon phase,” a remission period that occurs early in the course of the disease.28 Insulin requirements for patients with type 2 DM vary based on the degree of insulin resistance and insulin deficiency. In general, a single or bedtime dose of insulin can be given to patients with type 2 DM who do not achieve glycemic control with noninsulin agents. The noninsulin agents should be continued at the same dose in most cases. Patients with a BMI less than 25 kg/m2 can be started on 5–10 units of intermediate or long-acting insulin at bedtime. Patients with a BMI greater than 25 kg/m2 should be started on 10–15 units of intermediate (NPH) or long-acting (glargine, detemir) insulin at bedtime or combination insulin (70/30) before dinner.64
Figures 13-3b and 13-3c illustrate the use of short-acting (regular) or rapid-acting (lispro, glulisine, or aspart) insulin before breakfast, lunch, and dinner and a long-acting basal insulin (detemir or glargine) given at bedtime. This regimen, often referred to as “the poor man’s pump,” is ideal for patients with unusual schedules. Figures 13-3d and 13-3e illustrate insulin therapy administered by an insulin pump. The pump is programmed to administer insulin (rapid- or short-acting) throughout the day, and the patient activates the pump to give a bolus of insulin prior to meals. Intensive regimens require more frequent monitoring and are accompanied by an increased risk of hypoglycemia.
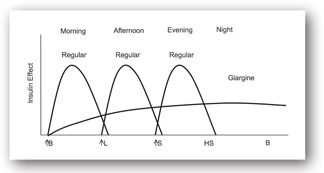
FIGURE 13-3B. Effect of short-acting insulin before meals and long-acting insulin at bedtime. Adapted with permission from reference 64.
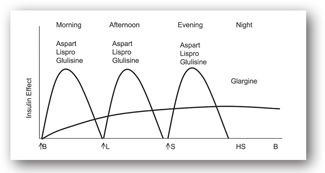
FIGURE 13-3C. Effect of rapid-acting insulin before meals and a long-acting insulin at bedtime. Adapted with permission from reference 64.
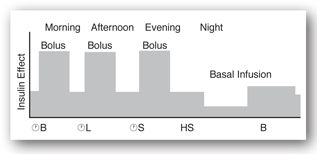
FIGURE 13-3D. Effect of short-acting insulin boluses at meals and basal insulin pump. Adapted with permission from reference 64.
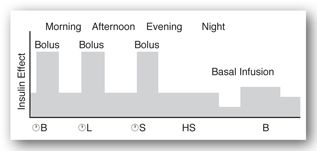
FIGURE 13-3E. Effect of rapid-acting insulin boluses at meals and basal insulin pump. Adapted with permission from reference 64.
In a single daily injection regimen (Figure 13-3f), one injection of intermediate or long-acting insulin is administered at bedtime. This regimen is ideal for a patient with type 2 DM who has failed to obtain glycemic control on oral agents. The oral agents can be continued and long-acting insulin can be administered at bedtime.
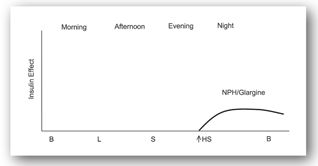
FIGURE 13-3F. Effect of a single bedtime dose of long-acting insulin. Adapted with permission from reference 64.
In a twice-a-day injection regimen (Figure 13-3g), an injection of intermediate-acting insulin is administered before breakfast and at bedtime. The administration of intermediate-acting insulin before bedtime decreases the risk of hypoglycemia in the early morning.
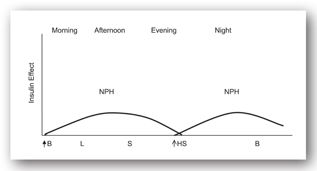
FIGURE 13-3G. Effect of intermediate-acting insulin before breakfast and at bedtime. Adapted with permission from reference 64.
An average regimen (Figure 13-3h) combines a mixed injection of intermediate-acting and regular insulin given before breakfast, an injection of regular insulin at dinner, and another injection of intermediate-acting insulin given before bedtime, which provides safer, more effective overnight glucose control. Without regular insulin administered before dinner, however, glucose concentrations may become unacceptably high after dinner.
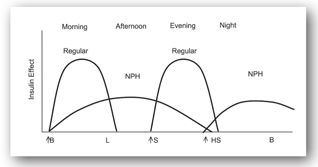
FIGURE 13-3H. Effect of three doses of insulin: short-acting, intermediate-acting, and mixed. Adapted with permission from reference 64.
Regular insulin should be given 30–45 minutes before meals unless the preprandial glucose concentration is below 70 mg/dL (<3.9 mmol/L). If the concentration is less than 70 mg/dL, the patient should consume 15 g of carbohydrates (e.g., 4 ounces of orange juice, regular soda, or skim milk) immediately, and check glucose levels 15 minutes later. In all regimens, regular insulin doses are adjusted on the basis of self-monitored preprandial glucose concentrations. Lispro, glulisine, and aspart insulin should be given 5–15 minutes before a meal. Insulin should be used along with diet, exercise, and stress management for best effects.62-64
Oral agents in the management of type 2 DM. Currently, there are several classes of oral agents available for the management of diabetes. All lower blood glucose concentrations in responsive patients (Table 13-8).
A1c = glycosylated hemoglobin; ALT = alanine aminotransferase; AST = aspartate aminotransferase; ATP-K = adenosine triphosphate–potassium; BID = twice a day; CNS = central nervous system; CrCl = creatinine clearance; DPP-4 = dipeptidyl peptidase-4; eGFR = estimated glomerular filtration rate; FPG= fasting plasma glucose; GI = gastrointestinal; GLP-1 = glucagon-like peptide-1; HDL = high density lipoprotein; LDL = low density lipoprotein; MTC = medullary thyroid carcinoma; NYHA = New York Heart Association; PO = oral; PPAR = peroxisome proliferator-activated receptor; PPG = postprandial glucose; SCr = serum creatinine; TID = three times a day; ULN = upper limit of normal.
The sodium glucose cotransporter inhibitors (SGLT-2 inhibitors), which inhibit the SGLT in the renal tubules represent a novel class of drugs currently under development. Inhibition of SGLT-2 promotes renal glucose excretion resulting in improved glycemic control. Dapagliflozin is the first of the new class of agents that recently underwent review by the FDA. In addition to its glucose lowering effect, dapagliflozin appears to have favorable impacts on weight and blood pressure (BP), and has a low risk of causing hypoglycemia. However, as with all new treatments, long-term safety is unknown. Clinical trials have shown that dapagliflozin may cause urinary tract infection, headache, diarrhea, nasopharyngitis, and back pain.16 The FDA recently requested more data on dapagliflozin’s safety due to concerns regarding a possible increased incidence of breast and bladder cancer in patients on dapagliflozin. Nine cases of bladder cancer occurred in male patients who took dapagliflozin in clinical trials, compared with one case among patients treated with a placebo. Breast cancer occurred in nine patients who took the new drug, and in one patient in the control group. Further clinical investigation will confirm or refute whether these concerns are valid.16,17
Diabetic Ketoacidosis
Insulin deficiency after ingestion of a meal can result in impaired glucose utilization by peripheral tissues and the liver. Prolonged insulin deficiency results in protein breakdown and increased hepatic glucose production (gluconeogenesis) by the liver and increased release of counter regulatory hormones such as glucagon, catecholamines (e.g., epinephrine and norepinephrine), cortisol, and growth hormones. In the face of lipolysis, free fatty acids are converted by the liver to ketone bodies (beta-hydroxybutyric acid and acetoacetic acid), which results in metabolic acidosis. Diabetic ketoacidosis, which occurs most commonly in patients with type 1 DM, is initiated by insulin deficiency. (See Minicase 1.) The most common causes of DKA are70
Diabetic Ketoacidosis
VERA K. IS A 29-YEAR-OLD FEMALE with a 20-year history of type 1 DM. She presents to the ED with a pH of 7.15, HCO3 of 9, and blood glucose greater than 600 mg/dL. Vera K.’s husband brought her into the ED after finding her “out of it” when attempting to wake her. Two days ago, she developed fever, chills, and polyuria. She has not been monitoring her blood glucose levels regularly.
Vera K. recently switched to a new insulin pump but did not receive any formal training on how to use the pump. The ED physician noticed that the pump was disconnected. Physical examination revealed a lethargic female with a BP of 116/68 (which dropped to 95/50 when standing), HR 105, respiratory rate 30 (deep and regular), and oral temperature 101.4°F (38.6°C). Her skin turgor was poor, and her mucous membranes were dry. Vera K. had a fruity aromatic odor to her breath and was disoriented and confused. Her lab results were as follows:
- Sodium, 143 mEq/L (136–142 mEq/L)
- Potassium, 5.4 mEq/L (3.8–5.0 mEq/L)
- Chloride, 99 mEq/L (95–103 mEq/L)
- BUN, 38 mg/dL (8–23 mg/dL)
- SCr, 2.8 mg/dL (0.6–1.2 mg/dL)
- Phosphorus, 2.7 mg/dL (2.3–4.7 mg/dL)
- Amylase, 350 International Units/L (30–220 International Units/L)
- pH, 7.15 (7.38–7.44)
- Bicarbonate, 9.0 mEq/L (21–280 mEq/L)
- Hct, 52% (36% to 45%)
- WBCs, 16 × 103 cells/mm3 (4.8–10.8 × 10³ cells/mm3)
- Calcium, 9 mg/dL (9.2–11.0 mg/dL)
- Glucose, 650 mg/dL (70–110 mg/dL)
- Ketones, 3+ @1:8 serum dilution (normal = 0)
- Osmolality, 335 mOsm/kg (280–295 mOsm/kg)
- Triglycerides, 174 mg/dL (10–190 mg/dL)
- Lipase, 1.4 units/mL (<1.5 units/mL)
- Magnesium, 2 mEq/L (1.3–2.1 mEq/L)
A urine screen with Multistix indicated a “large” (160 mg/dL) amount of ketones (the highest designation on the strip).
Question: Based on clinical and lab findings, what is the most likely diagnosis for Vera K.? What precipitated this metabolic disorder? Can interpretation of any results be influenced by her acidosis or hyperglycemia? Are there potential drug interferences with any lab tests?
Discussion: Vera K., a type 1 DM patient, developed DKA from an infection and interruption in insulin delivery. Insulin pump therapy uses only rapid- or short-acting insulin. Therefore, any interruption in insulin delivery (due to infusion set clogs, leaks, loss of insulin potency, or pump malfunction) may result in hyperglycemia (high blood glucose) within 2–4 hours and, subsequently, the rapid onset of DKA within 4–10 hours. The onset of stress or illness (caused by infection or an emotional event) can also result in a rise of blood glucose levels and the development of DKA, which rarely occurs in patients with type 2 DM. Clinically, Vera K.’s presentation is classic. Her decreased skin turgor, dry mucous membranes, tachycardia (HR of 105), and orthostatic hypotension are consistent with dehydration, a common condition in patients with DKA. Her breathing is rapid and deep. Although she is not comatose, she is lethargic, confused, and disoriented.
Chemically, Vera K. probably has a total body deficit of sodium and potassium despite serum concentration results within normal limits. Orthostatic hypotension is consistent with decreased intravascular volume, causing hemoconcentration of these electrolytes. Therefore, these values do not reflect total body stores, and the clinician can expect them to decline rapidly if unsupplemented fluids are infused. Although Vera K.’s phosphorus concentration is in the normal range (lower end), it likely will decrease after rehydration and insulin. Serial testing should be done every 3–4 hours during the first 24 hours.
Serial glucose, ketones, and acid–base measurements, typical of DKA, should show gradual improvement with proper therapy. With use of the sodium correction factor (addition of 2 mEq/L to the sodium result for every 100 mg/dL of glucose above 200 mg/dL), Vera K.’s sodium would have been 152 mEq/L had her glucose been normal, a value more consistent with the BUN and Hct concentrations. Potassium balance is altered in patients with DKA because of combined urinary and GI losses. While total potassium is depleted, the serum potassium concentration may be high, normal, or low, depending on the degree of acidosis. Vera K.’s metabolic acidosis has resulted in an extracellular shifting of potassium, causing an elevated serum potassium concentration. Potassium supplementation may be withheld for the first hour or until serum levels begin to drop. Low serum potassium in the face of pronounced acidosis suggests severe potassium depletion requiring early, aggressive therapy to prevent life-threatening hypokalemia during treatment.
Decreased intravascular volume has led to a hemoconcentrated hematocrit and BUN, which is also elevated by decreased renal perfusion (prerenal azotemia), although intrinsic renal causes should be considered if SCr is also elevated. Fortunately, as is probably the case with Vera K., high SCr may be an artifact caused by the influence of ketone bodies on the assay. If so, SCr concentrations should decline with ketone concentrations.
Vera K. also exhibits the typical leukocytosis that often accompanies DKA in the absence of infection. Her estimated plasma osmolarity based on the osmolarity estimation formula would be (2 × 143) + (650/18) + (38/2.8) = 335.7 mOsm/L, is approximately equal to the actual measured laboratory result. This value is slightly higher than usual for DKA (300–320 mOsm/kg).
The serum ketone results still would have to be interpreted as real and significant, given all of the other signs and symptoms. A urine screen also indicated the presence of ketones.
A serum amylase and lipase were measured to rule out pancreatitis, usually suspected with abdominal pain. However, elevated amylase probably originated from the salivary glands because Vera K.’s lipase was normal. An elevated amylase is observed in 20% of patients with DKA. Assessment of Vera K.’s willingness to check her blood glucose levels 4–6 times a day should be assessed before she is discharged. The frequency and timing of SMBG vary based on several factors, including an individual’s glycemic goals, the current level of glucose control, and the treatment regimen. The ADA recommends SMBG (4–6 times per day) for patients receiving insulin pump therapy. Pump therapy is not recommended for patients who are unwilling or unable to perform a minimum of four blood glucose tests per day and to maintain contact with their healthcare professional. If Vera K. agrees to the terms of the self-management to receive insulin pump therapy, she should be advised to always carry an “emergency kit” of supplies (including insulin, syringes or pens, blood glucose test strips, and meter and urine ketone test strips), in case she develops a problem with her pump and her insulin delivery is stopped, putting her at risk for hyperglycemia.
Stay updated, free articles. Join our Telegram channel

Full access? Get Clinical Tree


