v. 971 (LSTC, Livermore, CA, USA).
The methods will be divided in two main sections:
the first section will concern the realization of the AR models and the analysis of their dynamic behaviour;
the second section will concern the implantation simulation and the dynamic function of the TAV within the AR models.
2.1 Aortic Root Models Definition and Dynamics
In order to investigate the influence of AV calcifications, three different AR models were considered:
Model H was taken from a previously published work by Sturla and colleagues [16]: it consists of a paradigmatic physiological AR model based on MRI in vivo data of 8 healthy subjects. The model is shown in Fig. 1a and includes: the AR wall, characterized by the left ventricle outflow tract (LVOT), the sinuses of Valsalva and the first tract of the ascending aorta (AA), and the trileaflet AV. The latter was discretized with 4-node Belytschko–Tsay shell elements [17] with 3 integration points along the out-of-shell direction in order to account for shell bending, while the AR wall was discretized with reduced-integration hexahedral elements in order to limit computational costs.
a healthy model (model H);
a first pathological model (model P1) obtained by introducing a typically observed distribution of calcifications on model H;
a second pathological model (model P2) obtained by extending the calcifications of model P1 on the commissural zones of the AV leaflets.
As concerns material properties, a linear elastic model was assigned to the AR wall with a young modulus of 2 MPa, a Poisson coefficient of 0.45 and a density of 1,100 kg/m [18], while the AV leaflets were modeled with a nearly incompressible transversely isotropic hyperelastic material. Such a model is based on the strain energy function proposed by Weiss and colleagues [17] and was chosen in order to account for the anisotropic mechanical response of the AV leaflets which is stiffer in the direction of the collagen fibers (i.e. the circumferential direction) as shown in the work done by Billiar and Sacks [19].
[18], while the AV leaflets were modeled with a nearly incompressible transversely isotropic hyperelastic material. Such a model is based on the strain energy function proposed by Weiss and colleagues [17] and was chosen in order to account for the anisotropic mechanical response of the AV leaflets which is stiffer in the direction of the collagen fibers (i.e. the circumferential direction) as shown in the work done by Billiar and Sacks [19].Model P1 and P2 differ from model H only for the modeling of the AV leaflets.
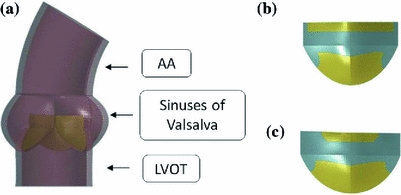
Fig. 1
a Representation of the healthy AR model (model H) [16], b distribution of the calcific elements on model P1 and c model P2 (calcifications are shown in cyan)
In order to model AV calcifications, in model P1 a layer of stiffer shell elements (representing the calcifications) has been superimposed onto the healthy AV shell elements: the distribution of the calcific elements was chosen in order to resemble typically observed calcifications on excised stenotic AVs [20]. Model P2 was then obtained by extending the distribution of the calcific elements in the commissural zones of the leaflet. In Fig. 1b, c the distribution of the calcific elements on one of the AV leaflet is shown for model P1 and P2.
As regards the mechanical behaviour of the calcific elements, an isotropic hyperelastic constitutive model based on the Ogden strain energy function [17] has been chosen, by fitting the mechanical response of calcific atherosclerotic tissue published by Loree and colleagues [21].
In order to evaluate the dynamic behaviour of these models and compare the pathological models to model H, structural dynamic simulations of the cardiac cycle were performed, as described by Sturla [16]. Briefly, standard physiological time-dependent aortic and ventricular pressures were applied to the inner surface of the AR wall, after applying a preload of 85 mmHg: the aortic pressure was applied to the structures downstream the AV, while the ventricular pressure was imposed on the LVOT inner surface. On the AV leaflet surface the difference between the ventricular and aortic pressure was applied.
2.2 TAV Simulations
In what follows TAV models and simulations will be described in details.
TAV Model. The balloon-expandable Edwards Sapien size 26 mm (Edwards Lifesciences Corporations, Irvine, CA, USA) was considered. This device is made of a stainless steel (AISI 316 LVM) stent, a bovine pericardium valve and a fabric skirt. The TAV stent model, previously described in the work of Tzamtzis and colleagues [22], was discretized with 169,000 reduced integration tetrahedral elements using the software Gambit
 (Ansys Inc., Canonsburg, PA, USA). A finer mesh was realized in the regions of the stent that experience higher level of mechanical stresses during the crimping and deployment phases (e.g. at the joints of the beams). A bilinear elasto-plastic model based on the Von Mises yielding criterion was used to define the stent mechanical properties: the model parameters were obtained from experimental mechanical characterization (
 GPa,
GPa,  ,
,  MPa, E
 MPa) [22].
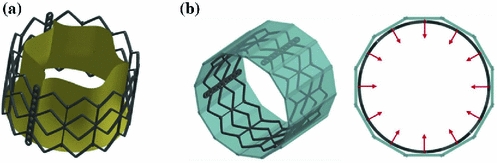
size 26 mm (Edwards Lifesciences Corporations, Irvine, CA, USA) was considered. This device is made of a stainless steel (AISI 316 LVM) stent, a bovine pericardium valve and a fabric skirt. The TAV stent model, previously described in the work of Tzamtzis and colleagues [22], was discretized with 169,000 reduced integration tetrahedral elements using the software Gambit (Ansys Inc., Canonsburg, PA, USA). A finer mesh was realized in the regions of the stent that experience higher level of mechanical stresses during the crimping and deployment phases (e.g. at the joints of the beams). A bilinear elasto-plastic model based on the Von Mises yielding criterion was used to define the stent mechanical properties: the model parameters were obtained from experimental mechanical characterization ( GPa, , MPa, E MPa) [22].The leaflet model was discretized with 10,800 linear 3-node shell elements [17]. An isotropic hyperelastic Ogden constitutive model was chosen and the strain energy function parameters were obtained by fitting uniaxial tensile tests performed on bovine pericardium specimens at  . In Fig. 2a the CAD model of the entire TAV device is shown.
. In Fig. 2a the CAD model of the entire TAV device is shown.TAV Simulations. The implantation and function of the TAV model was simulated through a multi-step procedure, summarized as follows:
Crimping simulation. The crimping simulation was implemented by applying a radial translation to 12 rigid planes placed around the TAV stent (Fig. 2b) and compressing it to a final external radius of 4.7 mm, replicating the real procedure. A frictionless penalty-based contact was used to manage the interaction between the stent and the planes. At the end of the crimping phase a further step was performed, in which the rigid planes were removed and the stent recovered part of its elastic deformation (this phase is called recoil).
1.
Crimping simulation of the TAV stent
2.
Deployment simulation of the stent within the three AR models
3.
Positioning of the TAV leaflet model within the three post-implantation stent configurations
4.
TAV function simulation throughout the cardiac cycle
Fig. 2
a CAD model of the Edwards Sapien device b Isometric (left) and top (right) view of the crimping simulation model. In cyan the 12 rigid planes are shown and the radial directions of the motion imposed to them is indicated by red arrows
device b Isometric (left) and top (right) view of the crimping simulation model. In cyan the 12 rigid planes are shown and the radial directions of the motion imposed to them is indicated by red arrows Deployment simulations. The stent configuration obtained after the crimping and recoil simulation was imported together with its residual stress and strain fields in subsequent analyses, in which the stent was deployed within the three different AR models H, P1and P2 at their systolic peak configurations (Fig. 3). The deployment simulations were performed by applying a uniform pressure (that gradually increased from 0 to 600 kPa) on the inner surface of the stent. As for the crimping simulation, penalty-based contacts were used to manage the interaction between the stent and the native AV, the stent and the AR wall, as well as the AV and the AR wall. Concerning the contacts involving the stent and the biological structures, a formulation that computes the contact forces based on the nodal mass instead of the element stiffness was used, so to cope with the large difference in mechanical properties between soft tissues and steel. In order to limit inertial oscillations due to the choice of a fully-transient formulation, a damping contribution was set: the proper damping coefficient was computed from a non-damped simulation that allowed to obtain the critical frequency of the system.
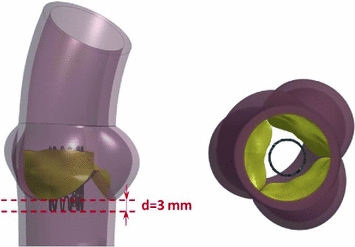
Fig. 3
Side (left) and bottom (right) view of the initial configuration of the deployment simulation. The distance set between the annulus and the base of the TAV stent is reported
TAV leaflet positioning simulations. The TAV leaflet model was then positioned in the post-implantation stent configurations through a step in which a non uniform displacement field was applied to the nodes lying on the outer boundaries of the leaflets (except the nodes belonging to the free edges).
TV dynamic simulations. Once the implanted leaflet configurations in model H, P1 and P2 were obtained, dynamic simulations of TAV throughout the cardiac cycle were performed, by applying a physiological trans-valvular pressure on the leaflet surface. In this phase, the nodes belonging to the outer boundaries of the leaflets were fully constrained, according to the approximation that the stent does not move during the cardiac cycle.
3 Results
3.1 Dynamics of the Aortic Root Models
The most interesting result obtained from the dynamic simulations of the AR models concerns the Aortic Orifice Area (AOA), whose systolic peak values were 2.3, 1.4 and 1.3 cm in models H, P1 and P2, respectively. In Fig. 4 the AOA at systolic peak are depicted.
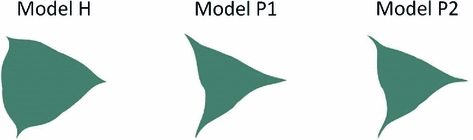
in models H, P1 and P2, respectively. In Fig. 4 the AOA at systolic peak are depicted.Fig. 4
Systolic peak orifice area of models H, P1 and P2
Models P1 and P2 showed a significant lowering in AOA values if compared to model H ( 39 % and
  43 % at systolic peak, respectively). Interestingly, the obtained values are comparable to those of stenotic AV measured by Doppler echocardiography [23], suggesting that the strategy adopted in the present work to model AV calcifications could represent a feasible approach when investigating the macroscopic dynamic behaviour of stenotic AVs.
39 % and 43 % at systolic peak, respectively). Interestingly, the obtained values are comparable to those of stenotic AV measured by Doppler echocardiography [23], suggesting that the strategy adopted in the present work to model AV calcifications could represent a feasible approach when investigating the macroscopic dynamic behaviour of stenotic AVs.As concerns the mechanical loadings acting on AV models during the cardiac cycle, pathological models experienced higher level of stresses particularly in the belly region, where the average first principal stress reached 500 kPa in models P1 and P2 and exceeded by 11 % the corresponding value computed in model H (450 kPa). Although somewhat trivial, this result could suggest interesting implications from a pathogenetic point of view: it is well known that the origin and progression of the degenerative aortic stenosis is strictly correlated to higher localized mechanical stresses on the AV leaflets that could lesion the endothelium and start the fibrotic process [24]; in the light of this result it can be speculated that the degenerative process of AV stenosis could be self-enhanced and that the rate of progression of the lesion could increase after the onset of the pathology.
3.2 TAV Simulations
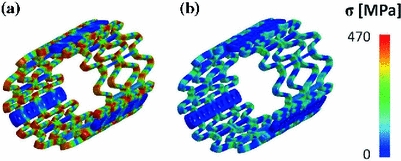
Concerning TAV simulations, in the stent crimping phase mechanical stresses were higher at the joints of the beams where plastic hinges formed (Fig. 5a). In those regions, average Von Mises stress and plastic deformation reached 425 MPa and 13.8 %, respectively. After the recoil phase, the stent recovered part of the elastic deformation, but because of the non-uniform plasticization, a residual auto-equilibrated stress field remained (Fig. 5b). As a result of the elastic recoil, the external radius of the stent increased from 4.7 to 4.9 mm when the rigid planes were removed, which corresponds to a percentage recoil of 4.3 %.