Chapter 4
Effects of Multimorbidity on Healthcare Resource Use
Efrat Shadmi1, Karen Kinder2, and Jonathan P. Weiner2
1Faculty of Social Welfare and Health Sciences, Haifa University, Israel
2Department of Health Policy and Management, Bloomberg School of Public Health, The Johns Hopkins University, USA
Overview
- People with multimorbidity consume a disproportionately large share of healthcare resources
- Greater resource consumption is the result of not only greater need because of the accumulation of chronic diseases but also interactions and synergies between conditions present within individuals
- Multimorbidity measures have been shown to explain large variations (across populations/individual clinicians/healthcare organizations) in use of a range of healthcare resources – including inpatient services, specialized care, primary care and medications
- Multimorbidity has important implications for resource allocation within health systems as well as for care management programmes targeted at improving care and increasing care efficiency for high-risk multimorbid patients.
Background
Context for understanding the impact of multimorbidity on healthcare resource use
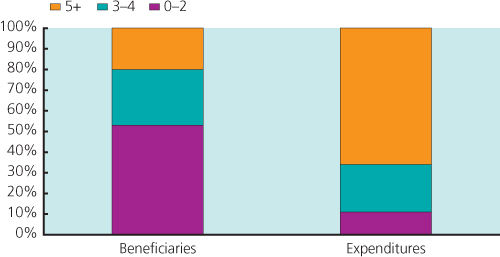
People with multimorbidity consume a disproportionate amount of healthcare resources. Regardless of the way multimorbidity is defined (i.e. based on chronic condition counts, indices or measures of all types of conditions), higher levels of multimorbidity have consistently been shown to be associated with the largest share of resource consumption in numerous populations and settings around the globe (Lehnert, Heider, Leicht, et al., 2011). The following examples, though based on data from individual countries, depict a picture representative of healthcare delivery worldwide. Figure 4.1 describes the characteristics and healthcare use for a cohort of older Americans (65+) in the government-sponsored Medicare programme. People with five or more chronic conditions constitute about a fifth of the Medicare population, yet consume two-thirds of all healthcare resources (Anderson, Horvath, 2002).

Figure 4.1 Distribution of US Medicare beneficiaries and expenditures by number of chronic conditions.
Source: Data from Anderson and Horvath 2002. Derived from Medicare claims and beneficiary survey.
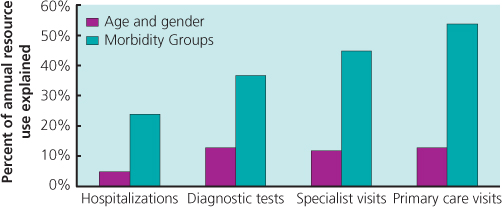
Figure 4.2 depicts the association between multimorbidity and primary care visits, specialist visits, performance of diagnostic tests and hospitalizations within Israel’s Clalit Health Services, which is an integrated delivery system. The analysis in this figure uses the Aggregate Diagnostic Groups (ADGs) of the of the Johns Hopkins Adjusted Clinical Groups® (ACG) system, discussed in Weiner (1991), which measures multimorbidity across all types of conditions (both acute and chronic) the patient may have. As shown in Figure 4.2, multimorbidity explains a much larger share of resource use for each of the four types of healthcare resources assessed compared with that of age and gender alone (Shadmi, Balicer, Kinder K, Abrams, Weiner, 2011) (See Box 4.1).

Figure 4.2 Explaining resource use with multimorbidity measures versus age and gender only. Morbidity groups: ADGs, Aggregate Diagnostic Groups (from the ACG system). Percentage represents the explained variance (R2) from regression analysis.
Source: Data from Shadmi et al. 2011.
Causal pathways
While the phenomenon of high resource consumption in people with multimorbidity is well described, how multimorbidity results
Box 4.1 How well can we predict which patients will make greatest use of healthcare resources?
How exactly does multimorbidity lead to increased resource use?
How can healthcare systems be designed to make the best and most efficient use of resources in the light of the growing prevalence of multimorbidity?
in excessive use of resources is less clear. Box 4.2 tells the story of how multimorbidity may result in high rates of resource use, using an example from the USA.
As depicted in Box 4.3, MM’s healthcare resource use is determined by the highly professionalized fragmented nature of the healthcare system in the USA, with multiple sub-specialty experts and lack of coordinating mechanisms that can definitively ensure
Box 4.2 Increased current and future resource use by levels of multimorbidity
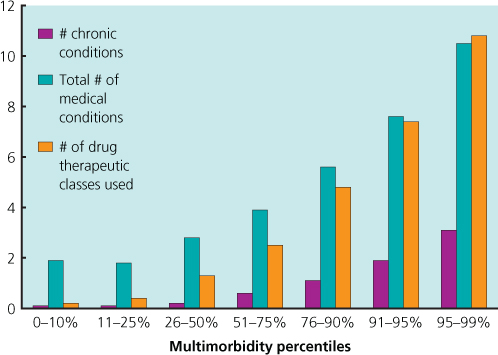
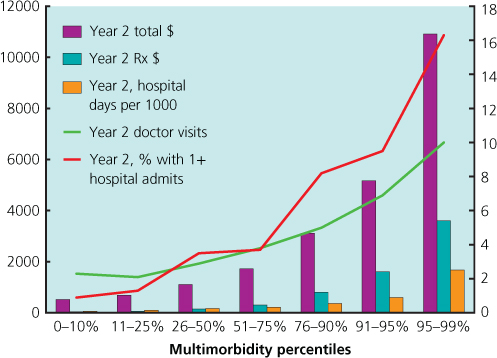
Using private insurance data for a two-year cohort of Americans under the age of 65, we describe (Figure 4.3) the group by multimorbidity percentile levels, as defined by the Johns Hopkins ACG multimorbidity index. This figure shows that the greater the multimorbidity, as measured by the index percentile levels (from 0 to 10% up to 95 to 99%), the greater the number of chronic conditions, total number of conditions and number of drug therapeutic classes used. We go on to assess the impact of this year’s multimorbidity levels on future (year 2) resource use (Figure 4.4), showing a similar pattern. This ‘predictive’ type of analysis is critical for both reimbursement/budgeting (which usually uses past information to budget for future periods) and care management intervention designed to target and intervene individuals with the highest level of multimorbidity.

Figure 4.3 A cohort of insured under-65 Americans arrayed by multi-morbidity index percentile levels: Characteristics of each MM percentile group in year 1.
Source: Johns Hopkins University. Unpublished data from a cohort of 904 007 persons below the age of 65 enrolled in private insurance plans for a two-year period. The multimorbidity index percentile ranking is based on the Johns Hopkins ACG predictive model, which calculates a morbidity burden risk score using morbidity markers derived from health insurance data for this cohort in ‘year 1’.

Figure 4.4 A cohort of insured under-65 Americans arrayed by multimorbidity index percentile levels: characteristics of each MM percentile group in year 2.
Source: Johns Hopkins University. Unpublished data from a cohort of 904 007 persons below the age of 65 enrolled in private insurance plans for a two-year period. The multimorbidity index percentile ranking is based on the Johns Hopkins ACG predictive model, which calculates a morbidity burden risk score using morbidity markers derived from health insurance data for this cohort in ‘year 1’.
Stay updated, free articles. Join our Telegram channel

Full access? Get Clinical Tree


