- why randomised controlled trials provide the best evidence of effectiveness of treatment;
- the possible sources of bias in a randomised controlled trial;
- the reasons for randomisation, blinding and the use of an intention to treat analysis;
- the ethical dimensions of trials: clinical equipoise, informed consent;
- how qualitative methods can help in the design of randomised controlled trials.
Clinical experience as a guide to the effect of treatments
Many doctors feel they know which treatments work best from clinical observation or experience. This may be reasonable in exceptional circumstances. For example, when sulphonamides were introduced for the treatment of meningococcal meningitis the effect was striking. Whereas before, mortality was very high, it was reduced to almost nil. Other examples of very effective treatments include anaesthesia for surgery and insulin for diabetes. However few treatments have such dramatic effects, and observational evidence from clinical experience alone can be misleading, for several reasons:
- Sick people tend to get better even without treatment. It is difficult to know what would have happened if no treatment, or a different treatment, had been given.
- Doctors do not follow up all of their patients after treatment, and so it is hard to be sure whether they got better or worse.
- Each doctor treats a limited number of patients so apparently dramatic benefits or failures of treatment could be due to chance. Most treatment effects are modest and you need very large studies to demonstrate this.
What we really want to know is what would happen to a patient if they received or did not receive a specific treatment. Ideally we would observe someone who was treated and then using a time machine replay their life without treatment to see if treatment made a difference (this is technically known as the counterfactual). However this is impossible (though see below for crossover studies) so instead we use an experimental approach known as a randomised controlled trial (RCT).
The essential steps of the RCT
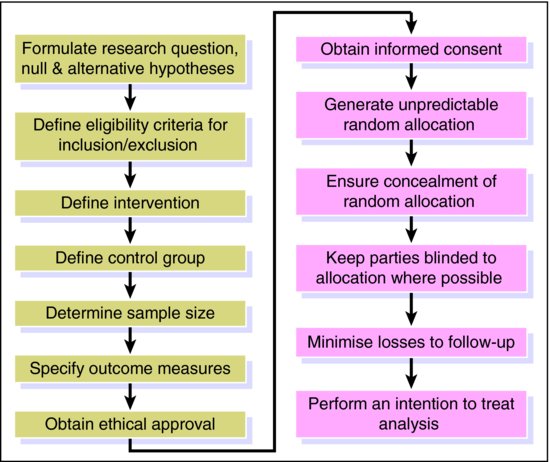
An RCT is the next best thing as subjects are randomly allocated either to (i) an active treatment (or new treatment) arm or (ii) a control arm (comparison group). The control treatment may be a placebo, or the current standard treatment. Random allocation means that every patient has the same probability of ending up in one or other group under comparison. This is critical as we want everything to be identical in the two arms except the intervention. Thus, any difference in outcome must reflect the causal effect of the intervention. Provided that enough patients are included in the study and that random allocation is truly random, groups will be comparable for both known and unknown confounders (Chapter 3). This is why the RCT is regarded as the best evidence of causality and the best single study design in the hierarchy of evidence (see Box 5.1 in Chapter 5). At the end of the twentieth century it was estimated that there were half a million published RCTs (Lau et al., 1998). Whilst the RCT has become widely accepted as the gold standard study design for the evaluation of the effectiveness of treatments in medicine and health care, poor quality trials continue to frequent the literature (Moher, 2004). Treatment effect may be over- or underestimated because of a number of different forms of bias that may be inherent in an RCT. The steps, outlined in Figure 11.1 and described below, are essential to the design and conduct of RCTs to ensure robust findings.
 Case study The effects of tamoxifen and raloxifene on the risk of invasive breast cancer – the STAR study (Vogel et al., )
Eligibility criteria for inclusion/exclusion
It is important in any RCT (and indeed, any observational study) to have clear inclusion and exclusion criteria so that the study sample is representative of the population of interest and this aids generalisability. If eligibility criteria are too restrictive, the generalisability of the study will also be restricted.
Reasons for exclusion are (i) risky to give them the new treatment (contraindications) (ii) unethical to deny them the conventional treatment or already on new treatment (iii) unable to follow the study requirements, e.g. mental illness, dementia or live far from study sites.
In the STAR RCT, women from 200 clinical centres throughout North America were recruited to the study between July 1999 and November 2004. To be eligible for participation, women had to be at least 35 years of age, be postmenopausal and have an increased 5-year predicted breast cancer risk (>1.66%). Exclusions included (i) those currently taking tamoxifen, raloxifene and other medications that could interact (ii) past medical history of certain disease e.g. deep vein thrombosis (DVT) and (iii) a psychiatric condition that would interfere with adherence.
Definition of intervention and control groups
A clear definition of both the intervention and control is essential so that people reading the results know exactly what was evaluated. There may be more than one control group, for example, comparing new treatment with conventional treatment and placebo.
In the STAR RCT, women received either 60 mg per day of raloxifene (intervention) or 20 mg per day of tamoxifen (control) for a maximum of 5 years. Interventions evaluated in RCTs are often far more complex than this, consisting of many different components. For example, individuals attending a stroke unit may have contact with numerous different health professionals and receive a series of drugs.
Sample size calculation
It is essential in the design of an RCT to determine how many subjects need to be included. In order to do a sample size calculation the investigators need to determine four things:
- the expected level of outcome in the control group;
- the smallest difference in outcome they wish to detect (clinically important) when comparing the two groups (in an equivalence RCT investigators will determine the largest difference in outcome that would still be considered clinically equivalent);
- the strength of evidence that they wish to find (the P-value). In sample size calculations this is often set at 5%, although arguably it should be smaller;
- the probability that they will detect a difference with the specified P-value, if the true difference is of the size they expect. This is called the power of the study and is often set at 80% or 90%.
Many RCTs do not demonstrate strong evidence against the null hypothesis because the sample size is too small (underpowered). When interpreting studies with weak evidence against the null hypothesis, you should always ask whether the sample size was large enough to detect an important difference as absence of evidence is not the same as evidence of absence (see Chapter 12 on meta-analysis).
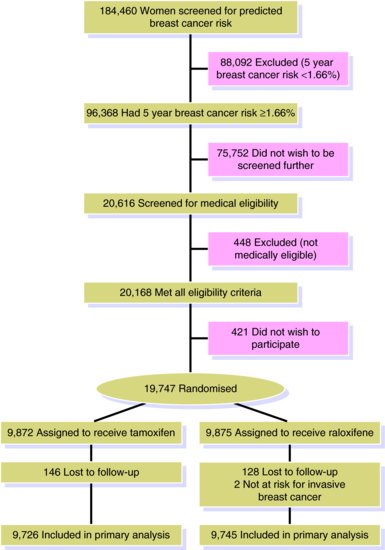
In the STAR RCT the investigators focussed on demonstrating equivalence between the two treatments. They required a 95% probability of correctly concluding that the two treatments were equivalent, if they really were so, with P = 0.05. A sample size calculation determined that 327 events were required (formulae for such calculations can be found elsewhere (Matthews, 2002)). With knowledge of overall rates of invasive breast cancer in the population, the investigators were able to calculate the number needed to participate in the study to obtain 327 or more events. Whilst this may not sound like a lot, they had to screen 184,460 women to identify 20,168 eligible women from whom 19,747 women were randomised (421 not wishing to participate).
Outcome measures
An RCT should always pre-specify its primary outcome measure (this is used for the sample size calculation) but it can have a number of secondary outcomes. The primary outcome measure is often chosen as the most important research question and of greatest clinical benefit. The interpretations of secondary outcomes are likely to be less conclusive due to chance findings or lack of power. All outcome measures should have an explicit definition and time-point stated in the RCT protocol. All pre-specified outcomes should be reported. There are different types of outcome that may be measured in any single RCT.
A composite outcome combines multiple endpoints. An RCT may combine coronary deaths with nonfatal coronary events and surgical interventions such as by-pass grafting. This is often done to increase the power of a trial but may complicate the interpretation of the results.
A surrogate outcome refers to a measure that whilst may not be of direct practical importance, is associated with an outcome that is important. For example, a trial of a treatment to prevent dementia may use MRI scans to look at differences in brain atrophy, a surrogate for Alzheimer’s disease. Using such a surrogate outcome will reduce the required length of follow-up, may reduce the cost due to fewer participants and potentially increase the power of the RCT. However they are harder to interpret as patients, clinicians and policymakers are not interested in differences in brain volumes but in dementia risk.
The primary outcome for the STAR RCT was invasive breast cancer identified through pathology and mammography reports. Secondary endpoints included adverse events such as endometrial cancer and quality of life.
Biases
A number of different forms of bias may impact on the findings of an RCT. As described in Chapter 3, bias can be classified as relating either to the selection of participants into (or out of) a study or to the measurement of exposure and/or outcome and can be differential or nondifferential.
Selection bias and allocation concealment
Selection bias occurs in an RCT when individuals allocated to the treatment and control groups differ in some characteristic associated with outcome. For example, a health-care professional who is recruiting participants to a trial of treatments for depression, may systematically allocate those that are more severely depressed to the treatment group and those that are less severe to the control group as they feel it is unethical to deprive patients of what may turn out to be an effective therapy. In this instance any treatment effect is likely to be underestimated, but in general selection bias can affect the estimate in either direction.
In an RCT selection bias can be avoided if proper randomisation is carried out (usually using a computer generated sequence) and the random allocation sequence is concealed or hidden from the investigators enrolling patients so that it is impossible for her/him to have any influence over what treatment is allocated.
Examples of adequate allocation concealment include sequentially numbered sealed, opaque envelopes, drug containers prepared by an independent pharmacy and numbered in advance or central randomisation at a site remote from the trial location. As the clinicians are unaware of what is the next treatment, they cannot manipulate the randomisation process. Investigators’ knowledge of treatment allocation can result in them either knowingly or unknowingly adjusting allocation based on prognostic factors which would mean that allocation is no longer random. The STAR RCT reports that randomisation was computer generated but there is insufficient detail to determine allocation concealment.
If randomisation has been successful, the two groups should be similar. The investigators can reassure themselves of this by brief baseline comparisons of factors such as age, sex and disease severity. If there are differences between groups, there are two possible explanations. The first is that random allocation was not truly random and that is was biased in some way, perhaps because of inadequate concealment. The other possibility is that only a few subjects were randomised and important differences between the treatment groups occurred by chance.
Measurement bias and blinding
As described in Chapter 3, both differential and nondifferential misclassification bias can lead to an inaccurate estimate in an analytical study. We are generally more concerned with differential misclassification because the impact of such bias is harder to predict. Two types of differential misclassification bias that can affect RCTs are performance bias and detection bias.
Performance bias relates to the unequal provision of care between the treatment and control group, apart from the treatment under evaluation. For example, if a health care professional knows that an individual is receiving a placebo or other control they may offer additional therapies. Alternatively, if the patient knows what they are receiving they may change other health behaviours.
Detection bias refers to the biased assessment of outcome, where the outcome assessor or the participant is more or less likely to report a specific outcome in the treatment or control group depending on their beliefs or preferences.
Differential measurement bias in RCTs can be avoided through blinding of different parties depending on the nature of the treatments and the outcome assessment. For example, if patients and health care providers are unaware of the treatment allocation no performance or detection bias can be introduced. It should be noted that when reporting RCTs investigators sometimes write ‘single’ (either participants or assessors) or ‘double blinding’ (both participants and assessors) to mean different things. Reports of RCTs should always spell out exactly who has and has not been blinded from treatment allocation.
It is not always possible to blind subjects or health-care providers (such as in most surgical RCTs) and care must be taken in interpreting the results. A blinded RCT (patients and health professionals unaware of allocation) of cannabis for spasticity in multiple sclerosis patients showed patients who received cannabis tablets were more likely to correctly guess their treatment than the placebo arm even though the medications looked identical (presumably because of the effects of cannabis on mood) (Zajicek et al., 2003). Sometimes great effects are made to maintain blinding by the use of ‘sham’ procedures. An RCT of foetal grafts for Parkinson’s disease randomised patients to active treatment or a sham procedure that involved drilling a burr hole in the skull but not inserting the grafts so that patients and clinical assessors (but not the neurosurgeons) remained blinded to treatment (Olanow et al., 2003).
The STAR RCT reports that it was ‘double-blinded’ and provides enough information to ascertain that this relates to the participants, clinicians and outcome assessors who were all blinded to allocation. Hence, in this instance performance and detection bias should not be an issue.
Loss to follow-up bias and intention to treat analysis
In RCTs bias may also be introduced in the way in which participants come out of the study. Participants may be ‘lost to follow-up’ before the end of the study. It is usual to show this in a figure (see Figure 11.2 for STAR study) as part of the CONSORT reporting guidelines. If there is differential loss of participants between the treatment and control group and losses are related to outcome, then loss to follow-up bias may be introduced into the study and the estimate of the association between treatment and outcome may be either under- or overestimated. For example, suppose for a particular treatment side-effects are more likely amongst older participants who are also more likely to have a worse outcome. If those experiencing the side-effect withdraw from the RCT and are not followed up, then the treatment would appear more beneficial than it really is.
Stay updated, free articles. Join our Telegram channel

Full access? Get Clinical Tree


