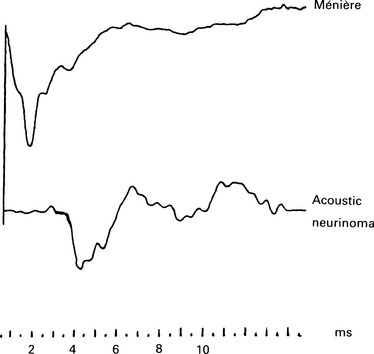
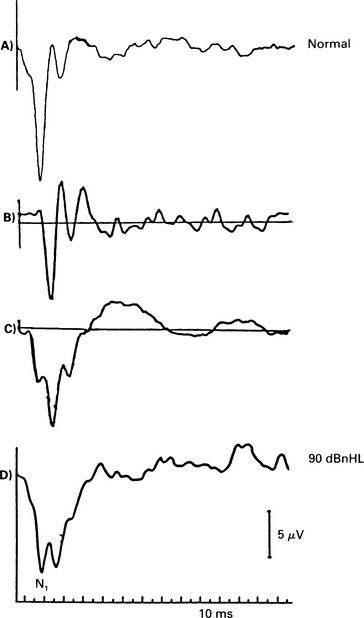
5 The AP latency should be measured at several intensities. If the curve thus obtained follows the shape of the normal latency by intensity function but is displaced to higher intensity values, then the loss is conductive and may be estimated from the average displacement. A cochlear ‘recruiting’ impairment gives ‘displaced’ values at lower intensities, but these values are identical to or approach normal ones at higher intensities (see p. 68). Bone-conduction electrocochleography has been used to measure air–bone gaps, but because of the technical problems created by the electromagnetic artefact from a normal bone conductor, the technique is not widely used. The damage to the hair cells that occurs in cochlear hearing loss is associated with a reduction of CM (Ramsden et al 1980, Keen & Graham 1984) and also SP. If the hair cells in the basal turn are damaged, the contribution from the apical region may become dominant. This results in a prolongation of the latency of the AP due to travelling wave delay. As the synchrony is poorer in the apical region, the waveform may be broader. The waveform of the AP will be, consequently, abnormal. In moderate sensory hearing loss, in which only the outer hair cells have been damaged, the AP can be almost normal for high-intensity stimuli (Aran 1971). Small increments in stimulus intensity may result in inadequate response, manifested in recruitment and abnormal intensity–amplitude function. Cochlear lesions may also affect the tuning mechanism of the cochlea, and result in an abnormal frequency-selectivity function. The CM can be recorded for both click and tone-burst stimuli. It is assumed that in patients with cochlear hearing loss and recruitment, there is hair cell loss. In those patients, the CM in response to high-intensity clicks is considerably smaller than in normal subjects. In the absence of the AP, CMs recorded in patients with severe hearing loss should be interpreted very carefully, as they may be indistinguishable from electromagnetic artefacts (see p. 51). In general, the amplitude of the CM gets smaller with increasing hearing loss. A representative example from Aran & Charlet de Sauvage (1976) shows CM amplitude at click stimulus intensity of 95 dBnHL as a function of the AP threshold (Table 4.1). In cochlear hearing loss due to ototoxic drugs, noise, asphyxia, etc., the SP amplitude is significantly smaller than that recorded in normal subjects (Yoshie 1985). This small amplitude is attributed to hair cell loss and varies from 0 to 1 μV in response to an 80–90 dBnHL stimulus. The amplitude of the SP varies in individuals with the same hearing loss, and depends on the type of the lesion. The intensity–amplitude curves of the SP were below normal in 79% of the cases studied by Ohashi & Yoshie (1985). The SP/AP ratio is also smaller in patients suffering cochlear hearing loss than in normal subjects. AP Waveform in cochlear hearing loss Different waveform patterns at high-intensity stimulation have been recorded in pathological conditions; these have been described as normal, recruiting, abnormally broad, dissociated, and less clearly defined, abnormally shaped responses (Aran 1973) (Fig. 5.1, Fig. 5.5). Fig. 5.5 ECochG waveform in an acoustic neuroma case (the bottom trace), with high frequency hearing loss on the audiogram. The waveform is broad and less well-formed than normal. The shape of the normal I/O function has been explained in Chapter 4. The waveforms associated with a normal I/O function are essentially ‘monophasic’ at high intensities. That is, the positive peak following N1 does not overshoot the baseline or, at least, does not exceed it by a great deal. At lower intensities the waveform is ‘biphasic’. However, in classical recruiting cases the waveform remains ‘biphasic’ at high-intensity levels. Evans (1975) has explained this in terms of damage to hair cell tuning. The shape of the I/O function is that of the H section, as explained in Chapter 4. A broad SP/AP complex may be recorded in pathologies such as Ménière’s disease, acoustic neurinoma, and high-frequency sensorineural hearing loss (Fig. 5.5). However, the reasons for such a response can be different. In Ménière’s disease, the AP can be normal, but the SP is large and of an abnormal duration, presumably because of the abnormal cochlear pressures. Thus, the SP/AP complex is broad, entirely as a result of the SP, as shown in Figure 3.9(a). In acoustic neurinomas and, indeed, in some cases of high-frequency sensorineural hearing loss, the SP/AP complex is broad as a result of an abnormally broad AP (Fig. 5.5). This occurs in the high-frequency loss case because a broad AP is generated by the responding low-frequency fibres. In the case of acoustic neurinoma, it is most likely that desynchronization of the unit APs is the cause. These cases illustrate the occasional need to examine the SP and AP components separately. The dissociated response is encountered in high-frequency hearing loss with a steep slope (Fig. 5.1). The dissociated response is characterized by a sudden increase in latency as the intensity decreases. This occurs in high-frequency hearing loss cases, because a short-latency response from the high-frequency fibres can be recorded only at high intensities. As the intensity is reduced, there comes a point at which the short-latency response from the high-frequency fibres becomes very small, and the response from the lower-frequency fibres, which, in this case, have better thresholds, predominates. Because of the travelling wave delay, the low-frequency response has a longer latency, and so a ‘step’ in the latency I/O function can be seen. Often, at the transition level, we find a double-peaked response in which both the high- and low-frequency responses occur.
ECochG in hearing disorders
ECochG IN CONDUCTIVE HEARING LOSS
Differentiating between conductive and cochlear losses
ECochG IN COCHLEAR HEARING LOSS
Pathophysiology of electrocochleographic responses
Summating potential
Action potential

![]()
Stay updated, free articles. Join our Telegram channel

Full access? Get Clinical Tree


ECochG in hearing disorders


