4.2.1 Distribution Volumes
Three important physiological volumes—plasma water, extracellular fluid, and total body water—are shown in Figure 4.2. In the figure, these volumes are drawn to scale.
FIGURE 4.2 Physiological volumes drugs may access. *Most capillary membranes are loose and permit the paracellular passage of even large polar drugs. Notable exceptions include the brain, testes, and placenta. **Possible only for lipophilic drugs unless a specialized transport system is present for a drug. Efflux transporters may extrude drugs that penetrate the membrane. Note that the three volumes are drawn to scale.
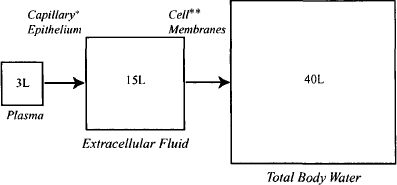
Plasma In the systemic circulation, drugs distribute throughout the volume of plasma water (about 3 L) (Figure 4.2). Where a drug goes beyond this, including distribution to the cellular elements of the blood, depends on the physicochemical properties of the drug and the permeability characteristics of individual membranes.
Distribution to the Extracellular Fluid The membranes of the capillary epithelial cells are generally very loose in nature and permit the paracellular passage of even polar and/or large drug molecules, including the aminoglycosides (log D7.4 ≈ – 10; MW 450 to 1000 Da) and protein molecules. Thus, most drugs are able to distribute throughout the volume of extracellular fluid, a volume of about 15 L (Figure 4.2). However, the capillary membranes of certain tissues, notably delicate tissues such as the central nervous system, the placenta, and the testes, have much more tightly knit membranes, which may limit the access of certain drugs, particularly large and/or polar drugs.
Distribution to Intracellular Fluid Once in the extracellular fluid, drugs are exposed to the individual cells of tissues. The ability of drugs to penetrate the membrane of these cells is dependent on a drug’s physicochemical properties (Figure 4.2). Polar drugs and large molecular mass drugs will be unable to pass cell membranes by passive diffusion. For example, the extremely polar aminoglycosides cannot penetrate cell membranes and, as a result, distribute into a volume that is approximately equal to that of extracellular fluid. Polar drugs may enter cells if they are substrates for specialized uptake transporters. The antidiabetic drug metformin is a small polar molecule (MW 129 Da; log D7.4 ≈ -3.4) that would be expected to have difficulty diffusing through cell membranes. However, it is able to access its site of action in the hepatocyte because it is a substrate for the hepatic organic cation transporter (OCT1), which transports it across the hepatocyte membrane. On the other hand, efflux transporters will restrict the distribution of their substrates. For example, P-glycoprotein (P-gp) at the blood-brain barrier limits the access of a large number of drugs, including ritonavir, loperamide, and many anticancer drugs. Small lipophilic drugs that can easily penetrate cell membranes can potentially distribute throughout the total body water, which is around 40 L.
In summary, drugs are able to pass through most of the capillary membranes in the body and distribute into a volume approximately equal to that of the extracellular fluid (about 15 L). The ability of a drug to distribute beyond this depends primarily on its physicochemical characteristics. Small, lipophilic drug molecules should penetrate biological membranes with ease and distribute throughout the total body water (about 40 L). A drug’s distribution to specific tissues may be enhanced by uptake transporters. Conversely, efflux transporters will restrict the tissue distribution of their substrates. Total body water, about 40 L, represents the maximum volume into which a drug can distribute.
4.2.2 Tissue Binding and Plasma Protein Binding: Concentrating Effects
Given that drug distribution is driven primarily by passive diffusion, it would be reasonable to assume that once distribution has occurred, the concentration of drug would be the same throughout its distribution volume. This is rarely the case because of tissue and plasma protein binding. Drugs frequently bind in a reversible manner to sites on proteins and other macromolecules in the plasma and tissues (binding is discussed in more detail in Section 4.2.4). At this time it is important to appreciate that bound drug cannot participate in the concentration gradient that drives the distribution process. The bound drug can be considered to be secreted away or hidden in tissue or plasma. Binding has a very important influence on a drug’s distribution pattern. Consider a drug that binds extensively (90%) to the plasma proteins but does not bind to tissue macromolecules. In the plasma, 90% of the drug is bound and only 10% is free and able to diffuse to the tissues. At equilibrium, the unbound concentrations in the plasma and tissues will be the same, but the total concentration of drug in the plasma will be much higher than that in the tissues.
Plasma protein binding has the effect of limiting distribution and concentrating drug in the plasma (Figure 4.3). On the other hand, consider a drug that binds extensively to macromolecules in the tissues but does not bind to the plasma proteins. Assume that overall 90% of the drug in the tissues is bound and only 10% is free. As the distribution process occurs, a large fraction of the drug in the tissues will bind and be removed from participation in the diffusion gradient. As a result, more and more drug will distribute to the tissues. When distribution is complete, the unbound concentrations in the plasma and tissues will be the same, but the total (bound plus free) average tissue concentration will be much larger than the plasma concentration (Figure 4.3). Tissue binding essentially draws drug from the plasma and concentrates it in the tissues. Drugs often bind to both the plasma proteins and tissue macromolecules. In this case the final distribution pattern will be determined by which is the dominant process.
FIGURE 4.3 Influence of plasma protein binding and tissue binding on a drug’s distribution between the plasma and tissues. The histograms show the total plasma (Cp) and tissue (Ct) concentrations of a drug partitioned into free and bound drug. At equilibrium, the free drug concentration is the same in the plasma and tissues. If a drug does not bind either to plasma proteins or tissue macromolecules, the total concentrations in the tissues and plasma will be the same (a). Plasma protein binding concentrates drug in the plasma (b) and tissue binding concentrates drug in the tissues (c).
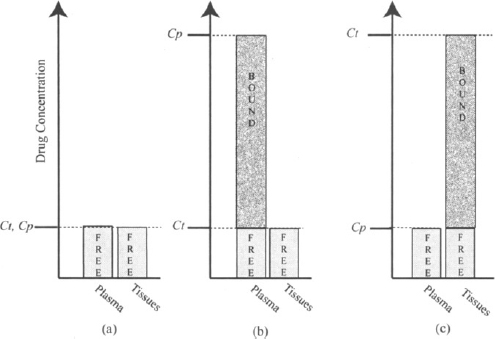
In summary, the binding of drugs to plasma proteins and tissue macromolecules exerts an important influence on the pattern of drug distribution. Plasma protein binding tends to concentrate drug in the plasma and limit its distribution to the tissues. Tissue binding tends to concentrate a large amount of drug in a tissue. Drug concentration will vary from tissue to tissue and be greatest in those tissues where binding is most extensive.
Overall, drug distribution is driven primarily by the passive diffusion of a drug along the concentration gradient created by the unbound drug in the plasma and tissues. The overall pattern of drug distribution is determined by the physiological volumes that a drug is able to access and by the concentrating effects of drug binding to plasma protein and/or tissues. Once distribution is complete, the unbound drug concentration should be the same throughout the physiological volumes where the drug is found. However, uptake and efflux transporters may also be involved and may, respectively, either promote or limit a drug’s distribution beyond that predicted by passive diffusion alone.
4.2.3 Assessment of the Extent of Drug Distribution: Apparent Volume of Distribution
Once distribution has gone to completion, the ratio of the total tissue concentration to the total plasma concentration remains constant. The actual tissue concentration (and the ratio) will vary from tissue to tissue, depending on the relative effects of tissue and plasma protein binding. It is not possible to measure individual tissue concentrations, and it is convenient to consider an overall average tissue concentration (Ct). The ratio of Ct to Cp will vary from drug to drug.
It is important to find a way to express a drug’s distribution characteristics using a number or distribution parameter that can easily be estimated clinically. The ratio discussed above (Ct/Cp) expresses distribution but cannot be measured easily. The requirements for the distribution parameter are:
- It assesses or reflects the relative distribution of the drug between the plasma and the rest of the body once distribution is complete.
- It must use the plasma concentration of the drug, as this is usually the only drug concentration that can be measured routinely.
Consider two drugs, A and B. Assume that A cannot distribute to any great extent beyond the plasma, perhaps because it binds extensively to the plasma proteins (the Ct/Cp ratio is small). Assume that drug B distributes extensively to the tissues, perhaps because of extensive tissue binding (the Ct/Cp ratio is high). Assume that doses of each were administered, and that at some time after distribution occurred, their plasma concentrations were compared at a time when there were equal amounts of each drug in the body.
Let Ab be the amount of drug in the body. Consider the following ratio for each drug:
(4.1) 
For drug A,
(4.2) 
For drug B,
(4.3) 
The ratio would be smaller for drug A than for drug B:
Thus, the value of this ratio is a measure of a drug’s extent of distribution. A large value indicates extensive distribution, and a small value indicates limited distribution. The denominator and numerator of equation (4.4) can be measured: The plasma concentration can be measured at any time after a dose, and there an; certain times when the amount of drug in the body is known, such as immediately after an intravenous bolus injection. The ratio has units of volume and is known as the apparent volume of distribution (Vd):

The box around equation (4.5) signifies that it is an important equation that should be memorized. The word apparent is usually dropped and the parameter is known simply as the volume of distribution. Table 4.1 shows the calculations of Vd for the example drugs above based on the amount of drug in the body and the corresponding plasma concentration. The plasma concentration of each was determined at a time when the amount of drug in the body was known.
TABLE 4.1 Calculation of Vd for Drugs A and B
| Drug A | Drug B | |
| Ab (mg) at time t | 100 | 100 |
| Cp (mg/L) at time t | 5 | 0.1 |
| Vd = Ab/Vd (L) | 20 | 1000 |
It is important to appreciate that the volume of distribution is simply a ratio that has units of volume. It is not a physiological volume and, despite its name, it is not the volume into which a drug distributes. The fact that drug A has a Vd value of 20 L (Table 4.1) does not mean that it distributes into a volume of 20 L, which is greater than extracellular fluid and less than the total body water. In theory it could do so if, for example, it did not bind to plasma proteins or tissue macromolecules and could not access most of the intracellular fluid. On the other hand, if it binds to plasma protein:;, it could distribute throughout the total body water (40 L) and have a Vd of 20 L.
The value of Vd depends in part on the volume into which the drug distributes, but it is also dependent on a drug’s tissue and plasma protein binding characteristics. This can be made clear by an example.
Example 4.1 Consider three beakers, each filled with 1 L of water (Figure 4.4).
FIGURE 4.4 Apparent volume of three beakers. Each beaker contains 1 L of water and 100 mg of a soluble drug. Beaker 2 contains charcoal on the bottom that adsorbs 90% of the drug. Beaker 3 has charcoal suspended in the upper 500 mL that adsorbs 90% of drug. The charcoal in beaker 3 is prevented from accessing the lower portion of the beaker by a semipermeable membrane.
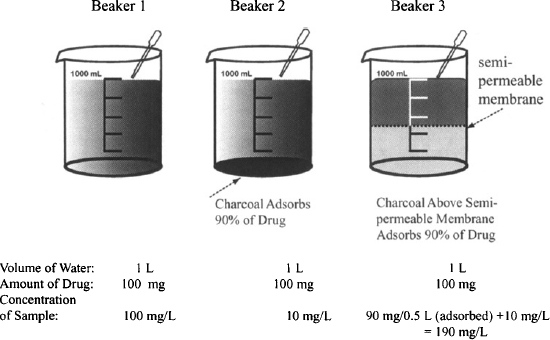
- Each contains 100 mg of a water-soluble drug.
- Beaker 2 contains charcoal on the bottom which adsorbs 90% of the drug.
- Beaker 3 has charcoal suspended in the upper half of the liquid. The charcoal cannot access the lower 500 mL because it cannot penetrate a semipermeable membrane that separates the two halves of the liquid. The charcoal adsorbs 90% of the drug in the upper liquid.
- It is not possible to measure the volume of liquid in either beaker. They have to be estimated based on the drug concentration of a sample taken from the top of each beaker. The estimated volume is referred to as the apparent volume (based on sampling of the drug concentration in the solution).
Solution Table E4.1 shows the calculation of the apparent volume of fluid in each beaker based on the concentration of drug sampled in each. Beaker 2 has charcoal in the bottom that absorbs 90% of the drug. Beaker 3 has charcoal suspended in the upper 500 mL that adsorbs 90% of drug. The remaining 10% of the drug dissolves in the full 1 L. It can be seen that when the charcoal draws drug away from the sampling fluid (beaker 2), it causes the apparent volume to be greater than the actual volume. Conversely, when the charcoal concentrates the drug in the sampling fluid (beaker 3), it causes the apparent volume to be less than the actual volume.
TABLE E4.1 Calculation of the Apparent Volume of Fluid Based on the Amount of Drug Present in the System and Its Concentration in the Fluid
In the body, drug concentrations are sampled from the plasma. Binding of drugs to the tissue macromolecules draws drug from the plasma and causes the volume of distribution to be greater than the actual volume into which a drug distributes. Conversely, plasma protein binding causes drug to concentrate in the sampling volume (plasma). This results in an apparent volume that is less than the actual distribution volume. Under the unusual circumstances that a drug does not bind to plasma proteins or tissue macromolecules, its volume of distribution will be equal to the volume into which it distributes. This is the case for ethanol, which distributes throughout the total body water, doesn’t bind to plasma proteins or tissue macromolecules, and has a volume of distribution of around 40 L.
Because of its dependence on physiological volumes, the volume of distribution is dependent on body size and is most conveniently expressed on a per kilogram of body weight basis. This value is then multiplied by body weight to obtain a person’s volume of distribution. A 35-kg child will thus have a volume of distribution of a drug half that of a typical 70-kg standard adult male. The volume of distribution expressed in this way is assumed to be a constant for a drug, assuming normal conditions and health. Its value may be affected by conditions that affect either body volumes (e.g., dehydration, overhydration, the presence of ascites), plasma protein binding, or tissue binding.
Table 4.2 shows the values of the volume of distribution of some drugs. Some commonly encountered volumes are presented to provide some perspective. A consideration of some of the values in the table clearly illustrates that the volume of distribution cannot possibly be equal to the volume into which a drug distributes. Chloroquine has a volume of distribution approximately equal to that of an average dumpster or aboveground swimming pool. A drug’s volume of distribution exceeds physiological volumes because of tissue binding, which draws a large fraction of the drug from the plasma and results in an average tissue concentration that exceeds the plasma concentration. The volume of distribution could be considered to be the hypothetical volume into which the drug distributes if the concentration of drug throughout the volume was the same and equal to the plasma concentration.
TABLE 4.2 Volume of Distribution of Select Drugs
| Drug/Physiological Volume | Vd (L/70 kg) | Example of Volume |
| Plasma | 3 | |
| Heparin | 4.2 | Gallon of milk |
| Warfarin | 8 | |
| Extracellular fluid | 15 | Water cooler vessel |
| Aminoglycosides | 20 | |
| Total body water | 40 | |
| Phenytoin | 45 | Approximately a “half-barrel” keg |
| Atenolol | 65 | |
| Diazepam | 77 | |
| Digoxin | 500 | Large refrigerator |
| Felodipine | 700 | |
| Nortriptyline | 1,260 | |
| Amiodarone | 4,600 | |
| Chloroquine | 14,000 | Dumpster/aboveground pool |
4.2.3.1 Fraction of Drug in the Plasma and Tissues
The value of a drug’s volume of distribution can be used to estimate the fraction of the drug in the body that is physically present in either the plasma or the tissues. The drug in the body (Ab) may be partitioned into drug in the plasma (Ap) and drug outside the plasma or in the tissues (At):

The fraction of the drug in the plasma,
(4.7) 
The amount of drug in the plasma is the product of the plasma concentration and the volume of the plasma.
The amount of drug in the body is the product of the volume of distribution and the plasma concentration [see equation (4.5)]:
(4.8) 
In a standard 70-kg adult male, Vp = 3 L:
(4.9) 
The fraction of the drug in the body located in the tissues:
fraction in tissue = 1 – fraction in plasma
(4.10) 
Table 4.3 shows the relative distribution of drugs between the tissues and plasma for different values of volume of distribution.
TABLE 4.3 Relative Distribution of Drugs Between the Plasma and Tissues for Different Values of Vd
| Vd (L/70 kg) | Drug in Plasma (%)a | Drug in Tissues (%) |
| 12 | 25 | 75 |
| 21 | 14 | 86 |
| 42 | 7 | 93 |
| 300 | 1 | 99 |
| 12,000 | 0.025 | 99.98 |
| aAssumes that Vp = 3 L for a standard 70-kg person. | ||
4.2.3.2 Influence of Tissue and Plasma Protein Binding
As expressed in equation (4.6), drug in the body is located in either the plasma or the tissues. The amount of drug in either of these spaces is the product of the concentration of drug and the volume of the space. Equation (4.6) can be rewritten
where Vt is the volume outside the plasma into which the drug distributes. Drug diffusion is driven by the concentration gradient created by the unbound drug in the plasma and tissues. The unbound drug concentrations are expressed as

where Cpu and Ctu are the unbound drug concentrations in the plasma and tissue, respectively, and fu and fut are the fractions unbound in the plasma and tissues, respectively.
When distribution is complete, the unbound drug concentrations in the tissue and plasma are equal:

Substituting for the expressions of Cpu and Ctu given in equation (4.12) into equation (4.13) yields
(4.14) 
Rearranging gives

Substituting the expression of Ct given in equation (4.15) into equation (4.11), we have
Equation (4.16) shows that a drug’s volume of distribution is dependent on both the volume into which a drug distributes and on tissue and plasma protein binding. It also shows that increased tissue binding (fut ↓) or decreased plasma protein binding (fu ↑) will result in an increase in the volume of distribution.
Equation (4.16) can also be used to show that if a drug binds to neither the plasma proteins (fu = 1) nor the tissues (fut = 1), its volume of distribution will be equal to that of the volume into which the drug distributes. Table 4.4 lists some compounds that have volumes of distribution that approximate the volumes into which they distribute. The volume of distribution of these substances can be used to estimate the respective physiological volumes.
TABLE 4.4 Compounds That Do Not Bind to Plasma Proteins or Tissue Macromolecules
| Compound | Vd (L) in 70-kg Male |


