Chapter 22 Drug discovery and development
facts and figures
In this chapter we present summary information about the costs, timelines and success rates of the drug discovery and development operations of major pharmaceutical companies. The information comes from published sources, particularly the websites of the Association for the British Pharmaceutical Industry (www.abpi.org.uk), the European Federation of Pharmaceutical Industries and Associations (www.efpia.eu) and the Pharmaceutical Research and Manufacturers of America (www.phrma.org). Much of this information comes, of course, directly or indirectly from the pharmaceutical companies themselves, who are under no obligation to release more than is legally required. In general, details of the development process are quite well documented, because the regulatory authorities must be notified of projects in clinical development. Discovery research is less well covered, partly because companies are unwilling to divulge detailed information, but also because the discovery phase is much harder to codify and quantify. Development projects focus on a specific compound, and it is fairly straightforward to define the different components, and to measure the cost of carrying out the various studies and support activities that are needed so that the compound can be registered and launched. In the discovery phase, it is often impossible to link particular activities and costs to specific compounds; instead, the focus is often on a therapeutic target, such as diabetes, Parkinson’s disease or lung cancer, or on a molecular target, such as a particular receptor or enzyme, where even the therapeutic indication may not yet be determined. The point at which a formal drug discovery project is recognized and ‘managed’ in the sense of having a specific goal defined and resources assigned to it, varies greatly between companies. A further complication is that, as described in Section 2 of this book, the scientific strategies applied to drug discovery are changing rapidly, so that historic data may not properly represent the current situation. For these reasons, it is very difficult to obtain anything more than crude overall measures of the effectiveness of drug discovery research. There are, for example, few published figures to show what proportion of drug discovery projects succeed in identifying a compound fit to enter development, whether this probability differs between different therapeutic areas, and how it relates to the resources allocated. We attempt to predict some trends and new approaches at the end of this chapter.
As will be seen from the analysis that follows, the most striking aspects of drug discovery and development are that (a) failure is much more common than success, (b) it costs a lot, and (c) it takes a very long time (Figure 22.1). By comparison with other research-based industries, pharmaceutical companies are playing out a kind of slow-motion and very expensive arcade game, with the odds heavily stacked against them, but offering particularly rich rewards.
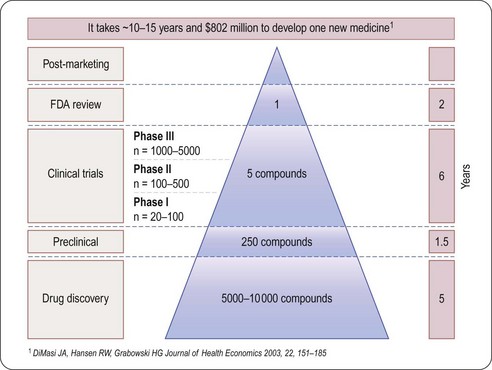
Fig. 22.1 The attrition of compounds through the discovery and development pipeline (PhRMA).
Reproduced, with permission, from DiMasi et al., 2003.
Spending
Worldwide, the R&D spending of the American-based pharmaceutical companies has soared, from roughly $5 billion in 1982 to $40 billion in 1998 and $70 billion in both 2008 and 2009. Figure 22.2 shows total R&D expenditure for US-based companies over the period 1995–2009. The R&D expenditure of the 10 largest pharmaceutical companies in 2009 averaged nearly $5 billion per company over the range of Roche at $8.7 billion to Lilly at $4.13 billion (Carroll, 2010). Marketing and administration costs for these companies are about three times as great as R&D costs. The annual increase in R&D spending in the industry in most cases has exceeded sales growth over the last decade, reflecting the need to increase productivity (see Kola and Landis, 2004). Today a minimum of 15–20% of sales revenues are reinvested in R&D, a higher percentage than in any other industry (Figure 22.3). The tide may have turned, however, and in 2010 the overall global R&D spend for the industry fell to $68 billion (a 3% reduction from 2009) (Hirschler, 2011). This fall reflects a growing disillusion with the poor returns on money invested in pharmaceutical R&D and some companies (notably Pfizer with a 25% reduction over the next 2 years) have announced plans to make further cuts in their budgets. The overall cost of R&D covers discovery research as well as the various development functions, described in Section 3 of this book. The average distribution of R&D expenditure on these different functions is shown in Table 22.1. These proportions represent the overall costs of these different functions and do not necessarily reflect the costs of developing an individual compound. As will be discussed later, the substantial drop-out rate of compounds proceeding through development means that the overall costs cover many failures as well as the few successes. Overall cost of developing a compound to launch and how much this has increased between 1979 and 2005 is shown in Figure 22.4.
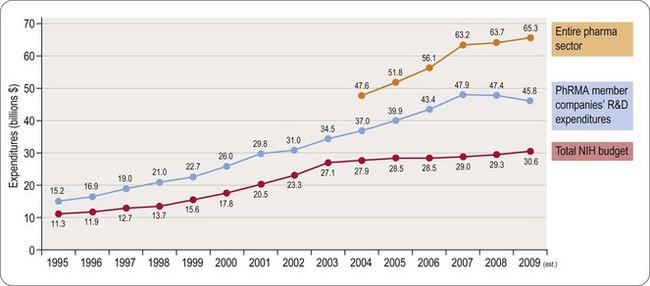
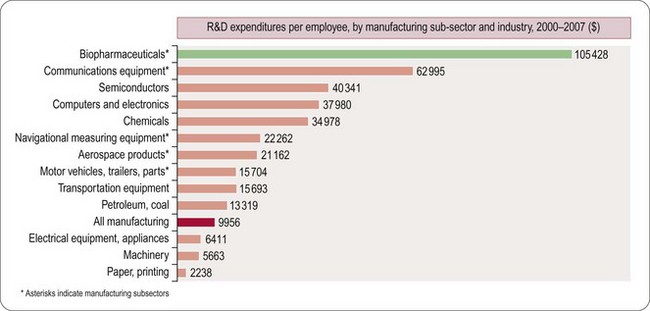
Table 22.1 R&D expenditure by function (2008)
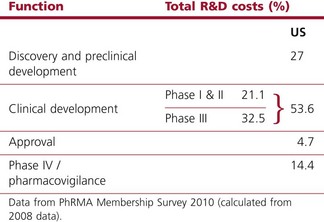 |
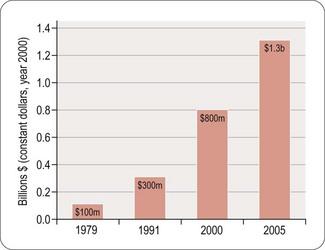
Fig. 22.4 The costs (corrected for inflation) of drug development continue to increase (PhRMA, 2011).
Numbers of compounds in clinical development according to therapeutic classes is shown in Figure 22.5, based on a survey of the American research-based pharmaceutical industry, and is dominated by four therapeutic areas, namely:
• Central nervous system disorders (including Alzheimer’s disease, schizophrenia, depression, epilepsy and Parkinson’s disease)
• Cancer, endocrine and metabolic diseases (including osteoporosis, diabetes and obesity)
• Cardiovascular diseases (including atherosclerosis, coronary disease and heart failure)
• Infectious diseases (including bacterial, viral and other infections such as malaria).
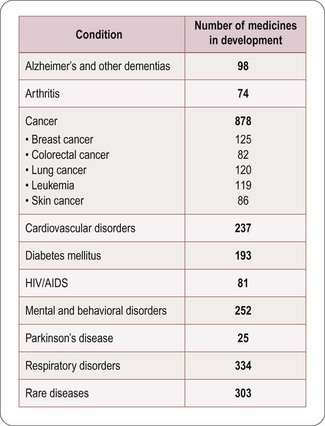
Fig. 22.5 Numbers of compounds in clinical development for different therapeutic targets (PhRMA, 2011).
The trend in the last decade has been away from cardiovascular disease towards other priority areas, particularly cancer and metabolic disorders, and also a marked increase in research on biopharmaceuticals, whose products are used in all therapeutic areas. There is also a marked increase in the number of drugs being introduced for the treatment of rare or orphan diseases driven by enabling legislation in the USA and EU (see Chapter 20).
How much does it cost to develop a drug?
Estimating the cost of developing a drug is not as straightforward as it might seem, as it depends very much on what is taken into account in the calculation. Factors such as ‘opportunity costs’ (the loss of income that theoretically results from spending money on drug development rather than investing it somewhere else) and tax credits (contributions from the public purse to encourage drug development in certain areas) make a large difference, and are the source of much controversy. The Tufts Centre for Drug Development Studies estimated the average cost of developing a drug in 2000 to be $802 million, increasing to $897 million in 20031 (DiMasi et al., 2003; Figure 22.1), compared with $31.8 million (inflation-adjusted) in 1987, and concluded that the R&D cost of a new drug is increasing at an annual rate of 7.4% above inflation.
Based on different assumptions, even larger figures – $1.1 billion per successful drug launch over the period 1995–2000, and $1.7 billion for 2000–2002 – were calculated by Gilbert et al. (2003).
The fact that more than 70% of R&D costs represents discovery and ‘failure’ costs, and less than 30% represents direct costs (which, being determined largely by requirements imposed by regulatory authorities, are difficult to reduce), has caused research-based pharmaceutical companies in recent years to focus on improving (a) the efficiency of the discovery process, and (b) the success rate of the compounds entering development (Kola and Landis, 2004). A good recent example of expensive failure of a compound in late-stage clinical development is illustrated by the experience of Pfizer with their cholesterol ester transfer protein (CETP) inhibitor, torcetrapib (Mullard, 2011). This new approach to treating cardiovascular disease by raising levels of the ‘good’ HDL cholesterol had looked very promising in the laboratory and in early clinical testing, but in late 2006 development was halted when a large Phase III clinical trial revealed that patients treated with the drug had an increased risk of death and heart problems. At the point of termination of their studies Pfizer had already spent $800 million on the project. The impact extended beyond Pfizer, as both Roche (dalcetrapib) and Merck (anacetrapib) had their own compounds acting on this mechanism in clinical development. It was necessary to decide if this was a class effect of the mechanism or whether it was just a compound-specific off-target effect limited to torcetrapib. Intensive comparisons of these agents in collaboration with academic groups and a published full analysis of the torcetrapib clinical trial data allowed the conclusion that this was most likely to be an effect limited to torcetrapib, possibly mediated by aldosterone, and it was not seen with the other two CETP blockers (Mullard, 2011). Roche and Merck were able to restart their clinical trials, but using very large numbers of patients and focusing on clinical outcomes to establish efficacy and safety. The Pfizer experience probably added 4 years to the time needed to complete development of the Merck compound anacetrapib and made this process more expensive (for example the pivotal study that started in 2011 will recruit 30 000 patients) with no guarantee of commercial success. In addition the patent term available to recover development costs and to make any profit is now 4 years shorter (see Chapter 19). It is not unreasonable to estimate that collectively the pharmaceutical industry will have spent more than $3 billion investigating CETP as a mechanism before we have either a marketed product or the mechanism is abandoned.
Sales revenues
Despite the stagnation in compound registrations over the past 25 years, the overall sales of pharmaceuticals have risen steadily. In the period 1999–2004 the top 14 companies showed an average sales growth of 10% per year, whereas in 2004–2009 growth was still impressive but at a lower rate of 6.7% per year. However, the boom years may be behind us and the prediction is that for 2009–2014 the growth will be a modest 1.2% per year (Goodman, 2009). Loss of exclusivity as patents expire is the most important reason for reduced sales growth (Goodman, 2009). The total global sales in 2002 reached $400.6 billion and in 2008 had risen to $808 billion (EFPIA, 2010). In Europe the cost of prescribed drugs accounts for some 17% of overall healthcare costs (EFPIA, 2010).
Profitability
For a drug to make a profit, sales revenue must exceed R&D, manufacture and marketing costs. Grabowski et al. (2002) found that only 34% of new drugs introduced between 1990 and 1994 brought in revenues that exceeded the average R&D cost (Figure 22.6). This quite surprising result, which at first sight might suggest that the industry is extremely bad at doing its sums, needs to be interpreted with caution for various reasons. First, development costs vary widely, depending on the nature of the compound, the route of administration and the target indication, and so a drug may recoup its development cost even though its revenues fall below the average cost. Second, the development money is spent several years before any revenues come in, and sales predictions made at the time development decisions have to be taken are far from reliable. At any stage, the decision whether or not to proceed is based on a calculation of the drug’s ‘net present value’ (NPV) – an amortised estimate of the future sales revenue, minus the future development and marketing costs. If the NPV is positive, and sufficiently large to justify the allocation of development capacity, the project will generally go ahead, even if the money already spent cannot be fully recouped, as terminating it would mean that none of the costs would be recouped. At the beginning of a project NPV estimates are extremely unreliable – little more than guesses – so most companies will not pay much attention to them for decision-making purposes until the project is close to launch, when sales revenues become more predictable. Furthermore, unprofitable drugs may make a real contribution to healthcare, and companies may choose to develop them for that reason.
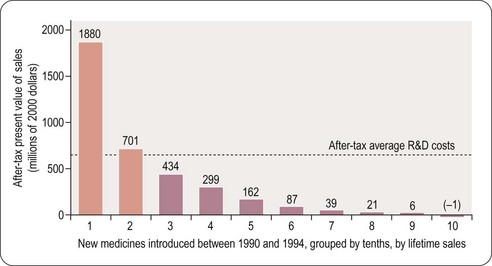
Even though only 34% of registered drugs in the Grabowski et al. (2002) study made a profit, the profits on those that did so more than compensated for the losses on the others, leaving the industry as a whole with a large overall profit during the review period in the early 1990s. The situation is no longer quite so favourable for the industry, partly because of price control measures in healthcare, and partly because of rising R&D costs. In the future there will be more emphasis on the relative efficacy of drugs and it will only be those new agents that have demonstrable superiority over generic competitors that will be able to command high prices (Eichler et al., 2010). It is likely that the pharmaceutical industry will adapt to changed circumstances, although whether historical profit margins can be maintained is uncertain.
Pattern of sales
The distribution of sales (2008 figures) by major pharmaceutical companies according to different therapeutic categories is shown in Table 22.2. Recent changes reflect a substantial increase in sales of anticancer drugs and drugs used to treat psychiatric disorders. The relatively small markets for drugs used to treat bacterial and parasitic infections contrasts sharply with the worldwide prevalence and severity of these diseases, a problem that is currently being addressed at government level in several countries. The USA represents the largest and fastest-growing market for pharmaceuticals (61% of global sales in 2010). Together with Europe (22%) and Japan (5%), these regions account for 88% of global sales. The rest of the established world market accounts for only 10%, with 3% in emerging markets (EFPIA, 2010). The approaching patent cliff (see later) suggests that with the current business model there may be a 5–10% reduction in sales and a 20–30% reduction in net income over 2012–2015 for the 13 largest companies (Munos, 2009). Not all predictions are pessimistic and IMS have recently opined that global drug sales will top $1 trillion in 2014 (Berkrot, 2010). Whilst accepting that growth in USA and other developed markets is slowing, they believe that this will be more than compensated for by growth in developing markets (China is growing at 22–25% per year and Brazil at 12–15% per year).
Table 22.2 Global sales by therapeutic area (Maggon, 2009)
| Therapeutic area | $US billions |
|---|---|
| Arthritis | 35 |
| Infectious disease | 24 |
| Cancer | 70 |
| Cardiovascular disease | 105 |
| Central nervous system | 118 |
| Diabetes | 21 |
| Respiratory disease | 25 |
Stay updated, free articles. Join our Telegram channel

Full access? Get Clinical Tree


