New Terminology20
Agonist Selectivity20
Affinity20
Efficacy26
Drugs with Multiple Efficacies29
Quantifying Agonist Activity32
Descriptive Pharmacology: II34
Summary35
This chapter specifically discusses the concepts of affinity (expressed as a ratio of the rate of dissociation of the molecule from the protein (k2) and the rate of association to the protein (k1) in a parameter referred to as Keq where Keq=k2/k1) and efficacy (the property of a molecule that changes the behavior of the biological target towards its cellular host when bound to that target). This latter term is general in that a given drug can have numerous “efficacies” of varying strength to yield multiple activities that are expressed either as sub-maximal (termed partial agonists) or maximal (full agonists) effects.
Keywords
affinity, efficacy, equilibrium dissociation constant, lead optimization.
Introduction
Up to this point, drug activity (specifically that of an agonist) is described as observed effect quantified by a dose–response curve. Thus the maximal response and the potency of an agonist (location of the curve along the drug concentration axis) in any specific system yield the measure of activity in that system. Also, as noted in the last chapter, the magnitude of the observed organ response is controlled by four factors, two drug-related and two tissue-related. This chapter describes the two drug related parameters of affinity and efficacy. The value in quantifying these parameters is that they are unique properties of the drug acting on the target, and thus are true for that target in all tissues and organs in which it resides. Therefore, if the affinity and efficacy of a given molecule can be determined in one system (referred to as the “test” system), then these parameters may be used to assess drug activity in any other system, including the therapeutic one. This is of great value since drugs are very rarely discovered and studied directly in the therapeutic system. A prerequisite to the determination of the affinity and efficacy of agonists is to know that the agonism is selective for the particular target of interest. There are two main strategies for making this determination.
New Terminology
• k1: The rate of association of a molecule as it binds to the target in units of s−1mol−1.
• k2: The rate of dissociation of the molecule away from the target during the binding process in units of s−1.
• Keq: Equilibrium dissociation constant of the molecule–target complex in units of mole (Keq=k2/k1); also equal to the concentration of drug that binds to 50% of the target population available for binding. For agonists, Keq is denoted KA; for antagonists KB. Affinity=Keq−1.
• Lead: In new drug discovery, a molecule that fulfills criteria for possible activity from a screening process is termed a “hit.” A hit with the added qualities of chemical tractability (opportunity to change the chemical scaffold to modify structure), selectivity and lack of toxicity is termed a “lead.”
• Lead optimization: The process of iterative medicinal chemistry to modify structure to enhance primary activity and selectivity.
Agonist Selectivity
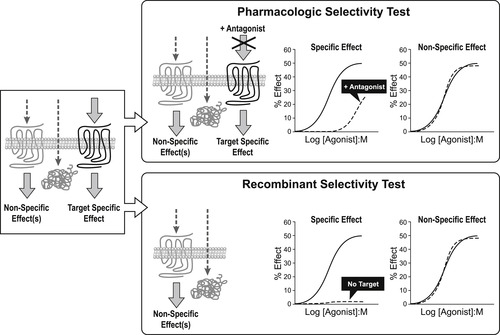
As discussed in the previous chapter, there are numerous potential biological targets in any given cell that a chemical could activate to cause agonism. Usually, a non-specific activation is not therapeutically useful, as it comes with a non-specific activation of organs leading to unwanted side-effects. By definition, the chemical control of pathology through pharmacological agonism requires a selective activation of the predetermined therapeutic biological target. There are two basic approaches for identifying selective agonist effect.
The first is pharmacologic intervention whereby a specific antagonist of the target is given as a pretreatment to the preparation (either in vitro or in vivo) to see if the observed agonism to the test agonist is eliminated (or ablated) (see Fig. 2.1). If the agonist action emanates from the binding of the test agonist to the same site as that utilized by the antagonist, a steric hindrance will occur and agonism will be blocked. However, it will be seen that in the case of an allosteric activation of the target where the test agonist binds to a site separate from that of the antagonist, interference of the agonist response with antagonist binding may not occur. Therefore, another strategy that may be employed in these cases (or in general to ensure that this possibility is considered experimentally) is to use a recombinant system. In this approach, genetic material for the biological target of interest (specifically complementary DNA (cDNA)) is used to transfect host cells. The test agonist is then tested in the transfected cell and the non-transfected host cell (i.e., the same cell line but with no receptor present). If the response is observed only in the transfected cell line (containing the target of interest), this is presumptive evidence that the agonist activates the biological target of interest (see Fig. 2.1).
Affinity
A simple model of ligand binding, originally designed to describe the binding of chemicals to metal surfaces in the making of filaments for light bulbs, was published by the chemist Irving Langmuir (see Box 2.1); accordingly, it is referred to as the Langmuir adsorption isotherm and it still forms the basis for the measurement and quantification of drug affinity. In Langmuir’s model, a drug molecule has an intrinsic rate of association with the receptor (referred to as the “rate of condensation” by Langmuir). In Langmuir’s system the target was the surface of metal, but in the context of pharmacology the target is the binding pocket of a biologically relevant protein such as a receptor. This rate of association (denoted k1) is driven by changes in energy, i.e., the energy of the system containing the drug in the receptor binding pocket is lower than the energy of the system with the drug not bound in the pocket. The drug also has a rate of dissociation from the receptor (referred to by Langmuir as a rate of “evaporation”) which describes the change in energy when the molecule diffuses away from the surface (denoted k2). When a drug is present in the compartment containing the receptor, then the concentration gradient controls the movement of drug molecules. The absence of drug in the receptor binding pocket drives the binding reaction toward drug binding to the receptor but, as more drug binds, the bound drug will diffuse out of the binding pocket in accordance with its natural tendency to do so. This leads to an equilibrium whereby the rate of drug leaving the binding pocket will equal the rate of drug approaching and entering the binding pocket. The ratio of k2/k1 determines the amount of drug bound to the receptor at any one instant and this becomes a measure of how well the drug binds to the receptor. This ratio is referred to as the equilibrium dissociation constant of the drug–receptor complex (denoted Keq). Under these circumstances, the reciprocal of Keq is a measure of the affinity of the chemical for the target. The derivation of Langmuir’s isotherm, in his original terminology, is given in Box 2.2; the form utilized by pharmacologists is:
Box 2.1

Irving Langmuir (born in Brooklyn, New York) graduated as a metallurgical engineer from the School of Mines at Columbia University in 1903. He went on to achieve a PhD in Physical Chemistry with Nersnt. He returned to America to join, and eventually become director of, the Research Laboratory of the General Electric Company in Schnectady, New York. Langmuir’s studies of vacuum phenomena led him to investigate the properties of adsorbed films, leading to his derivation of the adsorption isotherm. He contributed to the Lewis theory of shared electrons and his work led to the gas-filled incandescent lamp and the discovery of atomic hydrogen. Langmuir won numerous awards for his work, including the Nobel Prize for Chemistry in 1932.
Box 2.2

Langmuir’s model was centered on the calculation of the fraction of the total area of surface bound by a chemical (denoted by Langmuir as θμ). The fraction of total area left free for further binding of new molecule to the surface is given by 1−θμ. In Langmuir’s terminology, the amount of chemical bound to the surface is the product of the concentration of drug available for binding (denoted as μ), the rate of “condensation” of chemical onto the surface (α) and the fraction of surface left free for further binding (1−θμ) (Rate of condensation=μα[1−θμ]). Similarly, the amount of drug diffusing away (denoted “evaporation” by Langmuir) from the surface is given by the amount already bound (θμ) multiplied by a rate of evaporation (denoted V1) (Rate of evaporation=θμV1).
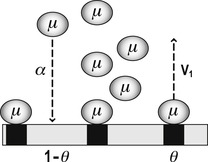 |
At equilibrium, the fractional amount diffusing toward the receptor is equal to the fractional amount diffusing away from the receptor:
Rearranging to isolate θμ, the fraction of chemical bound to the surface yields:
Pharmacologists and biochemists define the fraction of biological target bound by a chemical (denoted A) as ρA and α as k1 (a rate of association with the target), V1 as k2 (rate of dissociation from the target) and combine k1 and k2 into an equilibrium dissociation constant denoted Keq (Keq=k2/k1).
(2.1)
When the concentration of the drug is equal to Keq, then ρ=0.5, i.e., the Keq is the concentration of drug that occupies 50% of the available receptor population. Therefore, the magnitude of Keq is inversely proportional to the affinity of the drug for the receptor. For example, consider two drugs one with Keq=10−9M and another with Keq=10−7M. The first drug occupies 50% of the receptors at a concentration 1/100 of that required by the second. Clearly the drug with Keq=10−9 has a higher affinity for the receptor than the one with Keq=10−7M.
It can be seen from equation 2.1 that, for a ligand with Keq of 10−7M (100nM), the fraction of sites bound can be calculated for any concentration (for example, 30nM would occupy (30nM)/(30nM+100nm)=23% of the sites). In fact, equation 2.1 enables the calculation of a complete binding curve. Experimentally, if the binding of a series of concentrations can be measured, then a relationship between concentration and percent bound can be determined (Fig. 2.2). As is the case with dose–response curves, these curves are best described using a semi-logarithmic format (see Fig. 2.2). Assuming that a direct measure of the amount of bound ligand can be made (for instance, if the ligand is radioactive and the quantity of radioactive–ligand complex could be quantified), then Keq can be measured directly; this can be accomplished with saturation binding experiments with radioactive ligands.
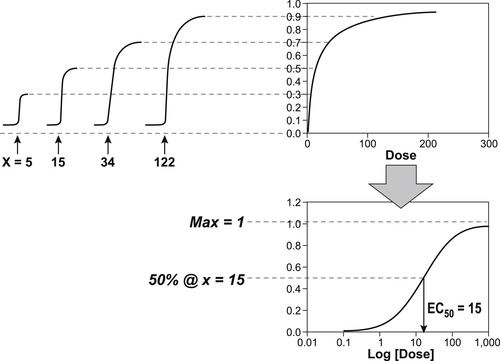 |
Figure 2.2 Stay updated, free articles. Join our Telegram channel
Full access? Get Clinical Tree
 Get Clinical Tree app for offline access

|