The basic concept of drug-receptor (receptor is used loosely to mean the binding target) interaction can be described by the lock-and-key model, where the structure of drug molecule influences the binding to a receptor. The affinity (the tendency of binding) of a drug for a receptor is determined by the fitting and the number of bonds formed between them. In general, the more fitted the “key and lock” feature and the number of bonds formed, the stronger the attractive forces and the binding between them. Drug-receptor binding as such is needed for drug action that produces a stimulatory or inhibitory effect as the drug response.
A few drugs act by physicochemical mechanism without the involvement of receptor. These include drugs like desferrioxamine (a chelating agent) in heavy metal poisoning, aluminium hydroxide (an antacid) to neutralize gastric acid, and mannitol (an osmotic diuretic) in treating cerebral edema.
Relationship Between Drug Response and Drug Concentration
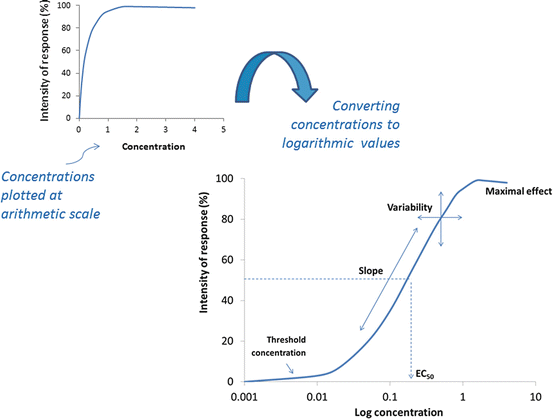
The effect of a drug is dependent on the concentration of the drug at the target site (receptor), where drug-receptor binding is in equilibrium. The drug concentrations, in turn, depend on pharmacokinetic and dosing factors. Generally, the intensity of response increases with drug concentrations. The response can be plotted against drug concentration, yielding a hyperbolic curve that illustrates a sharp increment in effect that diminishes toward a plateau (maximal effect) while drug concentration increases (Fig. 7.1). Using this plot, unfortunately, we would not be able to visualize and appreciate the range of doses over which a linear relationship between dose and response is generated. When doses (x-axis) are converted from arithmetic to logarithmic scale, the plotted log dose–response curve will change to a sigmoidal curve where the important linear slope (25–75 % of the maximum) becomes visible for further characterization (Fig. 7.1). Therapeutic concentrations usually range along the linear portion of the curve; doses lower than the range (near threshold dose) can be sub-therapeutic, while toxic effects are likely to occur with higher doses (near the maximal effect).


Fig. 7.1
This is a representative log concentration-effect curve, illustrating its four characteristic variables. The effect is measured as a function of increasing drug concentration surrounding the target receptor inferred from plasma drug concentration. Note that the data plotted in arithmetic scale produces a hyperbolic curve instead. EC 50 = effective dose at half maximal response, as an indicator of potency especially useful when comparing different agonists for the same receptor. Similar relationship can be plotted as the function of the dose of drug administered, and referred to as dose-response curve, assuming that the doses administered and plasma drug concentrations remain in equilibrium
Drug–Receptor Interaction: Agonism and Antagonism
Agonist
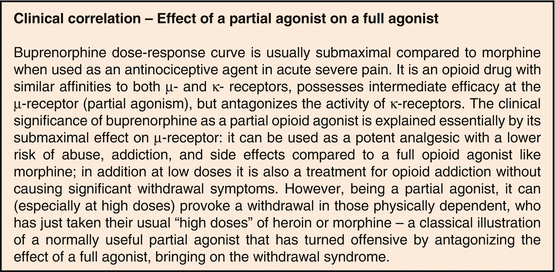
This refers to a drug that binds to a receptor eliciting its response. If the response elicited is maximal, the drug is said to be a full agonist with intrinsic efficacy of 1. A partial agonist is one that elicits submaximal response and possesses intrinsic efficacy between 0-1. An example of a full agonist for μ-receptor is the narcotic morphine, which antinociceptive and euphoric effect (referred to as maximum) can only be achieved at a lesser degree by buprenorphine, a partial agonist. The interaction of the two opioids is described in the clinical correlation.


