Supplemental Topics
Distribution Kinetics
OBJECTIVES
The reader will be able to:
- State why the one-compartment model is sometimes inadequate to describe kinetic events within the body.
- Compare the sum of two exponentials with the compartment model for representing plasma concentration data showing distribution kinetics.
- Estimate clearance and the half-life of the phase associated with most of elimination given plasma concentration–time data of a drug showing distribution kinetics.
- Define and estimate the distribution parameters: initial dilution volume (V1), volume during the terminal phase (V), and volume of distribution at steady state (Vss).
- Describe the impact of distribution kinetics on the interpretation of plasma concentration–time data following administration of a single dose.
- Explain the influence of distribution kinetics and duration of administration on the time courses of concentration in plasma and amount in tissue during and after stopping a constant-rate infusion.
- Describe how distribution kinetics influences the fluctuations of plasma and tissue levels with time during a multiple-dose regimen.
- Describe how distribution kinetics impacts the design of an oral multiple-dose regimen, when the effect wears off during the distribution phase of the drug.
- Explain how distribution kinetics can influence the interpretation of plasma concentration–time data and terminal half-life when clearance is altered.
- Describe the influence of distribution kinetics on the relationship between onset, duration, and intensity of response with time following single and multiple doses.
 ortraying the body as a single compartment is appropriate for establishing the fundamental principles of pharmacokinetics but is an inaccurate representation of events that follow drug administration. A basic assumption of the concept of a one-compartment representation of distribution is that equilibration of drug between tissues and blood occurs spontaneously. In reality, distribution takes time. The time required depends on tissue perfusion, permeability characteristics of tissue membranes for drug, and its partitioning between tissues and blood (Chapter 4, Membranes and Distribution). Ignoring distribution kinetics is reasonable as long as the error incurred is acceptable. This error becomes unacceptable when the one-compartment representation fails to explain adequately observations following drug administration; there is a danger of significant misinterpretation of the observations; and major discrepancies occur in the calculation of drug dosage. Such situations are most likely to arise when either substantial amounts are eliminated or response wears off before distribution equilibrium is achieved. This chapter deals with the pharmacokinetic consequence of distribution kinetics together with some aspects of pharmacodynamics not covered elsewhere in the book.
EVIDENCE OF DISTRIBUTION KINETICS
Evidence of distribution kinetics is usually inferred from an early rapid decline in plasma (blood) concentration following an intravenous (i.v.) bolus dose, when little drug has been eliminated, and from the rapid onset and decline in the pharmacologic effect of some drugs during this early phase. Data in Fig. 19-1 (same as Fig. 4-11, repeated here in the context of distribution kinetics), which show the concentration of thiopental in various tissues after an i.v. bolus dose of this preoperative general anesthetic to a dog, provide direct evidence of distribution kinetics. Thiopental is a small, highly lipid-soluble drug for which distribution into essentially all tissues is perfusion rate-limited. The results seen with this drug are therefore typical of those observed with many other small lipophilic drugs.
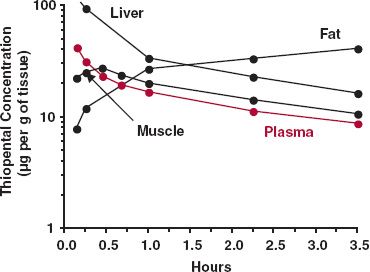
FIGURE 19-1. Semilogarithmic plot of the concentration of thiopental in various tissues (black lines) and plasma (colored line) following an i.v. bolus dose of 25 mg/kg to a dog. Note the early rise and fall of thiopental in the well-perfused tissues (e.g., liver) and in lean muscle tissue. After 3 hr, much of the drug remaining in the body is in adipose tissue. (From: Brodie BB, Bernstein E, Mark L. The role of body fat in limiting the duration of action of thiopental. J Pharmacol Exp Ther 1952;105:421–426.)
Notice that thiopental in liver, a highly perfused organ, reaches distribution equilibrium with that in plasma by 5 min (the first observation), and thereafter, the decline in liver parallels with that in plasma. The same holds true in other highly perfused tissues, including brain and kidneys.
Redistribution of thiopental from well-perfused tissues to less well-perfused tissues, such as muscle and fat, primarily accounts for the subsequent decline in plasma concentration over the next 3 hr; less than 20% of the dose is eliminated during this period. As a result of a combination of poor perfusion and high partitioning, even by 3 hr distribution equilibrium in adipose tissue has not been established. Analysis of the situation indicates that this does not occur for several more hours, at which time the majority of thiopental remaining is in fat. Recall that the greater the partition of a drug into fat, or into any tissue, the longer is the time required to achieve distribution equilibrium (Chapter 4, Membranes and Distribution). However, only if the apparent volume of distribution of a tissue (Kp · VT) is a major fraction of the total volume of distribution does up-take into that tissue substantially affect events within plasma. With thiopental, which has an adipose-to-plasma partition coefficient of 10, fat (0.12 L/kg) constitutes approximately 40% of the total (apparent) volume of distribution (2.3 L/kg). Accordingly, the plasma concentration of thiopental not only falls markedly, but distribution takes many hours. For other drugs, distribution throughout the body may be faster or even take longer if partitioning into tissues is much less or more extensive than for thiopental. Certain aspects of distribution kinetics have been discussed in Chapter 4, Membranes and Distribution, Chapter 5, Elimination, and Chapter 10, Constant-Rate Input. What follows is a quantitative consideration starting with events following a single dose and finishing with events following infusion and multiple doses.
INTRAVENOUS BOLUS DOSE
PRESENTATION OF DATA
Sum of Exponential Terms. The early rapid and subsequent slower decline in the plasma concentration of aspirin in an individual subject following a 650-mg i.v. bolus dose (Fig. 19-2) is typical of many drugs. Had no samples been taken during the first 20 min, the terminal linear decline of the plasma concentration when plotted on semi-logarithmic graph paper would have been characterized by a monoexponential equation, and one-compartment disposition characteristics would have been applied to aspirin. Recall that the monoexponential equation is C(0)e−k·t, where k is the rate constant with an associated half-life, given by 0.693/k, and C(0) is the anticipated initial plasma drug concentration, given as the intercept on the plasma concentration axis when the line is extrapolated back to time zero. For aspirin, k is 0.050 min−1, the corresponding half-life is 14 min, and C(0) is 33 mg/L. Going further, the volume of distribution (C[0]) is 20 L and clearance (k · V) is 0.98 L/min.
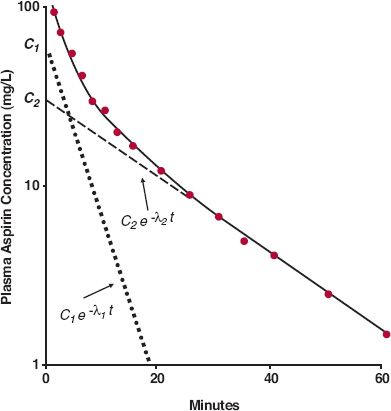
FIGURE 19-2. When displayed semilogarithmically, the fall in the plasma concentration of aspirin is initially rapid but then slows after an i.v. bolus dose of 650 mg to a subject. The decline in concentration (——) can be characterized by the sum of two exponential terms: C1 · e−λ1 · t ( ) and C2 · e−λ2 · t(– – –). (From: Rowland M, Riegelman S. Pharmacokinetics of acetylsalicylic acid and salicylic acid after intravenous administration in man. J Pharm Sci 1968;57: 1313–1319.)
Notice that the early plasma concentrations are higher than those anticipated by back extrapolation of the terminal slope and that the earlier the time, the greater is the difference. When the difference at each sample time is plotted on the same graph, all the difference values fall on another straight line, which can be characterized by a monoexponential equation, B(0)e− α ·t, where · is the decay rate constant and B(0) is the corresponding zero-time intercept. For aspirin, α = 0.23 min−1, t1/2 = 3.0 min, and B(0) = 67 mg/L.
Because all the plasma concentrations at the later times can be fitted by one equation, C(0)e−k·t, and because at the earlier times, all the difference values can be fitted by another equation, B(0)e−α·t, it follows that the entire plasma drug concentration (C) versus time data can be fitted by the sum of these two exponential terms. That is
For example, the biexponential equation C = 67e−0.23t + 33e−0.050t, for which t is time in minutes and B(0) and C(0) are in mg/L, adequately describes the decline in the plasma aspirin concentration following a 650-mg bolus dose. Sometimes, when using this difference procedure, known commonly as the method of residuals, a sum of three and occasionally four exponential terms is required to fit adequately the observed concentration–time data. Because the principles in approaching such data are the same as those used to analyze and interpret events described by a biexponential equation, only the simpler case is considered further in this book.
To facilitate the discussion, a more uniform set of symbols is needed. Rather than using the different symbols αand k, the general symbol λ is used to denote the exponential coefficient. Thus, Eq. 19-1 can be rewritten as
where the subscripts 1 and 2 refer to the first and second exponential terms respectively, and C1 and C2 refer to the corresponding zero-time intercepts, or coefficients. By convention, the exponential terms are arranged in decreasing order of λ. For example, in the case of aspirin, C1 = 67 mg/L, λ1 = 0.23 min−1, C2 = 33 mg/L, and λ2 = 0.050 min−1.
With aspirin, two exponential terms and hence two phases are seen when plasma concentration–time data are displayed on a semilogarithmic plot. Commonly, the last phase is called the terminal phase. With aspirin and many other drugs, it is a correct description. Sometimes, however, there is an additional, still slower phase, indicating that distribution equilibrium has not been achieved with all tissues. The terminal phase may sometimes be missed, because the assay procedure employed insufficiently sensitive to measure the drug concentration at these later times. This certainly was the case with aminoglycosides and some other drugs in the past, although it is less of a problem today with the availability of more sensitive instrumentation. In the subsequent discussion, the observed terminal phase is assumed to be correctly designated.
At time zero the anticipated plasma concentration is, by reference to Eq. 19-2, equal to the sum of the coefficients, C1 + C2. At that time, the amount in the body is the dose. Hence, by definition, the volume into which drug appears to distribute initially, the initial dilution volume, V1, is given by
For aspirin, the anticipated initial concentration is 100 (= 67 + 33) mg/L, so that the initial dilution volume of aspirin is 6.5 L.
It is important to realize that the time for concentration to fall by one half is only equal to a half-life during the terminal phase. Before then, the plasma concentration falls in half in a period of less than one terminal half-life but more than one initial half-life. This is clearly evident on comparing the fall in plasma aspirin concentration in the earlier moments with the decline of the first exponential term.
A Compartmental Model. Although for many situations in pharmacokinetics the desired information can be obtained directly from modification of Eq. 19-2, it is sometimes conceptually helpful to represent disposition pictorially, as was done in Chapter 3, Kinetics Following an Intravenous Bolus Dose, and Chapter 10, Constant-Rate Input, to explain some events following bolus doses and infusions. One such common representation, depicted in Fig. 19-3, is the two-compartment model. Compartment 1, the initial dilution volume mentioned previously, is also frequently called the central compartment because drug is administered into and distributed from it. As mentioned, the initial dilution volume of aspirin is 6.5 L; for many other drugs, particularly basic compounds, it is much larger. These values are clearly greater than the plasma volume, 3 L, and therefore this initial dilution volume must be composed of spaces in addition to plasma into which drug distributes extremely rapidly. These spaces must be in well-perfused tissues, such as the lungs and generally liver and kidneys, the major eliminating organs. Elimination is therefore usually depicted as occurring directly and exclusively from the central compartment. Drug distributes between this central compartment and a peripheral compartment, made up of tissues into which drug distributes more slowly.
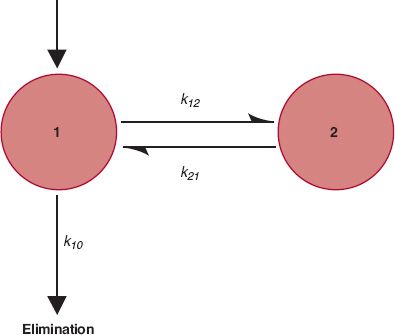
FIGURE 19-3. A two-compartment model of the body. Drug is administered into and eliminated from compartment 1 and distributes between compartments 1 and 2. The rate constants for the processes are indicated.
Several points are worth mentioning here. First, the model is defined by the data. The number of compartments or pools required equals the number of exponential terms needed to describe the plasma concentration–time data. Thus, a three-compartment model is needed when the data are best fitted by a triexponential equation. Next, the model depicted in Fig. 19-3, or any other model for which drug elimination is portrayed as occurring exclusively from the central compartment, is not unique. Three two-compartment models can adequately describe a biexponential plasma concentration decay curve: the one depicted in Fig. 19-3, one with elimination occurring from both compartments, and one with loss occurring exclusively from the peripheral compartment. No distinction between these three possibilities can be made from plasma concentration–time data alone, and although the model depicted in Fig. 19-3 is the most favored one, based on physiologic considerations such as the initial dilution volume exceeding the plasma volume, elimination can sometimes occur in tissues of the peripheral compartment. Sometimes, the liver (or kidneys) is not part of the central compartment. For example, the initial dilution volume of many very large protein drugs is only 3 L, the plasma volume (see Chapter 21, Protein Drugs). Last, drug distribution within a compartment is not homogenous. Although the concentrations of drug within and among such tissues usually vary enormously, tissues are lumped together into a compartment because the times to achieve distribution equilibrium in each tissue are similar.
In Fig. 19-3, movement of drug between compartments can be characterized by transfer rate constants, where k12 denotes the rate constant associated with movement of drug from compartment 1 to compartment 2, and k21 is the rate constant associated with the reverse process. The rate constant k10, associated with elimination, is related to clearance (k10 = CL/V1), and can be further partitioned into a renal (k1e) and nonrenal component. The unit of all rate constants is reciprocal time.
Rate equations can be written for movement of amounts between the compartments and for drug elimination. Following an i.v. bolus dose these equations are:
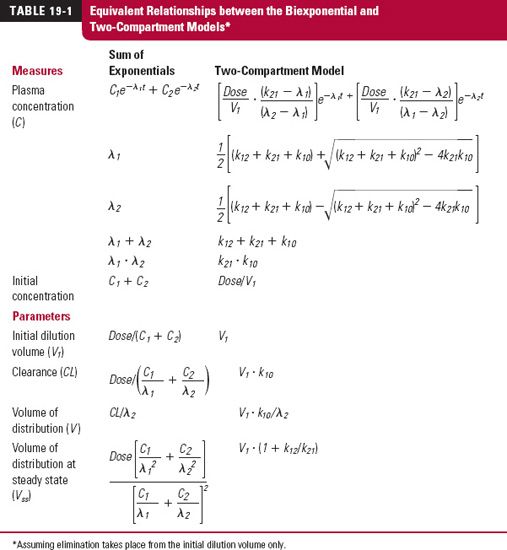
where A1 and A2 are the amounts of drug in compartments 1 and 2, respectively. Integration of these rate equations provides a biexponential equation, of the same form as Eq. 19-2, for the decline of drug from plasma, except that the coefficients and exponents are recast in terms of the parameters defining the compartmental model. Equivalent relationships between the biexponential and two-compartment models are listed in Table 19-1.
Although expressing data in terms of a compartmental model and associated parameters may appear to give greater insight into the data, caution should be exercised in doing so. Remember that the compartmental model chosen is often not unique, and one can rarely assign a physical or physiologic meaning to the value of any of the rate constants. Accordingly, much of the subsequent discussion is related to describing drug disposition by the sum of exponentials. However, pharmacokinetic observations are discussed in terms of the compartmental model when this procedure facilitates general understanding. It is also useful when assigning variability within the population of a pharmacokinetic parameter, such as renal clearance (k2e · V2 within the compartmental model), to say renal function. Recall, these two are directly related (as discussed in Chapter 15, Disease). In contrast as can be seen from the interrelationships in Table 19-1, a change in renal clearance and hence clearance (V1 · k10) impacts on all the parameters of a biexponential equation making it is virtually impossible to correlate renal function with these parameters. Lastly, when describing nonlinear pharmacokinetics, the use of exponential equations (which assume linearity) is inappropriate. Here, compartmental models are the appropriate choice, in which any parameter of the model can be expressed as a nonlinear function of the concentration or amount of drug in the associated compartment, such as clearance expressed as a function of plasma concentration using the full Michaelis-Menten equation. Recall also that pharmacodynamics is generally nonlinear, so compartment models are frequently applied to such data.
PHARMACOKINETIC PARAMETERS
Clearance. Elimination occurs at all times. Just as plasma concentration is highest immediately following an i.v. bolus dose, so is rate of elimination (CL · C). Subsequently, both plasma concentration and corresponding rate of elimination fall rapidly. To calculate the amount eliminated in a small unit of time, dt, recall that
where C · dt is the corresponding small area under the plasma concentration–time curve within the interval dt. The total amount eliminated, the dose administered, is the sum of all the small amounts eliminated from time zero to time infinity.
where AUC is the total area under the plasma drug concentration–time curve. Accordingly, as with the simpler one-compartment model, clearance (CL) is most readily estimated by dividing dose by AUC. The area may be determined from the trapezoidal rule (Appendix A, Assessment of AUC) or, more conveniently, by realizing that the total area underlying each exponential term is the zero-time intercept divided by its corresponding exponential coefficient. Thus, the total area corresponding to Eq. 19-2 is given by
When inserting the appropriate values for the aspirin example into Eq. 19-8, the value of AUC associated with the 650-mg dose is 951 mg-min/L, so that the total clearance of aspirin in the individual is 683 mL/min. Notice that clearance is considerably smaller than the value calculated assuming a one-compartment model, 985 mL/min. The latter is an overestimate of the true value, because more drug is eliminated during the attainment of distribution equilibrium than accounted for by the last term. If instead of the first phase a later phase is missed, the error in estimating clearance is large only if the missed area is a major fraction of the total area. Obviously, given the ease of estimating total area and provided that blood sampling times are adequate, the true value for clearance should always be calculated.
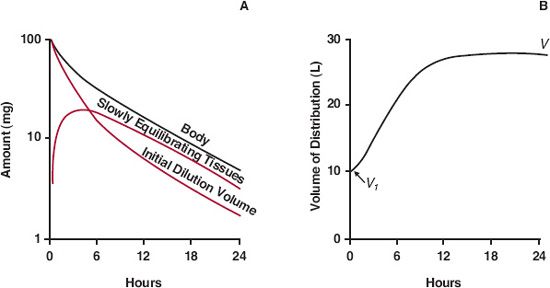
Volume of Distribution. One purpose of a volume term is to relate plasma concentration to amount in the body. The initial dilution volume fulfills this purpose initially. Subsequently, however, as drug distributes into the slowly equilibrating tissues, the plasma concentration declines more rapidly than does the amount in the body (A). Accordingly, as illustrated in Fig. 19-4, the effective volume of distribution (A/C) increases with time until distribution equilibrium between drug in plasma and all tissues is achieved; this occurs during the terminal phase. Only then does decline in all tissues parallel that in plasma and is proportionality between plasma concentration and amount in body achieved.
FIGURE 19-4. Several events occur following a single i.v. bolus dose. A. Loss of drug from the initial dilution volume, of which plasma is a part, is a result of both elimination from the body and distribution into the more slowly equilibrating tissues. The fall in amount of drug in the body is therefore initially less than the fall in the amount in the initial dilution volume. Only when distribution equilibrium has been achieved do the amounts in the initial dilution volume and in plasma decline in parallel (same slope) with that in the body. B. Reflecting these events, the apparent volume of distribution (A/C), which just after giving the dose equals the initial dilution volume (V1), increases with time approaching a limiting value (V), which occurs when distribution equilibrium is achieved.
The volume of distribution during the terminal phase (V) can be calculated as follows. During this phase, the concentration is given by C2 · e−λ2 ·t (see Fig. 19-2), and correspondingly,
Hence, extrapolating back to time zero, V · C2 must be the amount needed to give a plasma concentration of C2, had drug spontaneously distributed into the volume, V. The amount, V · C2, remains to be calculated. When placed into the body, the amount, V · C2, is eventually matched by an equal amount eliminated. As the amount remaining to be eliminated is the product of clearance and area, and as C2 /λ2 is the associated area, it follows that
or
Returning to the example of aspirin, CL = 683 mL/min and λ2 = 0.050 min−1; therefore, its volume of distribution is 13.7 L. That is, if during the terminal phase the plasma concentration is 10 mg/L, then the amount in the body is 137 mg. Because 65 mg (10 mg/L × 6.5 L) are in the initial dilution volume, the remaining 71 mg must be in the tissues with which aspirin slowly equilibrates.
A comparison of Eq. 19-11 with the one that has been used in all previous chapters to define the volume of distribution (V = CL/k) shows them to be the same, recognizing the equivalence of k and λ2, the terminal exponential coefficient.
The ratio V1/V gives an estimate of the degree of error in predicting the initial plasma concentration using a one-compartment model. For example, for aspirin, with values for V1and V of 6.5 and 13.7 L, respectively, the error in predicting initial concentrations from the plasma concentration–time data during the terminal phase can be relatively large. The error can be even larger when predicting conditions beyond the measured final phase if a still slower one exists. This last error is only of concern if there is an appreciable accumulation of drug in this phase during chronic administration, a point considered subsequently in this chapter.
DISTRIBUTION KINETICS AND ELIMINATION
During the initial rapidly declining phase, more elimination occurs than would have been expected had distribution been spontaneous. Additional elimination is a result of the particularly high concentrations of drug presented to organs of elimination during this period. For many drugs this increased elimination is small, and, with respect to elimination, viewing the body as a single compartment is adequate. For other drugs, the additional elimination represents a major fraction of the administered dose, and approximating the kinetics with a one-compartment model is inappropriate. Area considerations are a basis for making this decision.
Recall from Eq. 19-9 that elimination associated with the concentrations defined by the terminal exponential term, C2 · e−λ2·t, gives an amount equal to CL · C2/ λ2. Expressing this amount as a fraction, f2, of the administered dose and utilizing the relationship in Eq. 19-8 gives
The remaining fraction, f1, must therefore have been eliminated as a result of concentrations above those expected had spontaneous distribution occurred (i.e., those concentrations defined by C1 · e−λ1·t).
Applying Eq. 19-12 to the case of aspirin, elimination of 69% of the dose is associated with the terminal slope; therefore, the remaining 31% must be associated with plasma concentrations above those expected had spontaneous distribution occurred. Although distribution kinetics cannot be ignored, the majority of aspirin elimination is clearly associated with events defined by the terminal phase, which has a half-life of 14 min. Based on the same reason, the terminal half-life is the elimination half-life for most drugs. This is because distribution is much faster than elimination. There are some drugs, however, for which the calculated value of f2 is low because elimination is much faster than distribution. Gentamicin is an example. As mentioned in Chapter 3, Kinetics Following an Intravenous Bolus Dose, over 98% of an i.v. bolus dose is eliminated before distribution equilibrium within the body has been achieved. In this case, the reason lies in a permeability-limited distribution of gentamicin into certain tissues. Clearly, for gentamicin and similar drugs, the appropriate half-life (biexponential model) defining elimination after a bolus dose is 0.693/λ1.
A MATHEMATICAL AID
For all but the mathematically inclined, analysis and prediction of plasma concentration–time data for a drug that displays multiexponential disposition characteristics are difficult. A useful mathematical aid to facilitate such analyses and predictions is to imagine that each exponential term arises from the independent administration of a different drug having one-compartment characteristics, and that the sum of their individual concentrations is the observed one. For example, imagine that a biexponential equation, C = C1e−λ1·t + C2e−λ2·t, arises from administration of two hypothetical drugs, Drug 1 and Drug 2; Drug 1 produces the curve C1e−λ1·t, and Drug 2 produces the curve C2e−λ2 ·t. Furthermore, assume that each hypothetical drug has the same clearance, CL. Therefore, because the two drugs have different rate constants, λ1 and λ2, they have different volumes of distribution, which are given by CL/λ1 and CL/λ2, respectively. To complete the analysis, the doses of the hypothetical drugs are needed. These are obtained from area considerations as follows. Because dose is the product of clearance and area, the respective doses are CL · (C1/λ1) and CL · (C2/λ2). Furthermore, because CL · (C1/λ1 + C2/λ2) equals the total dose administered, it follows from Eq. 19-12 that f1 · Dose and f2 Dose are the corresponding doses. Hence, the total observed concentration is given by
Although the above equation is a device that cannot, for example, predict events in slowly equilibrating tissues, it readily permits calculation of events in plasma under various circumstances, as subsequently shown.
AN EXTRAVASCULAR DOSE
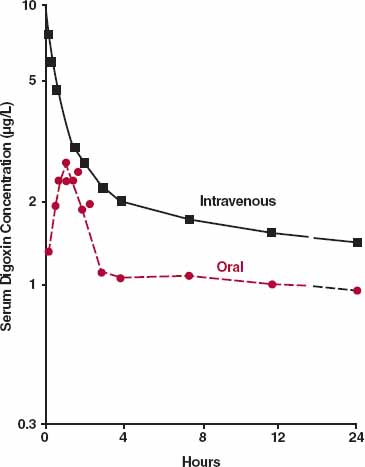
Often, absorption is slower than distribution, so approximating the body as a single compartment after an extravascular dose is reasonable. Occasionally, it is not, as illustrated with digoxin in Fig. 19-5. Following oral administration, digoxin is absorbed before much distribution has occurred, and consequently, the distribution phase is still evident beyond the peak concentration. The therapeutic implication of this observation is discussed in Chapter 8, Response Following a Single Dose. In contrast to digoxin, many drugs equilibrate rapidly with highly perfused tissues such as heart and brain; then, plasma concentration correlates positively with response at all but the earliest times.
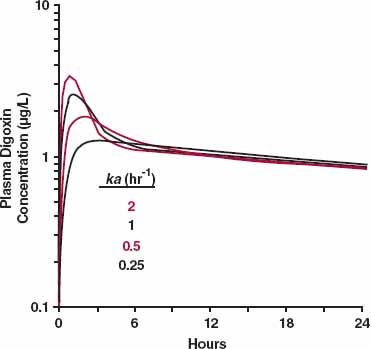
The distribution phase tends to disappear when the absorption process is slower than distribution. This principle is demonstrated by the simulation in Fig. 19-6 for digoxin. The drug is given orally, and systemic absorption is assumed to be first order. The figure contains a model that incorporates first-order absorption and disposition (two-compartment model) that applies to an i.v. bolus. Several values for the absorption rate constant are simulated. Note that the distribution nose (Fig. 19-6) is almost gone when the absorption rate constant is about 0.5 hr−1(half-life = 1.4 hr), a slower rate of absorption than is typically observed for immediate-release digoxin tablets. Also, note that the terminal half-life does not increase with ka, because absorption never becomes rate-limiting (terminal half-life is 44 hr). The effect of slowing absorption becomes even more apparent when the concentration is plotted on a linear scale with time.
FIGURE 19-5. Depicted is a semi-logarithmic plot of the mean concentration of digoxin following 0.5 mg administered orally (two 0.25-mg tablets, colored circles) and i.v. (black squares) to four volunteers. Because absorption is much faster than distribution, a biphasic curve is still seen after attainment of the peak concentration following the oral dose. (From: Huffman DH, Azarnoff D. Absorption of orally given digoxin preparations. JAMA 1972;222:957–960. Copyright 1972, American Medical Association.)
FIGURE 19-6. A simulation of the effect of the speed of absorption on the concentration–time profile of digoxin. A distribution nose is observed for digoxin (Fig. 19-5) with the conventional dosage form, because its absorption is relatively fast compared with the distribution and elimination of the compound. A two-compartment model of digoxin disposition with first-order absorption, as shown, is used in the simulation. Note that when the absorption rate constant is sufficiently small (about 0.5 hr−1 for this drug), the distribution nose disappears. The values of the absorption rate constants are given in the legend.
As with the simple one-compartment model, as long as rate of elimination = CL · C bioavailability is given by F = CL · AUC/Dose, and relative bioavailability is estimated by comparison of AUC values following various formulations or routes of administration, correcting for dose differences.
CONSTANT-RATE INFUSION
SHORT-TERM INFUSION
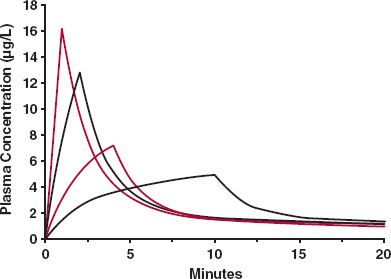
Midazolam is an effective i.v. sedative. However, if it is administered too rapidly, there is a significant risk of severe centrally mediated respiratory depression and respiratory arrest, associated with the very high arterial and hence brain concentrations for this highly permeable drug in the early moments, before much drug has had time to distribute to the less well-perfused tissues. The solution is to deliver the dose as a short-term constant-rate infusion, rather than as a distinct bolus, thereby lowering the Cmax. How substantial the lowering of the Cmax, and hence risk, can be even with only a modest extension in the duration of administration is demonstrated in Fig. 19-7 for a drug with pharmacokinetics similar to that of midazolam. Thus, for the same total dose (2 mg), the Cmax is decreased from 16 μg/L to 4 μg/L when the duration of infusion is extended from 1 to 10 min, during which time the fraction of the administered eliminated from the body is minimal, and seen by all the curves converging to a common concentration by 20 min since the start of the infusion, so that essentially one may consider that a bolus dose is in the body at the end of the infusion.
FIGURE 19-7. Even when the desire is for rapid onset of effect, it is safer to administer a drug by short-term infusion than as an i.v. bolus. Shown are changes in the duration of infusion, for the same total dose (2 mg), on Cmax. Notice, just modest changes in the duration, from 1 to 10 min, profoundly lowers the Cmax and potential risk. During this period, little drug is lost from the body, evident by the concentrations associated with each curve converging to a common value by 20 min since the start of the infusion. Data are for a drug with disposition kinetics similar to that of midazolam.
This practice of giving a short-term infusion during the distribution phase of a drug is the norm when the intention is to give a bolus dose, because this minimizes risk while still achieving effective systemic concentrations of a drug with only a minor delay in the onset of action.
LONG-TERM INFUSION
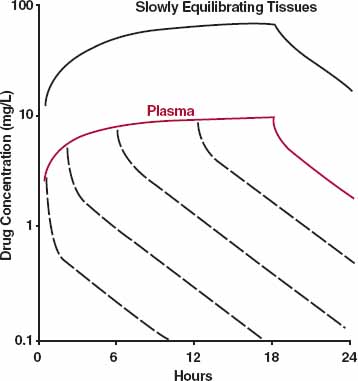
Some drugs are infused long term relative to the pharmacokinetics of the drug, with the intention of achieving and maintaining a constant plasma concentration, and hence therapeutic effect, for a given period of time. The case of propofol was considered in Chapter 10, Constant-Rate Regimens. Fig. 19-8 illustrates the anticipated effect of distribution kinetics on the plasma concentration, for a drug in general, on stopping a constant-rate infusion at various times during approach to plateau. At early times, a pronounced distribution phase is seen on stopping an infusion, because distribution equilibrium has yet to be achieved between drug in blood and that in many tissues. With a more prolonged infusion, more drug enters the tissues. The tendency of drug to move from blood to tissues is then much reduced, and the distribution phase appears much shallower on stopping the infusion. Even at plateau, however, some distribution may still be seen on stopping the infusion. At plateau, the rates of drug entry in and out of the tissues are equal. On stopping the infusion, elimination of drug from plasma, along with the fall in plasma concentration, creates a gradient for return of drug from tissues. Initially, the rate of elimination from plasma exceeds the rate of return from the tissues, and the plasma concentration falls rapidly. Eventually, however, the rate of return from the tissues limits the rate of elimination from plasma. The body then acts, once again, as a single compartment; plasma concentration and amount in the tissues, and hence amount in the body as a whole, fall with a half-life equal to that seen during the terminal phase following an i.v. bolus dose.
FIGURE 19-8. Events in plasma (colored line) and in slowly equilibrating tissues (top curve) during and after stopping a constant-rate 18-hr infusion. As concentration in the slowly equilibrating tissues rises during the infusion, the net tendency of drug to enter these tissues decreases. Consequently, on stopping the infusion, the distribution phase in plasma (– – –) appears shallower the more prolonged the infusion. For simplicity, only the decline in tissue concentration when the infusion is stopped at plateau is shown. Equation 19-27 describes the plasma concentration during an infusion. At the end of an infusion of duration τ, the concentration, C (τ), is therefore Css · (f1 · (1 − e−λ1 ·τ) + f2 · (1 − e−λ2 · τ)). Furthermore, on stopping the infusion, the plasma concentration is given by Css · (f1 · (1 − e−λ1 · τ). e−λ·tpost + f2 · (1 − e−λ2 ·τ) · e−λ2·τpost), where tpostis the time after stopping the infusion. The last equation can be derived using the mathematical aid (Eq. 19-13), recognizing, for example, that (f1 · Css · (1 − e−λ1 · τ) is the concentration at the end of the infusion associated with the first phase, and e−λ1 ·tpost is the corresponding fraction remaining at time tpost.
Stay updated, free articles. Join our Telegram channel

Full access? Get Clinical Tree


