- what is meant by diagnosis;
- to understand the need for evidence-based diagnosis;
- to define and calculate measures of accuracy;
- to recognise potential biases in diagnostic test accuracy studies;
- to decide if the results will be clinically useful for future patient management.
What is diagnosis?
When a patient develops a new set of symptoms he/she generally wants to know ‘What is wrong with me?’ Making an accurate diagnosis is essential to ensure that a patient receives appropriate treatment and correct information regarding their prognosis. There are also other less tangible effects of an accurate diagnosis, including relief and reassurance if the diagnosis is mild, and the start of the process of coming to terms with the condition if a more severe diagnosis is made. For example, in the area of multiple sclerosis, there is some evidence that patients benefit emotionally from receiving an early diagnosis (Koopman and Schweitzer, 1999; Mushlin et al., 1994).
What is a diagnostic test?
Tests are defined very broadly to include any procedure, or test, that tries to confirm or identify the presence or absence of a target condition. This includes what we traditionally think of as tests, for example, biochemical measurements, imaging, but also taking a patient’s history, doing a physical examination and administering questionnaires. Tests are ordered for a variety of reason (a) detection/exclusion of disease (to rule in or rule out a potential diagnosis), (b) screening, (c) to make decisions regarding treatment and/or prognosis e.g. an angiogram will confirm diagnosis of heart disease but may also help decide if surgical intervention is required, (d) patient reassurance, (e) following a protocol, (f) medico-legal or financial reasons. Sometimes it is easier to order a test than think about why we are doing it but inappropriate testing can lead to a waste of money that could be better used elsewhere, pain and discomfort and wasted time for patients, possible distress and anxiety as a result of a false positive test, and wrongly reassured patients with false negative tests.
Why study evidence-based diagnosis?
New diagnostic tests may be introduced into practice if they
Before introducing a new test into clinical practice we need to evaluate it to determine whether it works: i.e. does it distinguish patients with and without the disease and does it benefit the patient? Diagnostic research can be considered to follow the following stages:
- Stage I – development
Do patients with the target condition have different results from ‘normal’ individuals? Is it safe?
- Stage II – testing
In an appropriate group (spectrum) of patients, does the test accurately distinguish between those with and without the target condition?
- Stage III – clinical effectiveness
Do patients who undergo the test have better health outcomes than similar patients who do not?
Evaluating test accuracy
Classical diagnostic test accuracy studies compare the results of the test of interest, the index test, to those of a reference standard (also referred to as gold standard), which should be the best available method of determining disease status. Imagine you see a patient with a possible diagnosis of rheumatoid arthritis (RA) but are not sufficiently confident to make the diagnosis based on their clinical features alone. You decided to find out whether there are any studies reporting on new diagnostic tests for RA. You search PubMed (http://www.ncbi.nlm.nih.gov/pubmed) using the term ‘rheumatoid arthritis’ combined with PubMed’s inbuilt clinical query for diagnosis studies (see ‘Finding evidence on diagnostic accuracy studies’, p. 82, below). You identify a study that evaluated the accuracy of anti-cyclic citrullinated peptide (anti-CCP) antibodies for making an early diagnosis of RA (van Gaalen et al., 2005) and are considering ordering this test to help with the diagnosis.
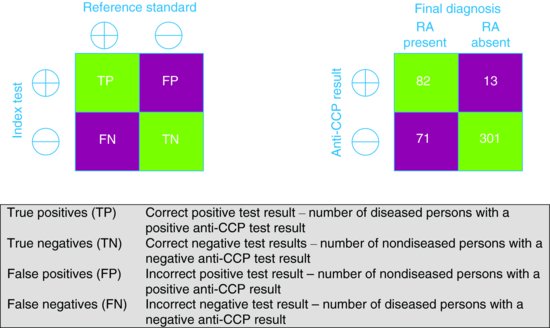
The results of the anti-CCP test (index test) are compared to the results of the American College of Rheumatology (ACR) criteria after a period of follow-up (reference standard) and the results are cross-tabulated to produce a 2 × 2 table of results (Figure 9.1). Based on this, estimates of the accuracy of the anti-CCP test can be calculated. These can be expressed as statistics such as sensitivity, specificity, predictive values and likelihood ratios.
Figure 9.1 2 × 2 tables showing the cross-classification of index test and reference standard results. (a) General table. (b) Table based on example of anti-CCP for diagnosing RA.
Sensitivity and specificity
Sensitivity refers to the proportion of those with the condition who have a positive test result (better sensitivity lower percentage with false negative rate). Specificity refers to the proportion of those without the condition who have negative test results (better specificity lower percentage with false positive result).
| Sensitivity | TP/(TP + FN) | 82/(82+71) = 54% |
| Specificity | TN/(FP+ TN) | 301/(13+301) = 96% |
Sensitivity and specificity measures are computed along the columns of the 2 × 2 table.
A problem with these measures is that they are not directly clinically relevant – they tell us the likelihood of a patient having a positive/negative test result given that they do/do not have the condition (this may sometimes only be found out at death). What we want to know is how likely the person is to have the target condition based on their test results, before we are sure of the final diagnosis. As a general rule, tests with high sensitivity can be used to rule out the target condition (because the proportion of false negative tests is low), while those with high specificity can be used to rule in the target condition (because the proportion of false positive tests is low). Useful acronyms for remembering how these apply in practice are SpPin and SnNout (Pewsner et al., 2004) (see Figure 9.2).

Consider our example of anti-CCP for diagnosing RA. We can see that specificity is very high at 96% whereas sensitivity is less good at 54% suggesting that anti-CCP may be useful for ruling in a diagnosis of rheumatoid arthritis as only 4% of patients without RA will have a misleading positive result but is not good for ruling out the diagnosis as 46% of patients with RA will have a misleading negative result.
The best diagnostic test will be one with a very high sensitivity and specificity but there is usually a trade-off, like a see-saw, between sensitivity and specificity, so improving specificity reduces sensitivity and vice versa. However, both high sensitivity and specificity is not always essential depending on how the test will be used in practice.
High sensitivity – In a screening programme (see Chapter 19) the focus of the initial screening test will be on ruling out rather than ruling in disease. A test with a very high sensitivity is therefore required to avoid falsely reassuring patients by telling them they do not have the disease of interest. For example within the breast cancer screening programme, false positives are more acceptable, though this can cause patient anxiety, as those who are test positive on the initial screening test will be referred for more definitive tests to diagnose breast cancer (7 of every 8 women recalled after a positive mammogram do not have breast cancer).
High specificity – If a test result will be used to decide on initiating treatment that is expensive, invasive and/or toxic, it is important that the diagnostic test (often a definitive test) is highly specific so that one does not treat patients who are subsequently found to not have disease. For example, only women with histologically proven breast cancer after a needle biopsy are offered major breast surgery, potentially toxic chemotherapy or radiotherapy.
Pre-test probability of the target condition
The pre-test probability of the target condition can be defined either at the population or the patient level. At the population level it corresponds to the prevalence of the target condition. For a diagnostic cohort study (a study that enrols patients with suspected disease rather than patients whose disease status is known), it can be obtained from the 2 × 2 results table. The pre-test probability of the target condition for an individual patient can be estimated based on their clinical history, results of physical examination, and clinical knowledge and experience. This corresponds to the expected prevalence of the condition in a series of similar patients.
Consider our example: we can estimate the prevalence of RA (population-level pre-test probability) in the population in which the study was carried out as 33%. However, based on the history and physical examination combined with our clinical knowledge and experience we estimate that the patient we have seen has a 45% probability of having RA (individual-level pre-test probability).
| Population pre-test probability | (TP+FN)/ | (82 + 71)/ |
| (82 + 71)/(prevalence) | (82 + 71)/(TP+FP+FN+TN) | (82 + 71)/(82 + 13 + 71 + 301) = 33% |
Positive and negative predictive values and prevalence/pre-test probability of disease
| Positive predictive value (PPV) | TP/ (TP+FP) | 82/ (82+13) = 86% |
| Negative predictive value (PPV) | TN/(FN+TN) | 301 / (71 +301) = 81% |
The Positive Predictive Value (PPV) is the (post-test) probability that a patient with a positive test result has the target condition, while the Negative Predictive Value (NPV) is the probability that a patient with a negative test result does not have the target condition. Predictive values are thus directly clinically relevant. However they are strongly dependent on the population pre-test probability, as well as the test’s sensitivity and specificity. For example, the prevalence of the target condition is likely to be higher in hospital than general practice settings, and the positive predictive value will be correspondingly higher in hospital settings, even if test sensitivity and specificity are the same. For this reason, the PPV and NPV estimated from a primary diagnostic test accuracy study should not be assumed to apply in other settings, for which the pre-test probability of disease may be very different.
For a given pre-test probability (population or individual), it is possible to calculate the post-test probability of disease if data on the sensitivity and specificity of the test are available. A convenient way to do this is via likelihood ratios – this is discussed further below. When evaluating a diagnostic test it can be helpful to think about how the test modifies the probability of the target condition. By considering how the pre-test probability is modified to give a post-test probability of the target condition, for either a positive or negative test, we can assess the clinical usefulness of the test.
Based on our example, in which the population pre-test probability was 33%, the PPV is 86%, so that patients who test positive have an 86% probability of having RA. The negative predictive value is 81%, so that patients who test negative have a 19% probability of having RA. This supports the conclusions above, based on test sensitivity and specificity, that anti-CCP is more useful for ruling in than ruling out a diagnosis of RA. In this population, its accuracy may not be sufficient to either confirm or exclude RA. However, because our patient’s pre-test probability of having RA is 45% we cannot apply these PPV and NPV estimates directly to him. However as we shall see, we can calculate the predictive value for our specific patient using other methods.
Likelihood ratios
A likelihood ratio (LR) describes how much more likely a person with the target condition is to receive a particular test result than a person without the target condition. Thus positive LRs describe how much more likely a person with the condition is to receive a positive test than a person without the condition, and negative LRs how much more likely a person with the condition is to receive a negative test than a person without the condition. A positive LR is usually a number greater than 1 up to infinity and a negative LR usually lies between 0 and 1. Thus a LR of 1 is equivalent to making a diagnosis by tossing a coin as you will correctly identify 50% of patients with disease but wrongly diagnose 50% of those without disease.
| Positive likelihood ratio (LR+) | (TP/(TP + FN))/ (FP/(FP+ TN)) or sensitivity / (1 −specificity) | 0.54 /(1−0.96) = 13.5 |
| Negative likelihood ratio (LR−) | (FN/(TP + FN))/ (TN/(FP+ TN)) or (1 – sensitivity)/specificity | (1−0.54)/0.96 = 0.48 |
In our example of the anti-CCP test, a likelihood ratio of a positive test result of 13.5 means that a person with RA is 13.5-fold more likely to receive a positive test result than a person without RA; in contrast, a likelihood ratio of a negative test result of 0.48 means that a person with RA is only half as likely to receive a negative test result than a person without RA. The further away the value is from 1 (in either direction) the more useful the test. Table 9.1 summarises the interpretation of different values of likelihood ratios and shows where the anti-CCP test lies in relation to other well known diagnostic ‘tests’ (including symptoms elicited during clinical history taking).
Table 9.1 Interpretation of likelihood ratios with some examples.
These examples highlight that clinical histories often have the highest likelihood ratios (e.g. a typical history of angina). The likelihood ratios indicate that a CT scan (likelihood ratio = 26) is better than an ultrasound scan (likelihood ratio = 5.6) for diagnosing pancreatic disease, although the greater accuracy of CT scans needs to be weighed against the fact that they are more expensive. A negative sputum for TB is associated with only a small reduction in the likelihood ratio – this is because many cases with TB often fail to grow the TB bacillus (Mycobacterium tuberculosis) in bacterial culture.
Likelihood ratios have some powerful properties which make them more clinically useful than other measures of accuracy (Deeks and Altman, 2004) as they can be combined with any estimate of the pre-test probability of disease to give an estimate of the post-test probability of disease. This is done using the mathematical relationship known as Bayes’ theorem. The pre-test probability of disease is transformed into the pre-test odds of disease. It is then multiplied by the likelihood ratio to give the post-test odds of disease which can then be transformed into the post-test probability of disease.
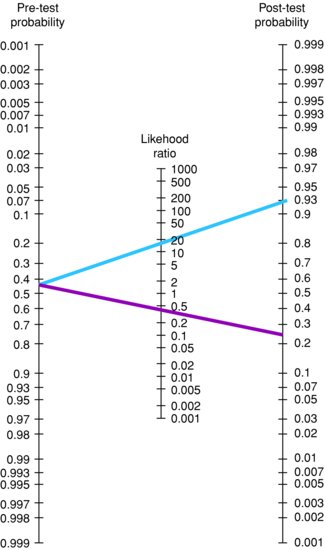
The statistical equations used to do this, given a positive test result, are shown in Box 9.1. There are also more simple methods of doing this than working out the calculation by hand. There are online calculators (e.g. http://www.dokterrutten.nl/collega/LRcalcul.html) where you simply enter the pre-test probability of disease and the likelihood ratio, the post-test probability of disease is then calculated. Alternatively, there is a tool known as the Fagan’s nomogram which can be used to easily obtain estimates of the post-test probability of disease for any given combination of the pre-test probability of disease and likelihood ratio. Fagan’s nomogram is shown in Figure 9.3; electronic versions are also available online (e.g. http://www.cebm.net/index.aspx?o=1161). Using the nomogram you simply select a pre-test probability of disease and likelihood ratio, join these via a straight line and extrapolate the line to find the post-test probability of disease. The pre-test probability of disease is the prevalence of disease, or the probability of the disease before the test is carried out. For any particular patient, this can be estimated based on clinical knowledge and experience in a particular setting.
Figure 9.3 Fagan’s nomogram.
Note: blue line indicates a positive test result; dark red line indicates a negative test result.
Stay updated, free articles. Join our Telegram channel

Full access? Get Clinical Tree


