Fig. 13.1
A ray or fixed ratio design for two drugs in combination studies
This design is typically used in industry for in-vitro studies. A third design (Tan et al. 2009) is an optimal one based on a uniform measure that meets some power requirement for testing departure from Loewe additivity.
For in vivo studies, the number of doses is limited to typically two per compound to avoid using an excessive number of animals. Therefore, usually a factorial design is used.
13.3 Analysis Methods
13.3.1 In Vitro Studies
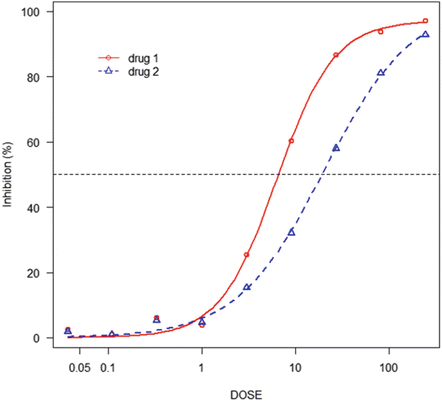
In Vitro studies typically use a 96-well plate with a number of doses of each monotherapy and their combinations. The experiment can be replicated on, for example, three plates. A factorial/checkerboard design is often used in the industry. Here we illustrate the study with an example from Harbron (2010) and the data is reproduced in Table 13.1. Nine doses were tested for each monotherapy with three-fold spacing, of which the six lowest doses were tested in combination based on a factorial design. The test was replicated on three plates, resulting in three growth inhibition values. We use the three-parameter logistic model to model the monotherapy dose response curves.

where y is the drug response at dose d, E the maximum drug response (tumor inhibition), m the slope parameter, and EC 50 the dose that produces 50 % of the maximum drug response. Note that another parameter can be added to represent the minimum drug response, which we assume to be 0. The model was fit to monotherapy data of drug 1 and drug 2 in Table 13.1 and displayed in Fig. 13.2.


(13.1)
Drug 2 | |||||||||||
|---|---|---|---|---|---|---|---|---|---|---|---|
0 | 0.037 | 0.11 | 0.33 | 1 | 3 | 9 | 27 | 81 | 243 | ||
Drug 1 | 0 | 3.1 | 1 | 1 | 8.5 | 13.3 | 23.7 | 53.1 | 78.9 | 93.5 | |
1.5 | 1 | 8.8 | 1 | 14.7 | 30.2 | 59 | 82.9 | 98.8 | |||
1 | 1 | 5.9 | 4.5 | 18.1 | 42.5 | 62 | 81.5 | 86.2 | |||
0.037 | 1 | 1 | 1 | 1 | 8.4 | 21.8 | 38.5 | ||||
5.8 | 2 | 1 | 2.9 | 10 | 4.7 | 34.9 | |||||
1 | 1 | 1 | 4.2 | 7.6 | 9.5 | 35.2 | |||||
0.11 | 1 | 1 | 2.6 | 1 | 5.4 | 22.2 | 32.8 | ||||
1 | 1 | 1 | 2.5 | 9.8 | 22.5 | 34.8 | |||||
1 | 1 | 9.2 | 2 | 8.9 | 15.6 | 30.4 | |||||
0.33 | 1 | 1 | 1 | 4.7 | 8.5 | 22.5 | 37.9 | ||||
4.2 | 6.2 | 4.9 | 6.3 | 12.3 | 19.8 | 41.7 | |||||
13.3 | 6.1 | 9.5 | 5.6 | 7.2 | 15.9 | 34.3 | |||||
1 | 1.9 | 16 | 3.4 | 21.2 | 22.9 | 34 | 52.9 | ||||
4.2 | 6 | 6.6 | 19.6 | 23.4 | 37.7 | 46.4 | |||||
5.7 | 15.8 | 15.5 | 14.7 | 26.4 | 42.1 | 53.9 | |||||
3 | 20.6 | 41.1 | 49.4 | 43 | 50.5 | 55.8 | 66.8 | ||||
31.7 | 42.1 | 50.4 | 48.3 | 40 | 56.6 | 59.2 | |||||
23.9 | 43.1 | 51.3 | 46.1 | 52.5 | 61.8 | 64.2 | |||||
9 | 56.2 | 69.2 | 66.8 | 76.8 | 84.7 | 75.6 | 77.5 | ||||
58.5 | 82.1 | 83.5 | 83.4 | 79.3 | 68.6 | 77.6 | |||||
66.6 | 71.1 | 72.8 | 83.1 | 84 | 85.5 | 79.8 | |||||
27 | 89.4 | ||||||||||
84.9 | |||||||||||
85.8 | |||||||||||
81 | 92.9 | ||||||||||
97.6 | |||||||||||
90.9 | |||||||||||
243 | 99 | ||||||||||
93.7 | |||||||||||
99 | |||||||||||

Fig. 13.2
Three parameter logistic model fitting for monotherapy data of drug 1 and drug 2
For the data in Table 13.1, the question of interest is, “Are these two drugs synergistic?”
< div class='tao-gold-member'>
Only gold members can continue reading. Log In or Register to continue
Stay updated, free articles. Join our Telegram channel

Full access? Get Clinical Tree


