“Definitions and Concepts,” which was written by Scott L. Traub.
Objectives
After completing this chapter, the reader should be able to
- Differentiate between accuracy and precision
- Distinguish between quantitative, qualitative, and semiqualitative laboratory tests
- Define reference range and identify factors that affect a reference range
- Differentiate between sensitivity and specificity, and calculate and assess these parameters
- Identify potential sources of laboratory errors and state the impact of these errors in the interpretation of laboratory tests
- Identify patient-specific factors that must be considered when assessing laboratory data
- Discuss the pros and cons of point-of-care and at-home laboratory testing
- Describe a rational approach to interpreting laboratory results
Laboratory testing is used to detect disease, guide treatment, monitor response to treatment, and monitor disease progression. However, it is an imperfect science. Laboratory testing may fail to identify abnormalities that are present (false negatives [FNs]) or identify abnormalities that are not present (false positives, [FPs]). This chapter defines terms used to describe and differentiate laboratory tests and describes factors that must be considered when assessing and applying laboratory test results.
DEFINITIONS
Many terms are used to describe and differentiate laboratory test characteristics and results. The clinician should recognize and understand these terms before assessing and applying test results to individual patients.
Accuracy and Precision
Accuracy and precision are important laboratory quality control measures. Laboratories are expected to test analytes with accuracy and precision and to document the quality control procedures. Accuracy of a quantitative assay is usually measured in terms of an analytical performance, which includes accuracy and precision. Accuracy is defined as the extent to which the mean measurement is close to the true value. A sample spiked with a known quantity of an analyte is measured repeatedly; the mean measurement is calculated. A highly accurate assay means that the repeated analyses produce a mean value that is the same as or very close to the known spiked quantity. Accuracy of a qualitative assay is calculated as the sum of the true positives (TPs) and true negatives (TNs) divided by the number of samples tested (accuracy = [(TP + TN) ÷ number of samples tested] × 100%). Precision refers to assay reproducibility (i.e., the agreement of results when the specimen is assayed many times). An assay with high precision means that the methodology is consistently able to produce results in close agreement. The accuracy of those results is another question.
Analyte
The analyte is the substance measured by the assay. Some substances, such as phenytoin and calcium, are bound extensively to proteins such as albumin. Although the unbound fraction elicits the physiological or pharmacological effect (bound substances are inactive), most routine assays measure the total substance (bound plus unbound). The free fraction may be assayable, but the assays are not routine. Therefore, the reference range for total and free substances may be quite different. For example, the reference range is 10–20 mcg/mL for total phenytoin, 1–2 mcg/mL for free phenytoin, 9.2–11.0 mg/dL for total serum calcium, and 4.0–4.8 mg/dL for free (also called ionized) calcium.
Some analytes exist in several forms and each has a different reference range. These forms are referred to as fractions, subtypes, subforms, isoenzymes, or isoforms. Results for the total and each form are reported. For example, bilirubin circulates in conjugated and unconjugated subforms as well as bound irreversibly to albumin (delta bilirubin). Direct bilirubin refers to the sum of the conjugated plus the delta forms; indirect bilirubin refers to the unconjugated form. Lactate dehydrogenase (LDH) is separated electrophoretically into five different isoenzymes: LDH1, LDH2, LDH3, LDH4, and LDH5. Creatine kinase (CK) exists in three isoforms: CK1, CK2, and CK3.
A biomarker (biological marker) is a marker (not necessarily a quantifiable laboratory parameter) defined by the National Institutes of Health as “A characteristic that is objectively measured and evaluated as an indicator of normal biological processes, pathogenic processes, or pharmacologic responses to a therapeutic intervention.1 Biomarkers are used to diagnose and stage disease (i.e., determine the extent of disease), assess disease progression, or assess response to therapeutic interventions. Tumor markers are biomarkers used to identify the presence of some cancers, to stage disease, or to assess patient response to drug and nondrug cancer treatments. Many biomarkers are common laboratory parameters. For example, glycosylated hemoglobin A1c (HbA1c) is used to assess long-term glucose control in people with diabetes.
Noninvasive Versus Invasive Tests
A noninvasive test is a procedure that examines fluids or other substances (e.g., urine and exhaled air) obtained without using a needle, tube, device, or scope to penetrate the skin or enter the body. An invasive test is a procedure that examines fluids or tissues (e.g., venous blood and skin biopsy) obtained by using a needle, tube, device, or scope to penetrate the skin or enter the body. Invasive tests pose variable risk depending on the method of specimen collection (e.g., pain and bruising associated with venipuncture) and are less convenient than noninvasive tests.
Predictive Value
The predictive value, derived from a test’s sensitivity, specificity, and prevalence (incidence) of the disease in the population being tested, is used to assess a test’s reliability (Table 1-1). As applied to a positive test result, the predictive value indicates the percent of positives that are TPs. For a test with equal sensitivity and specificity, the predictive value of a positive result increases as the incidence of the disease in the population increases. For example, the glucose tolerance test has a higher predictive value for diabetes in women who are pregnant than in the general population. A borderline abnormal serum creatinine concentration has a higher predictive value for kidney disease in patients in a nephrology unit than in patients in a general medical unit. The lower the prevalence of disease in the population tested, the greater the chance that a positive test result is in error. The predictive value may also be applied to negative results. As applied to a negative test result, the predictive value indicates the percent of negatives that are TNs (refer to Minicase 1).
Assays for Detecting Noroviruses
IN 411 PATIENTS WITH ACUTE GASTROENTERITIS SYMPTOMS, fecal specimens were tested for norovirus with a standard real-time reverse transcription-polymerase chain reaction (RT-PCR) molecular assay and a new immunochromatographic assay.2 The new immunochromatographic assay provides very rapid results but may not be as sensitive as standard molecular assays.
Question: After reviewing the following results, what conclusions can be made about the clinical performance of the new immunochromatographic assay?
Immunochromatographic Assay Results (n=411):
| True Positives | 52 |
| False Positives | 1 |
| True Negatives | 342 |
| False Negatives | 16 |
Discussion: Calculate sensitivity, specificity, predictive value of a positive test, and the predictive value of a positive and negative test.
Sensitivity = (TP ÷ [TP + FN]) × 100% = (52 ÷ [52 + 16 ]) × 100% = 76.5%
Specificity = (TN ÷ [FP +TN]) × 100% = (342 ÷ [342 + 1 ]) × 100% = 99.7%
Predictive value of positive test = (TP ÷ [TP + FP]) × 100% = (52 ÷ [52 + 1 ]) × 100% = 98.1%
Predictive value of negative test = (TN ÷ [TN + FN]) × 100% = (342 ÷ [342 + 16 ]) × 100% = 95.5%
In this study, the new immunochromatographic assay had high specificity but low sensitivity as compared to a standard real-time RT-PCR assay. The new immunochromatographic assay may be useful for the rapid detection of norovirus infections, but it is not sensitive enough to rule out norovirus infection in those with negative test results.
Predictive value of positive test = [TP ÷ (TP + FP)] × 100%.
Predictive value of negative test = [TN ÷ (TN + FN)] × 100%.
Disease prevalence = (TP + FN) ÷ number of patients tested.
TP = diseased persons detected by test (true positives).
FP = nondiseased persons positive to test (false positives).
FN = diseased persons not detected by test (false negatives).
TN = nondiseased persons negative to test (true negatives).
Qualitative Tests
A qualitative test is a test whose results are reported as either positive or negative without further characterization of the degree of positivity or negativity. Exact quantities may be measured in the lab but are still reported qualitatively using predetermined ranges. For example, a serum or urine pregnancy test is reported as either positive or negative; a bacterial wound culture is reported as either positive for one or more specific microorganisms or reported as no growth; a urine toxicology drug screen is reported as either positive or negative for specific drugs; and an acid-fast stain for Mycobacterium is reported as either positive or negative.
Quantitative Tests
A quantitative test is a test whose results are reported as an exact numeric measurement (usually a specific mass per unit measurement) and assessed in the context of a reference range of values. For example, serum potassium is reported in milliequivalents per liter, creatinine clearance is reported in milliliters per minute, and LDH is reported in units per liter. Some test results are reported as titers (dilutions). For example, a serum antinuclear antibody titer of 1:160 is usually associated with active systemic lupus erythematosus (LE) or other autoimmune diseases, though some patients may have “low titer” disease with titers of 1:40 or 1:80.
The reference range is a statistically-derived numerical range obtained by testing a sample of individuals assumed to be healthy. The upper and lower limits of the range are not absolute (i.e., normal versus abnormal), but rather points beyond which the probability of clinical significance begins to increase. The term reference range is preferred over the term normal range.3 The reference population is assumed to have a Gaussian distribution with 68% of the values within one standard deviation (SD) above and below the mean, 95% within ±2 SD, and 99.7% within ±3 SD (Figure 1-1).
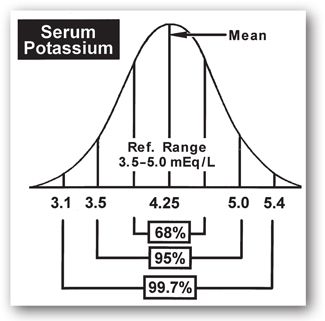
FIGURE 1-1. Gaussian (random) value distribution with a visual display of the area included within increments of standard deviation (SD) above and below the mean: ±1 SD = 68% of total values; ±2 SD = 95% of total values; and ±3 SD = 99.7% of total values.
The reference range for a given analyte is usually established in the clinical laboratory as the mean or average value plus or minus two SDs. Acceptance of the mean ±2 SD indicates that one in 20 normal individuals will have test results outside the reference range (2.5% have values below the lower limit of the reference range and 2.5% have values above the upper limit of the reference range). Accepting a wider range (e.g., ±3 SD) includes a larger percentage (97.5%) of normal individuals but increases the chance of including individuals with values only slightly outside of a more narrow range, thus decreasing the sensitivity of the test.
Qualitative laboratory tests are either negative or positive and without a reference range; any positivity is considered abnormal. For example, any amount of serum acetone, porphobilinogen, or alcohol is considered abnormal. The presence of glucose, ketones, blood, bile, or nitrate in urine is abnormal. The results of the Venereal Disease Research Laboratory (VDRL) test, the LE prep test, tests for red blood cell (RBC) sickling, and the malaria smear are either positive or negative.
Factors That Influence the Reference Range
Many factors influence the reference range. Reference ranges may differ between labs depending on analytical technique, reagent, and equipment. The initial assumption that the sample population is normal may be false. For example, the reference range is inaccurate if too many individuals with covert disease (i.e., no signs or symptoms of disease) are included in the sample population. Failure to control for physiologic variables (e.g., age, gender, ethnicity, body mass, diet, posture, and time of day) introduces many unrelated factors and may result in an inaccurate reference range. Reference ranges calculated from nonrandomly distributed (non-Gaussian) test results or from a small number of samples may not be accurate.
Reference ranges may change as new information relating to disease and treatments becomes available. For example, the National Cholesterol Education Program’s (NCEP) Third Report of the Expert Panel on Detection, Evaluation, and Treatment of High Blood Cholesterol in Adults (Adult Treatment Panel III or ATP III), released in 2001, includes recommendations to lower and more closely space reference range cutoff points for low-density lipoprotein cholesterol (LDL-C), high-density lipoprotein cholesterol (HDL-C), and triglycerides (TGs).4 The availability of more sensitive thyrotropin (thyroid-stimulating hormone [TSH]) assays and the recognition that the original reference population data was skewed has led some clinicians to conclude that there is a need to establish a revised reference range for this analyte.5
The term critical value refers to a result that is far enough outside the reference range that it indicates impending morbidity (e.g., potassium <2.8 mEq/L). Because laboratory personnel are not in a position to consider mitigating circumstances, a responsible member of the healthcare team is notified immediately on discovery of a critical value test result. Critical values may not always be clinically relevant, however, because the reference range varies for the reasons discussed above.
Semiquantitative Tests
A semiquantitative test is a test whose results are reported as either negative or with varying degrees of positivity but without exact quantification. For example, urine glucose and urine ketones are reported as negative or 1+, 2+, 3+; the higher numbers represent a greater amount of the measured substance in the urine, but not a specific concentration.
Sensitivity
The sensitivity of a test refers to the ability of the test to identify positive results in patients who actually have the disease (TP rate).6,7 Sensitivity assesses the proportion of TPs disclosed by the test (Table 1-2). A test is completely sensitive (100% sensitivity) if it is positive in every patient who actually has the disease. The higher the test sensitivity, the lower the chance of a false-negative result; the lower the test sensitivity, the higher the chance of a false-negative result. However, a highly sensitive test is not necessarily a highly specific test (see below).
| TABLE 1-2. Calculation of Sensitivity and Specificity | |||
| Screening Test Result | Diseased | Not Diseased | Total |
| Positive | TP | FP | TP + FP |
| Negative | FN | TN | FN + TN |
| Total | TP + FN | FP + TN | TP + FP + FN + TN |
Sensitivity = [TP ÷ (TP + FN)] × 100%.
Specificity = [TN ÷ (FP + TN)] × 100%.
TP = diseased persons detected by test (true positives).
FP = nondiseased persons positive to test (false positives).
FN = diseased persons not detected by test (false negatives).
TN = nondiseased persons negative to test (true negatives).
Highly sensitive tests are preferred when the consequences of not identifying the disease are serious; less sensitive tests may be acceptable if the consequence of a false negative is less significant or if low sensitivity tests are combined with other tests. For example, inherited phenylalanine hydroxylase deficiency (phenylketonuria or PKU) results in increased phenylalanine concentrations. High phenylalanine concentrations damage the central nervous system and are associated with mental retardation. Mental retardation is preventable if PKU is diagnosed and dietary interventions initiated before 30 days of age. The phenylalanine blood screening test, used to screen newborns for PKU, is a highly sensitive test when testing infants at least 24 hours of age.8 In contrast, the prostate specific antigen (PSA) test, a test commonly used to screen men for prostate cancer, is highly sensitive at a low PSA cutoff value but highly specific only at a high PSA cutoff value.9 Thus, PSA cannot be relied on as the sole prostate cancer screening method.
Sensitivity also refers to the range over which a quantitative assay can accurately measure the analyte. In this context, a sensitive test is one that can measure low levels of the substance; an insensitive test cannot measure low levels of the substance accurately. For example, a digoxin assay with low sensitivity might measure digoxin concentrations as low as 0.7 ng/mL. Concentrations below 0.7 ng/mL would not be measurable and would be reported as “less than 0.7 ng/mL” whether the digoxin concentration was 0.69 ng/mL or 0.1 ng/mL. Thus this relatively insensitive digoxin assay would not differentiate between medication nonadherence with an expected digoxin concentration of 0 ng/mL and low concentrations associated with inadequate dosage regimens.
Specificity
Specificity refers to the percent of negative results in people without the disease (TN rate).6,7 Specificity assesses the proportion of TNs disclosed by the test (Table 1-2); the lower the specificity, the higher the chance of a false-positive result. A test with a specificity of 95% for the disease in question indicates that the disease will be detected in 5% of people without the disease. Tests with high specificity are best for confirming a diagnosis because the tests are rarely positive in the absence of the disease. Several newborn screening tests (e.g., PKU, galactosemia, biotinidase deficiency, congenital hypothyroidism, and congenital adrenal hyperplasia) have specificity levels above 99%.10 In contrast, the PSA test is an example of a test with low specificity. The PSA is specific for the prostate but not specific for prostate carcinoma. Urethral instrumentation, prostatitis, urinary retention, prostatic needle biopsy, and benign prostatic hyperplasia elevate the PSA. The erythrocyte sedimentation rate (ESR) is another nonspecific test; infection, inflammation, and plasma cell dyscrasias increase the ESR.
Specificity as applied to quantitative laboratory tests refers to the degree of cross-reactivity of the analyte with other substances in the sample. For example, vitamin C cross-reacts with glucose in some urine tests (e.g., Clinitest®), falsely elevating the urine glucose test results. Quinine may cross-react with or be measured as quinidine in some assays, falsely elevating reported quinidine concentrations.
Specimen
A specimen is a sample (e.g., whole blood, venous blood, arterial blood, urine, stool, sputum, sweat, gastric secretions, exhaled air, cerebrospinal fluid, or tissues) that is used for laboratory analysis. Plasma is the watery acellular portion of blood. Serum is the liquid that remains after the fibrin clot is removed from plasma. While some laboratory tests are performed only on plasma (e.g., renin activity and adrenocorticotropic hormone [ACTH] concentration) or serum (e.g., serum electrophoresis and acetaminophen concentration), other laboratory tests can be performed on either plasma or serum (e.g., aldosterone, potassium, and sodium concentrations).
Units Used in Reporting Laboratory Results
Laboratory test results are reported with a variety of units. For example, four different units are used to report serum magnesium concentration (1.0 mEq/L = 1.22 mg/dL = 0.5 mmol/L = 12.2 mg/L). Additionally, the same units may be reported in different ways. For example, mg/dL, mg/100 mL, and mg% are equivalent units. Enzyme activity is usually reported in terms of units, but the magnitude varies widely and depends on the methodology. Rates are usually reported in volume per unit of time (e.g., creatinine clearance is measured in mL/min or L/hr), but the ESR is reported in mm/hr and coagulation test results are reported in seconds or minutes. This lack of standardization is confusing and may lead to misinterpretation of the test results.
The International System of Units (Système Internationale d’Unités, or SI) was created about 40 years ago to standardize quantitative units worldwide.11 Four base units and symbols are designated: length (meter, m), mass (kilogram, kg), time (second, s), and substance (mole, mol). Five derived units are designated: volume (liter, L, 10-3 m3), force (newton, N, kg ms-2), pressure (pascal, Pa, kg m–1 s-2), energy ( joule, J, kg m2 s-2), and power (watt, W, kg m2 s-3). However, it is difficult for clinicians to relate to molar concentrations (e.g., serum cholesterol 4.14 mmol•L–1 versus 160 mg/dL, or HbA1c mmol/mL versus 8%). In the United States, most laboratory results are reported in conventional units.
Rationale for Ordering Laboratory Tests
Laboratory tests are performed with the expectation that the results will
- Discover occult disease
- Confirm a suspected diagnosis
- Differentiate among possible diagnoses
- Determine the stage, activity, or severity of disease
- Detect disease recurrence
- Assess the effectiveness of therapy
- Guide the course of therapy
Laboratory tests are categorized as screening or diagnostic tests. Screening tests, performed in individuals without signs or symptoms of disease, detect disease early when interventions (e.g., lifestyle modifications, drug therapy, and surgery) are likely to be effective. Screening tests are performed on healthy individuals and are generally inexpensive, quick and easy to perform, and reliable but do not provide a definitive answer. Screening tests require confirmation with other clinical tests. Diagnostic tests are performed on at-risk individuals, are typically more expensive, and are associated with some degree of risk but provide a definitive answer.12
Comparative features of screening tests are listed in Table 1-3. Examples of screening tests include the Papanicolaou smear, lipid profile, PSA, fecal occult blood, tuberculin skin test, sickle cell tests, blood coagulation tests, and serum chemistries. Screening tests may be performed on healthy outpatients (e.g., ordered by the patient’s primary care provider or performed during public health fairs) or on admission to an acute care facility (e.g., prior to scheduled surgery). Abnormal screening tests are followed by more specific tests to confirm the abnormality.
aCompiled from reference 13.
Screening tests must be cost-effective and population-appropriate. The number needed to screen (NNS) is defined as “the number of people that need to be screened for a given duration to prevent one death or one adverse event.”14 For example, 465 women need to undergo mammographic screening every 24–33 months for 7 years to save one life from breast cancer.15
Diagnostic tests are performed in individuals with signs or symptoms of disease, a history suggestive of a specific disease or disorder, or an abnormal screening test. Diagnostic tests are used to confirm a suspected diagnosis, differentiate among possible diagnoses, determine the stage of activity of disease, detect disease recurrence, and assess and guide the therapeutic course. Diagnostic test features are listed in Table 1-3. Examples of diagnostic tests include blood cultures, serum cardiac-specific troponin I and T, kidney biopsy, and the cosyntropin test.
Many laboratories group a series of related tests (screening and/or diagnostic) into a set called a profile. For example, the basic metabolic panel (BMP) includes common serum electrolytes (sodium, potassium, and chloride), carbon dioxide content, blood urea nitrogen (BUN), calcium, creatinine, and glucose. The comprehensive metabolic panel (CMP) includes the BMP plus albumin, alanine aminotransferase (ALT), aspartate aminotransferase (AST), total bilirubin, and total protein. Grouped together for convenience, some profiles may be less costly to perform than the sum of the cost of each individual test. However, profiles may generate unnecessary patient data. Attention to cost is especially important in the current cost-conscious era. A test should not be done if it is unnecessary, redundant, or provides suboptimal clinical data (e.g., non-steady-state serum drug concentrations). Before ordering a test, the clinician should consider the following questions:
- Was the test recently performed and in all probability the results have not changed at this time?
- Were other tests performed that provide the same information?
- Can the needed information be estimated with adequate reliability from existing data?
For example, creatinine clearance can be estimated using age, height, weight, and serum creatinine rather than measured from a 24-hour urine collection. Serum osmolality can be calculated from electrolytes and glucose rather than measured directly. Additionally, a clinician should ask, “What will I do if results are positive or negative (or absent or normal)?” If the test result will not aid in clinical decisions or change the diagnosis, prognosis, or treatment course, the benefits from the test are not worth the cost of the test.
Factors That Influence Laboratory Test Results
Laboratory results may be inconsistent with patient signs, symptoms, or clinical status. Before accepting reported laboratory values, clinicians should consider the numerous laboratory- and patient-specific factors that may influence the results (Table 1-4). For most of the major tests discussed in this book, a Quickview chart summarizes information helpful in interpreting results. Figure 1-2 depicts the format and content of a typical Quickview chart.
Stay updated, free articles. Join our Telegram channel

Full access? Get Clinical Tree


