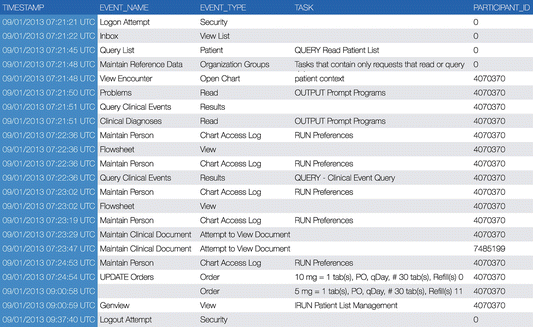
A significant limitation of using security audit logs in HCI research is that some transitory screen activities (e.g. user moving a window around to reduce the amount of visual clutter on the screen) are not logged which nevertheless could be of considerable interest to HCI experts. Further, timestamps recorded in a security audit log file only indicate when a clinical action occurred. This information is not adequate to answer important usability questions such as how long it took the user to perform the action (e.g., to fill out a medication ordering form), or if the user chose the optimal options when using the system (since the original clinical context may also be unknown). Additional tools are therefore needed for HCI experts to acquire supplemental data on screen activities, described in the next section.
6.2.2.2 Screen Activities
Screen activities, such as mouse cursor trails, mouse clicks/drags, keystrokes, and window activation and window movements, have been popularly used in HCI research to study user interactions with a software system to detect potential usability pitfalls. Screen activities reveal rich details of user behaviors that may not be otherwise available, e.g., user clicking a “+” sign to expand a tree view to see a full list of medications, or clicking the “Close” button to skip a popup window presenting a computer-generated clinical decision-support reminder. This additional level of detail is very important for HCI research in healthcare because many commercial HIT systems may not log user actions that do not involve direct accesses of or modifications to patient charts.
Screen activities may be recorded as a sequence of screen snapshots or as a video stream. Figure 6.1 illustrates a sample frame from a video clip capturing a user session took place in an outpatient exam room. When a front-mounted camera is available, additional contextual video/audio data (shown in the bottom right window) may also be recorded along with screen activities providing an opportunity for HCI experts to study the clinician’s (as well as the patient’s) facial expressions, body gestures, and conversations between the clinician and the patient.
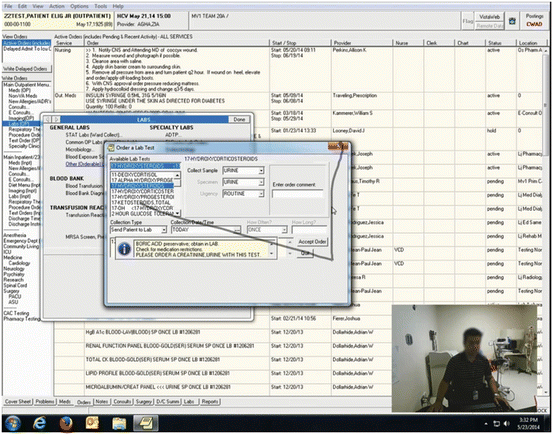

Fig. 6.1
A sample frame from a screen activity video clip recording a clinician interacting with an EHR system. The superimposed dark grey path shows the trail of the mouse cursor over the 1 s prior to the capture of this frame
Screen activities may also be recorded as log data containing a chronological list of user interaction events that can be computationally analyzed. Screen footage and contextual videos, on the other hand, are much harder to analyze which often requires prolonged and laborious manual coding processes. As illustrated in a sample screen activity log shown in Table 6.2, a variety of usability metrics can be readily derived from the structured log data including time efficiency (how much time it takes to complete a given task), operation efficiency (how many mouse clicks or keystrokes it requires to complete a given task), and error rates (e.g., frequency of user clicking a wrong button or the ratio of unnecessary mouse/keyboard activities that did not contribute to the accomplishment of a given task). For example, Magrabi et al. (2010) used screen activities to examine how task complexity and interruption affect clinician performance in terms of error rates, resumption lag, and task completion time in creating and updating electronic medication charts (Magrabi et al. 2010). Screen activity logs, especially when combined with other sources of data (e.g., security auditing logs), can also reveal other interaction behaviors of high interest to HCI researchers such as how clinicians copy/paste text from various sources in a an EHR system to construct a narrative note.
Table 6.2
A sample screen activity log
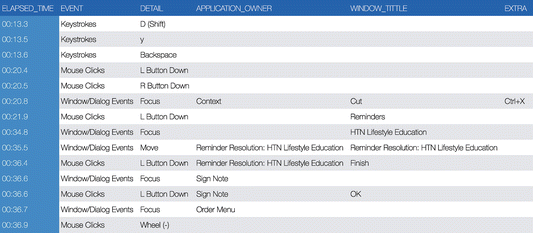 |
Many software tools are available for capturing and analyzing computer screen activities. Morae (TechSmith Corporation, Okemos, MI), for example, is a commercial product widely used in usability studies and market research that allows for observing, recording, and analyzing user interactions with software systems such as websites.6 Both the video footage shown in Fig. 6.1 and the screen activity log shown in Table 6.2 were generated using Morae. In healthcare, screen activity capturing tools have been developed specifically to work with HIT systems such as EHRs. Turf (an acronym for “Task, User, Representation, Function”), for example, is an EHR usability assessment tool developed at the National Center for Cognitive Informatics and Decision Making funded by the ONC’s Strategic HIT Advanced Research initiative.7 Turf is an integrated toolkit that allows for screen capturing, UI markups, and heuristic evaluation (e.g., experts can use the system to indicate potential usability issues on a screen and label them as minor, moderate, major or catastrophic). The evaluation criteria incorporated in Turf are based on the National Institute of Standards and Technology’s (NIST) EHR usability evaluation protocol, NISTIR 7804.8
6.2.2.3 Eye Tracking
Screen activity data capture how users interact with a software system using mouse and keyboard. However, user activities that do not trigger a traceable screen event are not captured. These activities may include, for example, a clinician reading from an EHR system to digest a patient’s earlier discharge summary before meeting the patient in an exam room, or examining the content of a computer-generated drug safety alert before acting upon it. Head and eye movements captured through eye-tracking devices can thus become an important source of data enabling HCI experts to study interesting topics such as how clinicians seek information and make sense of a patient case out of a large volume of patient records and whether there is a tendency among clinicians to skip computer-generated advisories without carefully reading them.
An eye-tracking device measures a person’s head position (gaze) and eye movements relative to the head that reveal the person’s visual and overt attention processes. Modern eye-tracking technologies are often based on optical sensors that capture the vector between the pupil center and the corneal reflections created by casting a beam of infrared or near-infrared non-collimated light on the eye. In HCI, the eye-tracking technique has been commonly used in assessing the usability of websites e.g. to study which portion(s) of the screen that web surfers’ attention tends to focus on more often so as to optimize the placement of online advertisements (Poole and Ball 2005). It has also been used in healthcare particularly in the areas of autism research (Falck-Ytter et al. 2013), anxiety and depression (Armstrong and Olatunji 2012), and training and assessing the skills of surgeons (Tien et al. 2014).
Figure 6.2 shows an eye-tracking device mounted below a computer monitor in an outpatient exam room. This configuration is not intrusive and can detect both head and eye movements, and is thus more practical to use in everyday healthcare settings. Eye-tracking data obtained through the device can be synchronized with screen activity recordings to reveal which part of the computer screen the user was looking at moment-by-moment during a use session. The end result can be plotted as heat-maps showing hotspots on an application’s UI or eye trails traversing different parts of the screen, as illustrated in Fig. 6.3a, b, respectively. In addition, the eye-tracking data provide hints as to when the user gazes away from the computer to attend to other stimuli in the room, e.g., the patient. This allows HCI experts to study how the presence of computers in an exam room might interfere with patient–provider communications. Many manufactures produce eye-tracking devices and analytical software are produced. Leading vendors include Tobii Technology9 and SensoMotoric Instruments (SMI).10
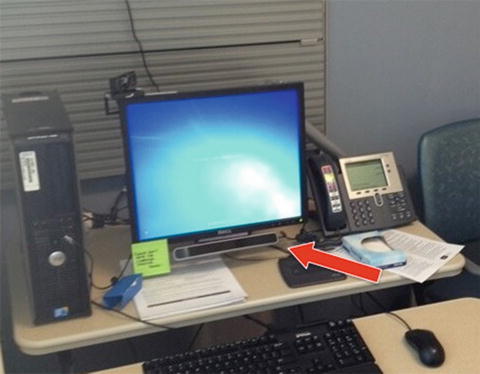
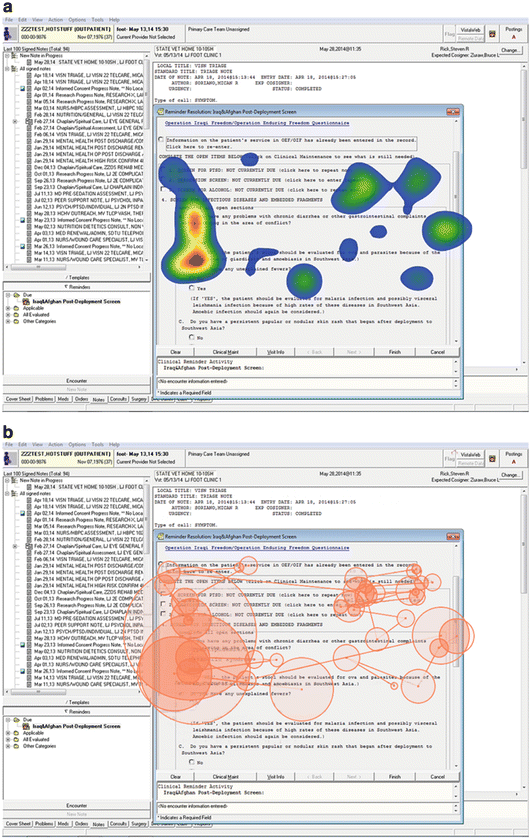

Fig. 6.2
A table-mounted eye tracker in an outpatient exam room

Fig. 6.3
Heat-map and eye trails produced by eye-tracking data
6.2.2.4 Motion Capture
A considerable body of the HCI literature in healthcare concerns how introduction of computerized systems changes the dynamics of patient–clinician interactions in an exam room. It has been extensively documented that computer use during clinical consultations could be associated with adverse impact such as diminished quality of patient–clinician communications and elevated levels of patient disengagement and dissatisfaction. Some frequently reported reasons include loss of eye contact, rapport, and provision of emotional support; interference with conversations due to the clinician gazing back-and-forth at the computer screen; reduced emphasis on psychosocial questioning and relationship maintenance; and irrelevant computer-prompted inquiries diluting the focus on the patient’s current issues. For a review of these potential issues, see Kazmi (2013).
Besides the methods for capturing computer activities and eye movements, HCI experts in healthcare are also experimenting with novel sensor-based technologies that allow for automated collection and analysis of additional dimensions of patient–clinician interaction data such as vocalization, body orientation, and body gestures. Microsoft Kinect™,11 for example, is an affordable yet effective solution that includes an infrared depth sensor for tracking depth data (i.e., participants’ distance and angle relative to the position of the camera), body movements (kinetics through motion of body joints e.g. head, should center, shoulder left/right, elbow left/right, wrist left/right, hand left/right, etc.), and head orientation (e.g., pitch, roll, yaw). It also has a built-in microphone array that detects the angle of multiple audio sources which makes it possible to perform automated segmentation of voice data to identify vocalization sequences, clinician’s visual attention (EHR vs. patient), as well as characterize turn-talking behaviors in terms of whether the clinician or the patient was talking. Such data can thus enable HCI experts to answer daunting questions e.g. the body language that clinicians use when interacting with patients while simultaneously using computerized systems such as EHRs. Figure 6.4 shows a Kinect mounted above and behind a computer monitor in an outpatient exam room. Figure 6.5 illustrates a sample frame from a depth and skeleton image sequence recorded by Kinect’s depth camera.
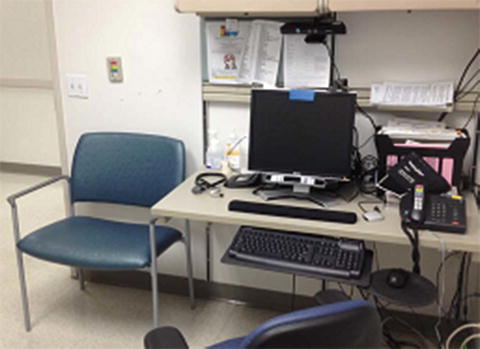
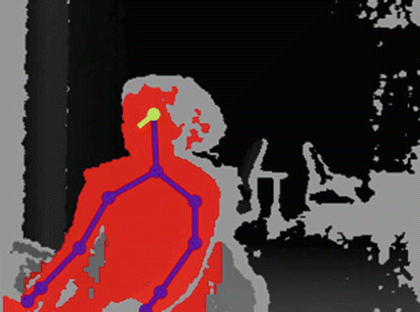

Fig. 6.4
Microsoft Kinect™ installed in an outpatient exam room and monitoring a physician’s movements

Fig. 6.5
Skeletal and depth data recorded by Kinect. The red overlay indicates that a body has been recognized; the purple dots indicate body joints connected through purple lines; the yellow line indicates the gaze vector as inferred from pitch yaw and roll
A distinctive advantage of using sensor-based technologies such as Kinect is that the data collected can be programmatically analyzed eliminating the need to have human coders to manually review hours of video/audio data. Microsoft provides a non-commercial Kinect Software Development Kit (SDK) freely available to HCI experts to develop customized analytical programs to perform post-processing tasks such as background removal, gesture recognition, facial recognition, and voice recognition.12
For example, the depth, skeletal, and voice direction data are all recorded as digitized coordinates which can be easily computed to determine the relative positions of the participants in the room (typically a clinician and a patient if it is an outpatient primary care exam room) at each given time during a clinical encounter. This allows HCI experts to automatically segment the progression of a clinical consultation into distinct stages e.g. greetings, physical exam, conversing in seated positions, and patient and/or clinician leaving the room. Nonverbal communications such as head orientation and body gestures can also be automatically recognized and studied, and can be further synchronized with eye-tracking data to precisely profile the clinician’s gazing behavior when using the EHR to enter or retrieve information while talking to the patient. Large-scale deep analyses of patient–clinician interactions are thus possible at reasonably costs without involving laborious manual coding processes. For a more in-depth discussion on how to use sensor-based technologies to study the dynamics of patient–clinician interactions in exam rooms and potential practical obstacles, see Weibel et al. (2015).
6.2.2.5 Real-Time Locating Systems (RTLS)
Clinicians as well as patients move around constantly in a medical facility to provide/receive care and to interact with other stakeholders (e.g., families, specialists, pharmacists). While the other computational ethnographical methods described in this section help HCI experts examine the interactions between clinicians, patients, and computerized systems, they do not allow for comprehensive collection of motion-location data that may lead into novel insights. For example, with motion-location data, HCI researchers are in a better position to answer questions such as whether the physical layout of an outpatient clinic or an inpatient ward is optimally designed to facilitate patient care delivery, and whether the introduction of HIT systems might result in a reduction of face time among healthcare coworkers. Sensor-based RTLS systems, most commonly based on the radio-frequency identification (RFID) technology,13 provide a solution to capturing such motion-location data. RFID has a long history of being used in healthcare for supply chain management purposes (e.g., asset tracking of medical devices) and patient safety purposes (e.g., patient identification), and has been increasingly used in HCI studies to determine the whereabouts of clinicians or patients. For a review of applications of RFID in healthcare, see Wamba et al. (2013) and Rosen et al. (2014).
An RFID tag or badge contains an electronic transponder that emits or responds to electromagnetic signals to both identify itself and triangulate its position relative to base stations installed in the environment. The locating precision depends on vendor and configuration, but is generally adequate for studying problems concerned in HCI such as whether two or a group of healthcare providers are in close spatial proximity (e.g., the same room), which provides an opportunity for them to engage in interpersonal communications. Joined with timestamps, the spatiotemporal data collected via an RTLS system allow HCI experts to explore a variety of interesting topics, for example, clinicians’ movement patterns, the dynamics of team aggregation and dispersion, and potential workflow deficiencies.
6.2.2.6 Other Types of Computational Ethnographical Data
Besides the five major types of computational ethnographical data discussed in this section, there are also other sources of digital traces that HCI experts may potentially tap into, such as paging/phone logs tracked by telecommunication systems, email messages delivered or received by email servers, internet traffic monitored by proxy servers and firewall systems, and data and metadata collected by barcode scanners and by medical devices e.g. intelligent infusion pumps. Combining these data sources together allows HCI experts to study everyday activities taking place in a healthcare environment at an unprecedented level of comprehensiveness, depth, and accuracy.
6.2.3 Analyzing Computational Ethnographical Data
6.2.3.1 Coding Computational Ethnographical Data
To analyze computational ethnographical data, a coding schema must be first identified or developed for properly labeling and categorizing the events recorded. For example, to make sense of security audit logs, researchers need to first determine the taxonomies used for “event name” and “event type” (see Table 6.1), which can often be found in software documentation or obtained directly from the vendor. Over the years, the HCI and the health informatics research communities have created many task taxonomies to characterize clinicians’ work in different care areas or different medical specialties. For example, Tierney et al. (1993) developed a clinical task taxonomy comprised of tasks commonly performed by inpatient internists (Tierney et al. 1993) and subsequently adapted it to use in ambulatory primary care settings (Overhage et al. 2001). Wetterneck et al. (2012) developed a comprehensive primary care task list for evaluating clinic visit workflow which incorporates more granular task and task category definitions such as looking up the referral doctor from an EHR system or from a paper chart (Wetterneck et al. 2012). Similar taxonomies have been established to characterize the work by anesthesiologists (Hauschild et al. 2011), ICU nurses (Douglas et al. 2013), clinicians working on general medicine floors (Westbrook and Ampt 2009), as well as clinical activities specifically related to medication ordering and management (Westbrook et al. 2013).
If an HCI study mainly concerns clinicians’ documentation behavior, it is advised that the researchers base their analysis on a formal classification of EHR functions and record structures, such as ASTM International’s “Standard Practice for Content and Structure of the Electronic Health Record (EHR), ASTM E1384-07,”14 “Standard Specification for Healthcare Document Formats, E2184-02”,15 or “Data Elements for EHR Documentation” curated by the American Health Information Management Association (Kallem et al. 2007). These standards define basic functions of EHR systems, common types of clinical documents, and the structure of each document type (e.g., sections and data elements that should be contained in a discharge summary). Using these standards properly can help standardize the conduct and results reporting of documentation behavior research.
6.2.3.2 Analyzing Computational Ethnographical Data
Data collected using computational ethnographical methods can be analyzed in many ways depending on the objective and the context of an HCI study. For example, researchers interested in patient throughput may perform time series analyses to determine the intensity of clinical activities in different units in a hospital during different hours of the day and different days of the year; researchers interested in time efficiency may compute descriptive statistics to determine average turnaround between a medication order is placed and the medication is fulfilled/administered using a new computerized order entry system; and researchers interested in optimizing a UI design may use the amount of eyeball and mouse movements as a surrogate measure of the effectiveness of the organization of information and UI elements on the screen. Error rates, documentation patterns, and formation and dismissal of care teams are also frequently studied research topics (Magrabi et al. 2010; Bohnsack et al. 2009; Vawdrey et al. 2011). In this section, we describe a few unique analytical approaches that are particularly useful in analyzing computational ethnographical data.
First, temporal data mining is commonly used in computational ethnography. This is because computational ethnographical data are always recorded in the form of, or can be easily transposed into, time-stamped event sequences exhibiting the temporal (and potentially spatial) distribution of occurrences of a series of events. Because temporal data mining identifies temporal interdependencies between events, this family of methods is ideal for discovering hidden regularities from computational ethnographical data that may have significant clinical or behavioral implications. For example, HCI researchers studying the impact of HIT on clinical workflow may be interested in identifying clinical activities that are usually carried out in a given sequential order to examine whether the design of a HIT system may facilitate or hinder the ordered execution of a series of clinical tasks.
Sequential pattern analysis is one such temporal data mining method for characterizing how interrelated events are chronologically arranged. Sequential pattern analysis was initially developed by Agrawal and Srikant (1995) to study customers’ shopping behavior, e.g., predicting a customer’s future merchandise purchases based on the person’s past shopping record. Consider the following three event sequences wherein each symbol representing a clinical activity: ab eg cd hf, e ab h cd, ab h cd fg. It can be easily observed that ab…cd is a frequently occurring pattern supported by all three sequences. If the implementation of a new HIT system requires cd to be performed prior to ab, or another task to be performed between a and b or between c and d, it is possible that the new system may introduce considerable disruptions to the established workflow as well as clinicians’ cognitive processes. For a review of sequential data analysis and temporal mining, see Sanderson and Fisher (1994) and Laxman and Sastry (2006).
Second, time-stamped events sequences derived from computational ethnographical data can be used for transition analyses. For example, from the three sample event sequences above, it can be easily calculated that the probability of observing event b following event a is 1, and the probabilities of observing e and h following b are 0.25 and 0.5, respectively. This information enables HCI researchers to characterize the nature of task transitions in clinical care. It may also allow HCI researchers to associate ‘cost’ with each task transition and assess whether the introduction of a new software system might increase or decrease such cost. Here, ‘cost’ may consist of cognitive load of switching between tasks as well as the physical effort that the task switching may incur. Studying the cost associated with task transitions is important because it has been shown in the cognition literature that frequent task switching is often associated with increased mental burden on the performer (e.g., task prioritizing and task activation). Additionally, switching between tasks that are of distinct natures could result in a higher likelihood of cognitive slips and mistakes; for example, the loss-of-activation error manifesting as forgetting what the preceding task was about in a task execution sequence.
Lastly, transition probabilities hereby obtained allow HCI researchers to conduct Markov chain analysis (Grinstead and Snell 1997) to determine that in a series of events which event might most likely appear in which step. These Markov chains, based on empirical contexts, may represent activities that a primary care physician performs during an outpatient patient visit or care procedures that a patient must go through before a surgical operation. Such information helps HCI researchers quantify the nature of established workflow in a healthcare environment and design software systems accordingly that best align with such workflow.
6.2.4 Limitation of Computational Ethnography
Comparing to traditional approaches for conducting HCI fieldwork, computational ethnographical methods provide an automated and less intrusive means for HCI researchers to study software systems or medical devices deployed in the field and used in naturalistic settings. However, computational ethnography also has notable shortcomings. A critical limitation of computational ethnographical methods is that while automatically captured digital trace data help HCI researchers tell what happened in the field, they are often inadequate to shed light on why clinicians demonstrated the observed behaviors. Mixed methods, which combine the merits of computational ethnography with qualitative research designs such as interviews, context inquiry and ethnographically based observations, are therefore highly encouraged. Further, computational ethnographical data are not necessarily complete for characterizing clinicians’ certain behaviors. For example communication analyses solely based on computer logs (paging/phone, email, messaging, etc.) may fail to consider other important channels of communication among clinicians such as hallway or bedside conversations. Thus, when conducting computational ethnographical investigations, researchers shall be always mindful whether such data are a truly comprehensive reflection of clinicians’ work of interest. Lastly, computational ethnographical data may originate from multiple sources posing great challenges to synchronization and integrative analysis. In addition, computational ethnographical data may be originally collected to support operational purposes (e.g., security auditing), rather than research. Preparing such data for research reuse could therefore be resource consuming and may require sophisticated analytical skills.
Stay updated, free articles. Join our Telegram channel

Full access? Get Clinical Tree


