Fig. 1
Overview of the workflow to generate a computational vector field representation of fiber arrangements in 3D anatomical models using the Laplacian approach

(1)
 .
.Because termination only occurs at the attachment areas, a zero gradient is defined on the bulk surface. A uniform flux can be applied at the attachment surfaces such that the mass equation is respected, which allows for the generation of physically plausible fiber directions as demonstrated in skeletal muscle models in [17]. The Laplace equation can be solved using the finite element (FE) or finite volume (FV) method, but the calculation of the flux values across element faces in the FV method allows for a robust element-by-element tracing of the fascicle trajectories between the attachments as described in [17].
The workflow summarized in Fig. 1 provides a robust basis to computationally generate musculoskeletal fiber arrangements. However, many skeletal muscles are characterized by an architecture in which oblique fibers originate from narrow internal aponeurosis tendons embedded in the muscle bulk volume as illustrated in Fig. 2. Because the tendon inserts at a very shallow angle, an awkward geometry is obtained, generating topological conditions that make it difficult to generate a 3D volumetric mesh that is adequate for FE simulations of large deformations. As an alternative, we propose to incorporate a source term s in Laplace’s equation:
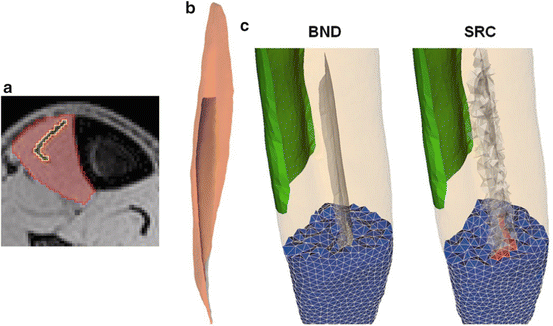

The tendon location is indicated by the source term, of which the distribution is assigned to elements in the volumetric mesh of the bulk muscle (Fig. 2). We have used algorithms from the VTK-library (www.vtk.org) to find the source elements as those intersecting with the segmented image voxels of the internal tendon. This approach allows to approximate the tendon location inside the muscle volume without having to include it in the surface reconstruction as attachment area.

Fig. 2
Comparison of the internal tendon representation of the tibialis anterior muscle (lower leg) using surface reconstruction (BND) and source term (SRC) approach: (a) MRI segmentation, (b) 3D surface reconstruction, (c) clipped volumetric meshes to illustrate the localization of the tendon. The proximal attachment is indicated in green

(2)
Some musculoskeletal soft tissues are characterized by multiple fiber families. The collagen fibers in the knee menisci are mainly organized in circumferential bundles, with sparse bundles in the radial directions [18]. Therefore, meniscus tissue is often modeled as an orthotropic material [13], which requires the definition of three perpendicular directions that reflects the multiple fiber anisotropy. Thedefinition of the circumferential f c and radial f r fiber orientations can be obtained by applying the Laplacian method with attachments at respectively the horns of the menisci and at the internal and external surfaces as illustrated in Fig. 6. For the radial fibers, a uniform value for the potential ϕ is applied as boundary condition to better reflect the radial orientations. Because the generated circumferential and radial fiber directions are not necessarily perpendicular, a similar approach as in the OpenKnee model [13] can be applied to define the local coordinate system e i for the orthotropic material symmetry:


(3)
3 Case Studies
The Laplacian method was evaluated in several examples of different musculoskeletal soft tissue organs. Three-dimensional anatomical models were constructed from segmentation of MRI images of which volumetric tetrahedral meshes were generated. The numerical implementations as described in [17] were used to construct the workflow, using Gmsh [19] as the mesh generator and the OpenFOAM package (www.OpenFOAM.com) as the FV solver.
The modified approach incorporating the source term (SRC) was tested in a model of the tibialis anterior muscle and contrasted against the original boundary attachment approach (BND). This muscle was selected to allow for a comparison with the results obtained in [17], which was shown to compare well with DT-MRI data presented in [20]. The tibialis anterior muscle is characterized by a long distal aponeurosis tendon that runs deep into the muscle, which divides the muscle into a deep and superficial compartment (Fig. 2). Following [17], the fascicle trajectory lengths of both compartments were analyzed, with trajectories traced from seed points defined on the deep and superficial side of the distal tendon (Fig. 3). The mean and standard deviation of the differences between both approaches expressed as percentage of the BND fascicle lengths were calculated as a measure of comparison. The overall agreement was further assessed by calculating the angle difference between the fiber orientation vectors as the inverse cosine of the dot product in the element centroids of the volume meshes generated in both approaches. To evaluate the impact on FE simulations of deformation, a comparison was also made between the fiber strains obtained for an isometric muscle contraction with 80 % muscle activation which was simulated in the FEBio software [21] with the muscle material model from [1] (Fig. 4).
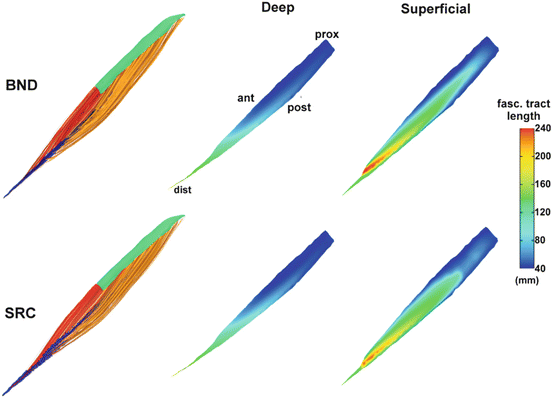
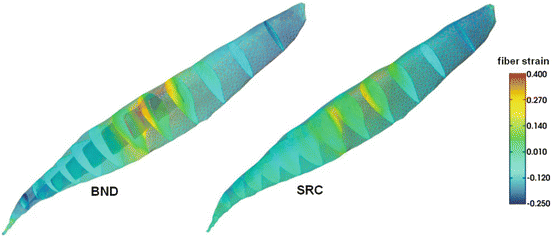

Fig. 3
Comparison of fascicle tract lengths between the BND and SRC approaches in a model of the tibialis anterior muscle. Samples of 3D fascicle trajectories for the deep (red) and superficial (yellow) compartments are shown in the left column (proximal and distal attachments shown in green and blue respectively). The fascicle lengths distributions mapped on the surfaces of the internal tendon for both compartments are shown on the right

Fig. 4
Comparison of fiber strain between the BND and SRC approaches in a simulation of isometric contraction with 80 % activation level in the tibialis anterior muscle. The proximal attachment area is indicated by the wireframe
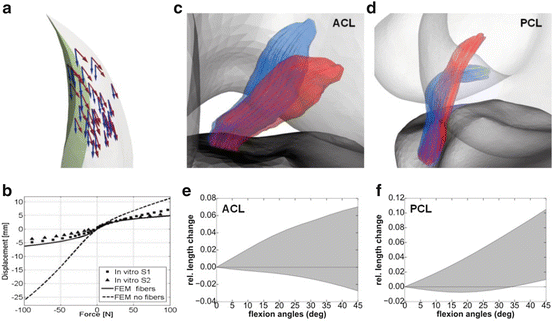
To demonstrate the feasibility for other musculoskeletal soft tissues, anatomical models of knee ligaments and menisci were considered. As a comparison between methods, the Laplacian approach was applied to the OpenKnee models of these structures (simtk.org/home/openknee) in which the fiber orientations are defined implicitly by the directions in the hexahedral meshes. The OpenKnee models of ligaments and menisci were remeshed with tetrahedral elements to calculate the Laplacian fiber field. In each element center of the OpenKnee hexahedral meshes, the Laplacian vector calculated in the tetrahedral element that contained the hexahedral element center was compared with the hexahedral fiber direction. The comparison of fiber vectors was performed with the same measure as in the tibialis anterior muscle case. Additionally, the Laplacian method was further evaluated in a second in-house developed anatomical knee model (Fig. 5). FE simulations of anterior–posterior displacement were performed in FEBio for two cases: (1) with ligament fibers and (2) without ligament fibers and using material parameters averaged between the fiber and transverse directions. The force-displacement relation or knee laxity was calculated and compared with experimental data (Fig. 6). Secondly, a rotational flexion of 45° around an axis fitted through the femur condyles [22] was also simulated in FEBio. Length changes of fascicle trajectories in the ligaments were calculated and compared with experimental studies presented in the literature (Fig. 6). For these simulations, the transverse isotropic Mooney–Rivlin was used as material model for the ligaments, following [13].
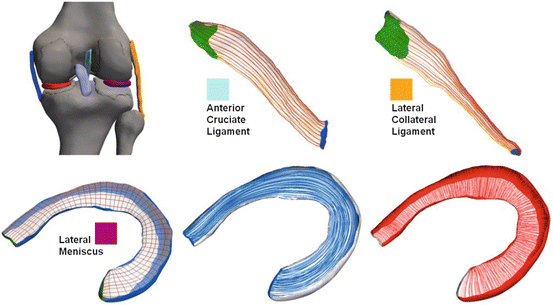

Fig. 5
Examples of Laplacian generated fiber traces (shown on the surface) in knee ligaments and menisci. The locations of the different structures are indicated by the color in the anatomical knee model shown in a posterior view in the top left corner. Generated circular (blue) and radial (red) fiber arrangements are shown for the lateral meniscus example in the bottom row
