Chapter 18 Clinical imaging in drug development
Introduction
Preclinical and clinical imaging has already made a significant contribution to drug development. Almost 30% of new molecular entities approved for neuropsychiatric indications by the FDA between 1995 and 2004 were developed with contributions from imaging (Zhang and Raichle, 2010) and there will be a growing need in drug development for information provided by imaging. New ways of thinking about clinical development are putting a premium on integration of early biology and clinical development in the context of ‘experimental medicine’.
Therapeutics development increasingly involves research that is hypothesis led, performed across levels of biological complexity (e.g. cells to the whole human), or inspired by concepts translated across species (e.g. mouse to man). Similar non-invasive imaging methods can be applied in both clinical and preclinical applications. Regulatory authorities also are putting an increasing emphasis on the need to have a deeper understanding of pharmacology and the biology of disease in approvals for new chemical entities, as well as the potential for delivering individualized therapies. The Critical Path Initiative (CPI) (www.fda.gov/ScienceResearch/SpecialTopics/CriticalPathInitiative/default.htm) sets out a strategy for transforming the way FDA-regulated products – drugs, biological products, medical devices and veterinary drugs – are developed and manufactured. Central to this is developing better evaluation methods (including specifically better imaging methods, as well as advancing genetics and bioinformatics – see also Chapter 7) and applying these to the acceleration of development of personalized medicine.
1. Target validation: does the chosen therapeutic target potentially play a central role in determining the disease or symptom of interest?
2. Biodistribution: does the molecule reach the tissue of interest in potentially pharmacologically active concentrations?
3. Target interactions: does the molecule interact with the target of interest? What is the relationship between administered dose and interaction with the target?
4. Pharmacodynamics: what are the effects of the drug and how long do they last?
5. Patient stratification and personalized medicine: how can the most responsive patient population be identified for more efficient clinical trials? How can a medicine be given in the clinic to patients who will experience the greatest benefit?
Imaging methods
Positron emission tomography (PET)
PET imaging relies on the design and manufacture of radiolabelled ligands which can bind selectively to a target of interest with minimal non-specific binding. These ligands are most typically labelled with positron-emitting radioisotopes that decay with a relatively short half-life (Table 18.1). The short half-life allows high enough doses to be administered for a strong imaging signal without substantially increasing long-term health risks associated with the ionizing radiation.
Table 18.1 Some examples of PET radioisotopes useful in drug development applications
| Radioisotope | Half-life (min) |
|---|---|
| 15O | 2.1 |
| 11C | 20.4 |
| 68Ga | 68 |
| 18F | 109 |
Functional magnetic resonance imaging (fMRI)
fMRI is based on indirect measures of neuronal response by being sensitive to changes in relative blood oxygenation (Jezzard, 2001). Increased neuronal activity is associated with a local haemodynamic response involving both increased cerebral blood flow and blood volume. This neurovascular coupling appears to be a consequence predominantly of presynaptic neurotransmitter release and thus reflects local signalling.
Human target validation
Human models can support target validation for symptom management. For example, sleep deprivation has been used as a model for mild cognitive impairment. FMRI can be applied as a probe for physiological changes specific to sleep deprivation-associated cognitive impairment to enable assessment of any responses to a test agent interacting with the target of interest (Chuah and Chee, 2008). In this instance, the ability of fMRI to report quantitatively on physiological modulation in specific functional anatomical regions relevant both to diseases of cognitive impairment and the model (e.g. the hippocampus) adds specificity to associated behavioural measures. Modulation of impaired hippocampal activation during memory tasks after sleep deprivation by a molecule interacting with a novel target provides compelling evidence supporting validation of the target for symptomatic treatment of disorders of memory.
An alternative concept for target validation in humans involves testing for modulation of disease-related brain systems by allelic variation at candidate target loci. This approach employs structural MRI or fMRI outcomes as endophenotypes (heritable quantitative traits). For example, indirect evidence has suggested that glycogen synthase kinase-3beta (GSK3β) and canonical Wnt pathway function contribute to the molecular pathology of major depressive disorder (MDD). Brain structural changes also have been associated with MDD. To test the hypothesis that GSK3β is relevant to the disease, variations in brain grey volume were associated with GSK3β polymorphisms in a mixed population of healthy controls and MDD patients to demonstrate an interaction between genetic variation and MDD (Inkster et al., 2009). Supporting evidence for a functional association also can come from similar analyses linking brain structural variation to genetic polymorphisms related to genes encoding multiple proteins contributing to the same signalling pathway (Inkster et al., 2010).
Functional imaging methods can be used in similar ways. Patients with a history of affective disorders carrying the S allele of the common 5-HTTLPR polymorphism in the serotonin transporter gene (SLC6A4) have an exaggerated fMRI response (in the amygdala) to environmental threat relative to L allele homozygotes (Hariri et al., 2002). Other work has supported hypotheses regarding genetic variation associated with other disorders. For example, polymorphisms linked to the genes DISC1, GRM3 and COMT all have been related to imaging endophenotypes for schizophrenia and associated with altered hippocampal structure and function (Callicott et al., 2005), glutamatergic fronto-hippocampal function (Egan et al., 2004) and prefrontal dopamine responsiveness (Egan et al., 2004), respectively.
Application of functional MRI approaches that define neurobiological bases for general cognitive processes (such as in the context of psychiatric disease, motivation or reward) facilitate understanding of the general importance of targets relevant to more than one disease. For example, fMRI approaches have contributed to the current appreciation for neural mechanisms common to addictive behaviours across a wide range of substance abuse states. Studies of cue-elicited craving have defined similar activities of the mesolimbic reward circuit in a range of addictions (e.g. nicotine (David et al., 2005)). Combination of fMRI with PET receptor mapping on the same subjects has the potential to relate systems-level dysfunction directly with the molecular targets of drug therapies to further speed target validation in appropriate circumstances.
With the potential to define the relationship between in vivo molecular pathology and disease expression, the relevance of a target can be inferred more confidently in some instances than is possible based on post-mortem studies only. For example, central to current therapeutic hypotheses for schizophrenia is targeting of dopamine receptor signalling. PET imaging with a receptor-specific radiotracer allows the receptor densities and distributions to be mapped in vivo in patient and healthy control populations. Using this approach, D2/D3 binding potential values have been shown to be abnormal in schizophrenics in both striatal and extrastrial regions and to vary with age (Kegeles et al., 2010).
A limitation of the PET measure, however, is that it does not distinguish between effects of abnormal receptor availability or dopamine release (and neurotransmitter occupancy of the receptor that reduces the free receptor available for binding to the radiotracer). To more specifically test the therapeutic hypothesis that dopamine receptor antagonism is relevant to schizophrenia, dynamic changes in receptor binding potential can be studied before and after an intervention modulating dopamine release. For example, dopamine depletion leads to a larger increase in PET D2 receptor availability in patients with schizophrenia than in healthy controls, suggesting a higher synaptic dopamine concentration in the patients (Kegeles et al., 2010).
The relevance of a target to symptoms or behaviours can be validated in a similar fashion. For example, because dopamine is known to be an important mediator of the reinforcing effects of cocaine, it was hypothesized that alterations in dopamine function are involved in cocaine dependence. To validate dopamine receptor modulation as a therapeutic target for the treatment of drug dependence, pre- and postsynaptic dopamine function were characterized by assessing the receptor-specific binding of a PET radiotracer in recently detoxified cocaine-dependent subjects and related directly to drug-seeking behaviour in the same group of subjects (Martinez et al., 2007).
Biodistribution
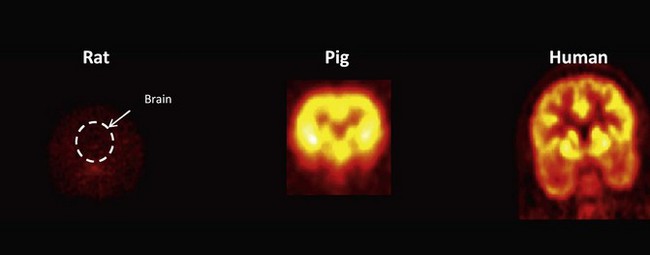
Microdialysis can provide accurate measurements of the free concentration of a drug in the brain or other organ or direct assays of tissue uptake can be performed on biopsies or performed post mortem. However, because of its relative inaccessibility, whether a drug intended for a CNS target crosses the blood–brain barrier in sufficient amounts to be pharmacologically active can be very difficult to answer early in new drug development using conventional approaches to Phase I and IIa studies (see also Chapter 10). Confidence in extrapolation of measures directly from rodents to humans is limited (Figure 18.1). Recognized species differences in blood–brain barrier penetration are related to species-specific patterns of expression of transport enzymes, for example. PET provides the most general method for assessing distribution of a drug molecule. Imaging biodistribution can answer the question: does a molecule reach the tissue of interest in concentrations high enough to be potentially pharmacologically active?
Moreover, if the plasma free concentration of the labelled molecule is measured and it is assumed that the molecule distributes passively, measures over the time course to a steady-state distribution allow an estimation of the tissue free concentration (Slifstein and Laruelle, 2001). Defining the volume of distribution of a molecule along with measurement of the plasma free concentration allows the occupancy of a receptor (OR) to be estimated if the assumption that the in vitro and in vivo KD are equivalent, where:
The passive distribution model does not hold in situations in which there is high expression of active transporters for the molecule of interest, such as P-glycoprotein, at the blood–brain barrier. Evidence for transporters can be derived from demonstration of exclusion of tracer doses of the radiolabelled molecule but increasing tissue uptake with increasing plasma concentrations of the unlabelled molecule or after a transporter inhibitor is administered (Loscher and Potschka, 2005).
While the greatest application of biodistribution studies thus far has been in the development of CNS drugs, biodistribution studies should also play an important role in optimizing anticancer drugs, as up-regulation of pumps that may exclude drugs from tumours is well described. When a pump mechanism is suspected, then the dependence of distribution on the dose of the unlabelled molecule can be explored. This approach was used to characterize the brain and tumour distribution of temozolomide, an alkylating agent used in the treatment of brain tumours. Normal brain and brain tumour temozolomide concentration profiles were estimated for different temozolomide dosing regimens. A relatively impaired plasma–tissue barrier in the tumour (presumed to be related to both breakdown of the blood–brain barrier and tumour angiogenesis) was demonstrated for the drug (Rosso et al., 2009).
A creative extension of the traditional biodistribution experiment was demonstrated in use of the differential distribution of alternatively labelled molecules to provide information on drug metabolism directly from the PET experiment. The approach demands sophisticated radiochemistry, but provides an elegant reminder that what is measured by PET is the distribution of the label, not the molecule specifically. Temozolomide undergoes decarboxylation and ring opening in the 3–4 position to produce the highly reactive methyldiazonium ion that alkylates DNA. To evaluate this directly in humans, a dual radiolabelling strategy was employed in which [11C]temozolomide was radiolabelled separately both in the 3-N-methyl and 4-carbonyl positions. 11C in the C-4 position of [4-11C-carbonyl]temozolomide will be converted to [11C]CO2 and an inactive metabolite. Paired studies were performed with both forms of [11C]temozolomide in 6 patients with gliomas. A third PET scan was performed with 11C-radiolabelled bicarbonate to provide data allowing quantitative modelling of the labelled CO2 release from the independently performed temozolomide experiment. Data were obtained on activities of [11C]temozolomide and [11C]metabolites in plasma collected during scanning and [11C]CO2 was measured in the expired air. Greater amounts of [11C]CO2 in the plasma and exhaled air and lower tumour [11C]temozolomide signal with the [4-11C-carbonyl]temozolomide relative to that labelled in the 3-N-methyl position confirmed ring-opening as a mechanism for metabolic activation of temozolomide (Saleem et al., 2003).
Monoclonal antibodies and other biopharmaceuticals are becoming an increasingly important part of new therapeutics development. An increasing range of methods are available for labelling such large molecules with positron emitting isotopes in well-defined ways (van Dongen and Vosjan, 2010). Because of the much longer distribution times for these large molecules, long-lived position emitters such as 89zirconium, 64copper or 124iodine have been used. Considerable information potentially is available, but the slow approaches to steady-state and the distinct range of non-specific interactions and metabolism of these large molecules makes the conduct and interpretation of these studies more challenging than for small molecules. While promising, this area still is in an early stage of development. There are special challenges in defining a meaningful distribution for radiotracers with very high affinities (especially if the binding site availability [Bavail] also is high), as the distribution may reflect delivery (blood flow) more than the distribution of specific binding sites.
Stay updated, free articles. Join our Telegram channel

Full access? Get Clinical Tree


