Fig. 9.1
Analytical characterization of IgG1 monoclonal antibody solutions containing soluble aggregates measured by orthogonal methods, SE-HPLC (a, b, c) and SV-AUC (d, e, f). Protein aggregates of varying size and composition were formed by exposure to different environmental stresses: (a, d) control, (b, e) heating under acidic pH conditions, and (c, f) light exposure. Adapted from Bond et al. (2010)
Several investigations have now appeared using SV-AUC to confirm the results obtained with SE-HPLC, specifically to verify a lack of effect of SE-HPLC sample handling and mobile phase conditions on aggregate formation and dissolution (Berkowitz 2006; Hughes et al. 2009). In one interesting example with a complex protein, Hughes and colleagues quantitatively investigated the ability of SE-HPLC and SV-AUC to detect known amounts of protein aggregates of recombinant human acid alpha-glucosidase (rhGAA), an enzyme with seven N-lined glycosylation sites and an apparent molecular weight of 110 kDa. Overall, the authors found a good correlation between the two methods, since the amount of the soluble aggregates measured was not statistically different (Hughes et al. 2009) (Table 9.1). It should be pointed out, however, that other studies in the literature have found significantly higher percentages of soluble protein aggregates when measured by SV-AUC compared to SE-HPLC. This suggests that the SE-HPLC approach may require additional method development to prevent aggregate adsorption to the column matrix with certain proteins. For example, in work by Gabrielson et al. with a recombinant humanized mAb (Gabrielson et al. 2007), SV-AUC detected one major peak and three minor peaks, while SE-HPLC only detected one major and one minor peak. In the same study, FFF and SV-AUC were compared as orthogonal methods to monitor the amount of soluble aggregates. It was shown that both SV-AUC and FFF not only detected much higher amounts of aggregates compared to SE-HPLC but also found additional HMW species. Nonetheless, it should be pointed out that although FFF has no stationary phase (Fraunhofer and Winter 2004; Liu et al. 2006), protein samples can undergo concentration and dilution stages in FFF in which protein aggregates may differentially interact with the medium and affect the amount of reversible aggregate in the sample (Mahler et al. 2009; Reschiglian et al. 2005; Liu et al. 2006).
Table 9.1
Quantitative analysis of aggregate levels as determined by SV-AUC and SE-HPLC for forced degraded samples of recombinant human acid alpha-glucosidase (rhGAA)
rhGAA forced aggregate (%) | |||||||||
|---|---|---|---|---|---|---|---|---|---|
0 | 0.25 | 0.5 | 1.25 | 2.5 | 4 | 5 | 10 | 20 | |
% Aggregation (AUC), N = 6a | 0.4 | 0.9 | 0.6 | 1.3 | 2.5 | 3.1 | 4.2 | 8.5 | 18.1 |
SD | 0.3 | 0.7 | 0.4 | 0.5 | 1.1 | 0.3 | 0.4 | 0.7 | 1.3 |
RSD (%) | 67.0 | 84.0 | 69.4 | 35.7 | 44.0 | 8.8 | 10.4 | 8.1 | 7.0 |
% Aggregation (SEC), N = 9 | 0.2 | 0.3 | 0.5 | 1.0 | 1.9 | 3.0b | 4.1 | 8.4 | 17.5 |
SD | 0.02 | 0.03 | 0.02 | 0.04 | 0.03 | 0.04 | 0.04 | 0.04 | 0.42 |
RSD (%) | 9.2 | 10.8 | 3.7 | 3.7 | 1.6 | 1.2 | 1.0 | 0.5 | 2.4 |
A third example employs CE-SDS and d-SEC to characterize aggregate formation in a monoclonal antibody solution under denaturing conditions. One of the first studies to utilize both CE-SDS and SDS-PAGE for the quantitative analysis of a recombinant humanized monoclonal antibody (rhuMabHER2) was performed by Hunt et al. (1996). Both methods detected seven peaks in a nonreduced sample that correlated well with the seven bands observed for HER2 mAb on SDS-PAGE. The relative peak areas percent ascribed to high molecular mass aggregate observed on CE-SDS were consistent with that seen with SEC. The method, however, was found to be less sensitive than SDS-PAGE with silver staining in detecting minor species under reducing conditions. To improve sensitivity, precolumn derivatization with fluorogenic reagents coupled with laser-induced fluorescence (LIF) detection are now routinely used in CE-SDS analysis (Michels et al. 2007; Salas-Solano et al. 2006). Using this improved methodology, the ability of d-SEC and CE-SDS to determine the level of nonreducible, cross-linked protein in a degraded monoclonal antibody solution was evaluated (Fig. 9.2). SE-HPLC was initially used to establish the presence of monomer, dimer, and HMW aggregates. These species were then evaluated for the presence and absence of reducible and nonreducible cross-linked proteins under denaturing conditions by both d-SEC and CE-SDS (Fig. 9.2). Although both methods showed similar trends, the CE-SDS technique provided better resolution and an improved ability to quantify the levels of these aggregates (Michels et al. 2007).
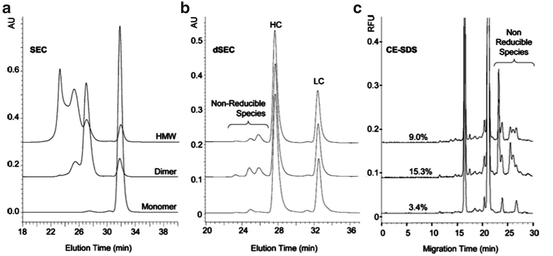

Fig. 9.2
Analytical characterization of monomers, dimers, and high molecular weight (HMW) aggregates of a monoclonal antibody as measured by SE-HPLC (native-like conditions) and d-SEC and CE-SDS (denaturing conditions). (a) SE-HPLC, (b) d-SEC, and (c) CE-SDS with indicated levels of percent nonreducible aggregates. Published in Michels et al. (2007)
9.2.3 Case Studies Characterizing Physical Composition and Biological Activity of Soluble Protein Aggregates
Despite recent advances in the use of biophysical methods to better characterize the higher-order structure and conformational stability of proteins, especially when combining multiple techniques with advanced data analysis approaches (Maddux et al. 2011), the determination of a protein’s biological activity remains the “gold standard” in terms of monitoring subtle conformational changes. Two case studies are presented in this section, first demonstrating correlations of certain physical properties of protein aggregates with biological activity (Remmele et al. 2006) and second showing how biophysical binding assays using biosensors (SPR) can be employed to assess the Fc receptor binding activities of different aggregates and complexes of two different monoclonal antibodies (Luo et al. 2009).
In the case of an IgG1 monoclonal antibody (epratuzumab), samples were shown to contain both monomers (~150 kDa) and dimers (~300 kDa). The dimers contained ~70% covalent cross-links (as measured by CE-SDS) and consisted of three different assemblies including Fab-Fab, Fc-Fc, and Fab-Fc complexes. The biological activity of the dimers, in terms of relative potency in a cell-based bioassay, was shown to be twice that of the monomer (i.e., equal activity on a weight basis indicating that the dimer has twice the number of binding sites as the monomer) (Remmele et al. 2006). A more recent investigation examined the binding affinities of different mAb complexes and aggregates using an SPR biosensor (Luo et al. 2009). Similar to the previous study, monomeric and aggregated forms of the mAbs had similar antigen-binding properties in the Fab region. It was demonstrated, however, that the monomers and aggregates showed differences in their Fc region’s ability to bind different Fc-gamma receptors. As shown in Fig. 9.3a, b, the monomeric form of mAb1 manifested different binding properties to both the Fc-gamma RIIA and Fc-gamma RIIIB receptors compared to the dimeric aggregate and a multivalent immune complex formed between mAb1 and its antigen. Similar results are shown in Fig. 9.3c, d for monomeric mAb2, high molecular weight aggregates of mAb2, and a multivalent immune complex formed between the mAb2 and its antigen. The dimers and multimers of these mAbs showed higher in vitro binding affinities to Fc-gamma receptors as well (Luo et al. 2009).
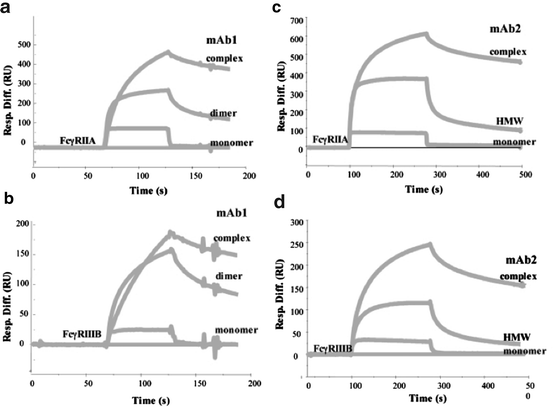

Fig. 9.3
The Fc receptor binding of the immune complexes and aggregates of mAb1 (a and b) and mAb2 (c and d) as measured by SPR binding assays. Two different Fc receptors were evaluated: FcγRIIA (a and c) and FcγRIIIB (b and d). The SPR sensorgrams for the binding of mAb monomer, dimer/HMW, and their immune complexes (containing 1:1 molar ratio of monomeric antibody and multivalent antigen) are overlaid. Published in Luo et al. (2009)
9.2.4 Case Studies Characterizing Soluble Protein Aggregates by Mass Spectrometry
Although the use of mass spectrometry to better characterize soluble protein aggregates formed during storage has been more limited in its applications to date, MS has been pursued for many years to better characterize well-ordered amyloid fibril protein aggregates. For example, nanoflow ESI combined with Q-TOF mass spectrometer has been utilized to study the self-assembly, aggregation, and amyloid fibril formation of insulin under different conditions (Nettleton et al. 2000). Another example is the use of ESI-quadrupole MS to quantify β(beta)-amyloid monomers in the presence of potential therapeutic agents and to identify and rank order the compounds which inhibit the aggregation of β(beta)-amyloid monomers (Cheng and van Breemen 2005). The initial applications of MS technology to characterize protein aggregates under pharmaceutical conditions have combined chromatographic separations with subsequent MS analysis. For example, Van Buren et al. characterized dimers of an IgG after isolation and enzymatic digestions (Van Buren et al. 2009). A combination of SE-HPLC, sample dialysis, and ESI-TOF MS was recently used to identify and characterize different IgG aggregates (Kukrer et al. 2010). In addition to complex sample handling with limited throughput, these MS approaches have certain limitations including potential changes in the aggregate profile during sample dialysis and a bias of MS results toward lower MW species when monitoring a sample containing a mixture of oligomers (Kaltashov et al. 2012).
More sophisticated MS approaches are now being developed to examine and characterize protein aggregates without these experimental limitations as described in the following three case studies: (1) use of EDI-MS to directly monitor in real-time heat-induced protein deformation and aggregation (Wang et al. 2011), (2) use of ion mobility MS to characterize intact protein assemblies in the gas phase, and (3) the use of H/D exchange-MS to characterize different proteins (Kheterpal and Wetzel 2006; Zhang et al. 2011, 2012).
As temperature increases, loss of a protein’s conformational integrity results in formation of high-charge-density ions and oligomers that can be easily identified by higher m/z ratios. A new design of a temperature-controlled ESI source not only permits direct monitoring of protein unfolding and aggregation but also ensures the efficiency of the heating process and prevents cooling of the protein solution during the sample introduction to the ESI interface (Wang et al. 2011). With this new approach, both reversible and irreversible protein unfolding events were captured by ESI-MS for cytochrome-C and glucocerebrosidase (GCase), respectively. The ability of ESI mass spectra to directly monitor the formation of dimers, trimers, tetramers, and pentamers during heat treatment of GCase is shown in Fig. 9.4.
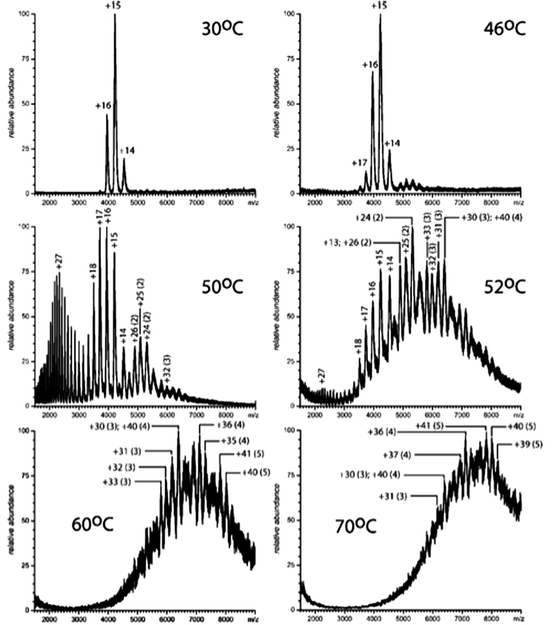

Fig. 9.4
Electrospray ionization (ESI) mass spectra of glucocebrosidase (GCase) in 20 mM ammonium acetate, pH 4.7 recorded at various solution temperatures. The numbers without parentheses indicate charge states of the GCase monomers; the numbers in parentheses indicate the size of the protein associations. Published in Wang et al. (2011)
Ion mobility spectrometry (IMS) is an analytical technique used to separate and identify ionized molecules in the gas phase based on their mobility in a carrier buffer gas. When coupled with mass spectrometry, ion mobility mass spectrometry (IM-MS) enables the separation and detection of isomers and conformers. More recently, the technology (also referred to as native MS) has been successfully used to characterize larger macromolecules, such as proteins and their biological complexes, in the gas phase (Uetrecht et al. 2010). Although Native MS has been employed to examine the composition and stability of numerous large biological complexes, confirmation of results with other methods (examining the same protein complex in the solution state) is typically performed (van Duijn 2010). Kaddis et al. used ESI-IMS to study the general size dimensions of proteins as protein molecules were physically transitioned from the solution to the gas phase (Kaddis et al. 2007). Traveling voltage-wave ion mobility mass spectrometry (TWIMS) is a recent advancement in the technology coupling an ion mobility unit to Q-TOF MS. The application of TWIMS to the characterization of hepatitis B viral capsids (MW of ~3,000 and ~4,000 kDa) as well as GroEL and its complexes with smaller proteins (MW of 801 and 857 kDa, respectively) has been recently reviewed (Uetrecht et al. 2010).
Hydrogen–deuterium exchange linked to MS (H/D exchange-MS) analysis has been used to probe the secondary structure of amyloid fibrils of insulin (Kheterpal and Wetzel 2006). This work combined an ESI-MS system with a bottom-up experimental approach (peptide mapping). First, protonated fibrils were collected by centrifugation, washed, resuspended, and incubated in deuterated buffer to promote exchange of labile protons with deuterium. Second, the exchange reaction was quenched and the fibrils were disaggregated. Finally, the monomers were subjected to proteolysis and analyzed by MS. The results showed that both the N- and C-terminal segments (1–19 and 35–40) are readily exchangeable (not involved in the core structure), whereas the fragment containing residues 20–34 was highly protected from exchange. H/D exchange-MS has also been used to the study of the effect of protein flexibility and sequences on protein aggregate formation with biopharmaceutical products including interferon-gamma (Tobler and Fernandez 2002) and, more recently, with the model enzyme lactate dehydrogenase (LDH) (Zhang et al. 2011) as well as a monoclonal antibody (Zhang et al. 2012). For smaller proteins such as interferon-gamma and LDH, the rate of H/D exchange can be monitored in the intact protein, as well as at the peptide level (after digestion with pepsin), to identify sites of increased and decreased flexibility. In contrast, due to their large size, mAbs are only analyzed after pepsin digestion and H/D exchange reactions must be carefully examined across hundreds of peptides. The H/D mass spectra of native and freeze-thaw (F/T)-induced aggregates of LDH are shown in Fig. 9.5. It can clearly be seen that F/T-induced aggregates consist primarily of unfolded protein. Peptide level analysis identified several short sequences (13–31, 109–117, and 133–143) with moderate protection from H/D exchange indicating that these sequences may be the regions of intermolecular interactions within the LDH aggregates induced by freeze-thaw (Zhang et al. 2011). In contrast, in the case of a monoclonal antibody, F/T aggregates had similar H/D protection maps compared to soluble protein, indicating a primarily native-like conformation (Zhang et al. 2012).
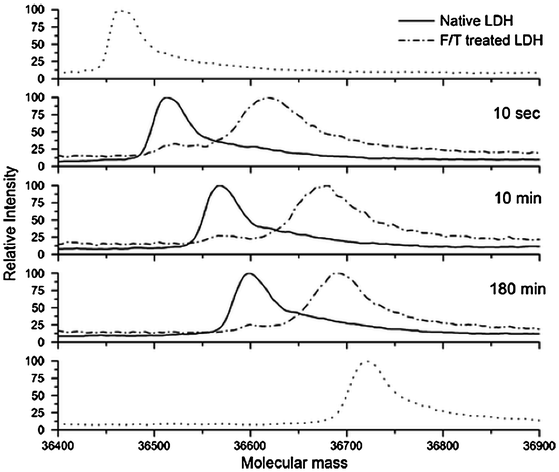

Fig. 9.5
Hydrogen–deuterium exchange mass spectrometry (H/D-MS) spectra of native lactate dehydrogenase (LDH) and freeze/thaw aggregated LDH obtained after 10 s, 10 and 180 min of deuterium labeling. The dotted spectra in the top and bottom panels are unlabeled and fully labeled controls, respectively. Published in Zhang et al. (2011)
9.3 Case Studies Using Biophysical Methods to Count, Size, and Characterize Protein Submicron Particles
9.3.1 Overview of Analytical Methods Used in Selected Case Studies to Evaluate Submicron Protein Particulates
The development of improved analytical approaches to examine the size, amount, and nature of protein particles in the size range of 0.1–1 μm is an ongoing challenge (Carpenter et al. 2009). Some currently available approaches include DLS techniques, either as stand-alone instruments or connected to a microscope [nanoparticle tracking analysis (NTA)]. In addition, more sensitive microscopic techniques, most frequently used to characterize protein-based amyloid fibrils, are being evaluated for applicability to better characterize pharmaceutical protein aggregates. These include atomic force microscopy (AFM), transmission and scanning electron microscopy (TEM and SEM), as well as quartz crystal microbalances (QCMs). A brief overview of the key analytical techniques used in the case studies presented in this chapter is provided below, followed by a few illustrative examples from the literature which have employed useful combinations of these techniques.
9.3.1.1 Nanoparticle Tracking Analysis
NTA is a laser-illuminated-based microscopy technique that detects and sizes submicron particles in the range of ~50–1,000 nm. NTA individually tracks and sizes particles moving under Brownian motion. With a knowledge of the viscosity and temperature of the sample, the instrument calculates the diffusion coefficient which can then be used via the Stokes–Einstein equation to calculate the hydrodynamic size. This new analytical technique is currently being assessed by several groups to detect protein aggregates and particulates that have not been accurately analyzed previously (Filipe et al. 2010, 2011; Engelsman et al. 2011).
9.3.1.2 Atomic Force Microscopy
An atomic force microscope (AFM) consists of a cantilever with an ultrasharp tip (probe), a sample stage, and an optical deflection system (Colton et al. 1997). During AFM measurements, the cantilever is brought into close (atomic) contact with the sample and scanned across the surface (contact mode). The interaction between probe and sample, which can include mechanical contact, van der Waals, capillary, electrostatic, and/or magnetic forces, causes the bending of the cantilever which is precisely recorded by an optical deflection system. The scanning is done under feedback control so that the bending of the cantilever remains constant to maintain a constant force. The up and down motion of the sample is a record of the sample topography. In the tapping mode, which senses the oscillation amplitude of cantilever instead of bending, AFM generally causes less damage to sample. For analysis of biological materials such as protein aggregates, tapping mode AFM is preferred. One key limitation of AFM is it can only analyze a small fraction of the total sample volume at any one time.
9.3.1.3 SEM and TEM
Scanning electron microscopy (SEM) and transmission electron microscopy (TEM) are standard tools used in biological research to examine a wide variety of samples due to their high resolution (from several nanometers to microns). Both SEM and TEM can also be used to characterize protein aggregates in the submicron size range. These techniques use an electron beam to bombard a specimen and generate various types of electron scattering (Joseph Goldstein et al. 2003; David Bernard Williams 2009). In the case of transmission electron microscope (TEM), electrons that go through a specimen (forward scattering) are collected and analyzed to provide image-based information on sample size and shape. The scanning electron microscope (SEM) collects the secondary and backscattered electrons to provide data not only on 2D sample size but also surface topology. Sample preparation remains a challenge for TEM and SEM (which requires fixation, staining, and drying) in terms of ensuring the size and morphology of the sample do not change during preparation and analysis. Fortunately, recent advances in cryotechniques (rapid freezing in liquid ethane near liquid nitrogen temperatures) can minimize such problems by analyzing samples in the frozen liquid state. TEM and SEM analysis is also limited by sampling frequency, requiring acquisition of numerous images to provide a representative analysis of the sample to determine particle number and size.
9.3.1.4 Quartz Crystal Microbalance
A new approach to monitor submicron protein particulates in solution is the QCM (Ferreira et al. 2009). A thin quartz disk is sandwiched between two metal electrodes. When an alternating electric field is applied, a shear deformation will be generated due to the piezoelectric nature of the quartz material. When the mechanical oscillations are close to the fundamental frequency of the crystal, a resonant oscillation is achieved. Changes in the resonant frequency are related to the mass accumulated on the crystal (Sauerbrey 1959). Commercial systems are designed to reliably measure mass changes up to ~100 μg (microgram) with a sensitivity of ~1 ng cm−2 (O’Sullivan and Guilbault 1999). Although QCM has been used successfully in other fields (e.g., vacuum deposition, thin film deposition control), application to biological samples has been limited due to its inherent nonspecificity. Recently, chemical modification of the electrode surface enabled the real-time study of bovine insulin aggregation to form amyloid fibrils (Knowles et al. 2011). Immersion of resonators into aqueous solutions, however, significantly reduces their resolution due to the damping effect of solution viscosity (Burg et al. 2007). A recently developed nanomechanical resonator, Archimedes, contains a solution channel inside a hollow resonator that is surrounded by vacuum to overcome this damping effect. As a result, Archimedes has improved mass resolution (orders of magnitude) over a commercial QCM for aqueous measurements (Burg et al. 2007).
9.3.2 Case Studies Involving Counting and Sizing Submicron Protein Particles
In a comparative study by Filipe et al. (2010), the ability of NTA and DLS to size submicron particulates using polystyrene bead standards of various sizes was initially examined. Although both techniques can accurately size monodisperse standards, NTA offers the advantage of also being able to count the number of particles in the sample. In addition, it was possible to visualize the particles in the samples using NTA. When particle standards of different sizes were mixed together, NTA can more easily distinguish their relative amounts compared to DLS. In this study, DLS detected the largest particle standard in a mixture, while NTA detected each of the standards and thereby did not skew the reported size distribution. The formation of submicron-sized protein aggregates was then monitored with heat treated IgG and metal-oxidized insulin. NTA was again better at analyzing sample polydispersity than DLS. As shown in Fig. 9.6, NTA can be used to monitor particle counts and size distribution in real time during the formation of IgG submicron-sized particulates during heating at 50°C. Recently, Filipe et al. used NTA in conjunction with fluorescence single-particle tracking analysis to obtain the size of fluorescently labeled monoclonal IgG and HSA when subjected to heat stress (Filipe et al. 2011).
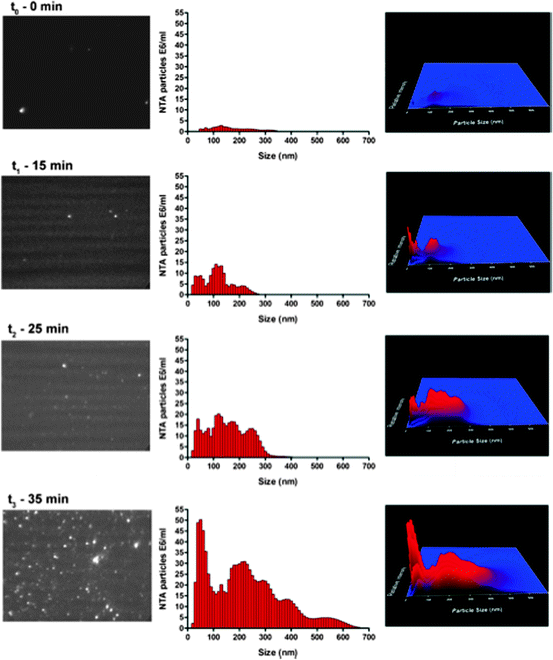

Fig. 9.6
Monitoring of IgG aggregation and submicron particle formation at 50°C in the NTA (NanoSight) instrument sample chamber. The size distribution (middle panels) with the corresponding NTA video frame (left panels) and 3D graph (size vs. intensity vs. concentration, right panels) are shown. Published in Filipe et al. (2010)
Nanomechanical resonators, including QCMs, have achieved extraordinary sensitivity in the detection of mass accumulation on surfaces in a vacuum. The detection of most bimolecular samples, however, requires a solution environment. As described above, a recently developed nanomechanical resonator, Archimedes, includes a solution channel inside a hollow resonator that permits solution measurements (Burg et al. 2007). This device is able to measure the mass of objects that are not attached to the resonator surface, such as floating polystyrene beads, agglutinating microspheres, and bacteria (Burg et al. 2007; Rumi Chunara et al. 2007; Michel Godin et al. 2007). The instrument vendor’s website (http://www.affinitybio.com/applications/protein_formulations.php) provides examples (from currently unpublished data) of the detection of submicron-sized IgG aggregates. Both size and number distributions of protein particles in solution can be displayed in the form of a histogram.
9.3.3 Case Studies Which Characterize the Morphology of Submicron Protein Particles
To better characterize the morphology and size of submicron protein particles, microscopic techniques such as AFM and TEM have been successfully used. Tapping AFM has been used for several years to study the in vitro formation of amyloid fibrils. For example, the process of in vitro generation of amyloid fibrils by seeded polymerization has been examined (Harper et al. 1997). In addition, a variety of biophysical techniques including AFM were utilized to study the aggregation and disaggregation of an amyloidogenic protein, human muscle acylphosphatase (Calamai et al. 2005). In this work, it was observed that globular aggregates from 100 to 200 nm and larger aggregates (>5 μm) were the dominant species as the aggregation time increased. Interestingly, upon diluting the protein solution, a variety of fibrillar structures was observed with AFM indicating disaggregation of the larger protein complexes.
In terms of pharmaceutical applications, tapping mode AFM has been recently used to better characterize the nature of the aggregation of monoclonal antibodies (Cao et al. 2010; Lee et al. 2011; Mach and Arvinte 2011). In one such study, most of the mAbs manifested similarly sized aggregation intermediates on the order of several monomers. The subsequent agglomeration of these intermediates into larger particulates, however, was dependent on solution conditions as evaluated by AFM images (Lee et al. 2011). For example, monomeric mAb1 had an average size of ~15 nm. Upon heat treatment, the presence of oligomeric structures was seen when the sample was diluted into water. In contrast, when the heat-treated mAb1 sample was diluted with saline, agglomerates of the oligomer structures began to appear. The morphology and size of the agglomerates appeared to differ between the different mAbs examined suggesting protein-specific and/or stability-dependent mechanisms. For example, as shown in Fig. 9.7, mAb3 formed submicron-sized particles with amorphous morphology containing agglomerates of smaller sized oligomers. These investigators point out some of the analytical limitations of studying protein particle formation with AFM including a very small fraction of total sample volume being examined as well as the sample preparation process potentially producing artifacts. As a result, at least one orthogonal method was recommended to confirm the results from AFM.
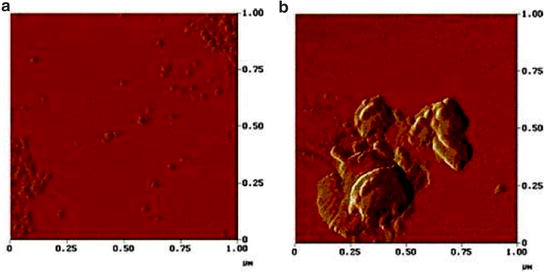

Fig. 9.7
Atomic force microscopy (AFM) visualization of submicron-size protein particles from a monoclonal antibody solution: (a) mAb aggregate (in water), (b) the same mAb aggregate in different viewing area. Published in Lee et al. (2011)
Although numerous groups have used TEM to study and characterize the structure of amyloid fibrils (Nettleton et al. 2000; Kheterpal and Wetzel 2006), TEM has not been widely used to characterize protein aggregates and particles from a pharmaceutical perspective. One group combined quantitative rheology measurements and negative stain TEM to study the assembly of monoclonal antibody into highly ordered structures in the presence of multivalent carboxylate ions (Esue et al. 2009). As shown in Fig. 9.8, TEM images demonstrate smaller bundles that were composed of straight, single filaments with an average diameter of 4 nm. In addition, the presence of larger bundles with diameters as large as 200 nm, containing midsized bundles from 29 to 55 nm in diameter, was observed by TEM. This type of detailed morphological information is currently only available from TEM studies. Sample preparation, however, involves the drying of the sample, again inducing possible sample preparation artifacts. The use of cryo-TEM to examine the morphology of protein particles in the liquid state will be of great interest in future studies.
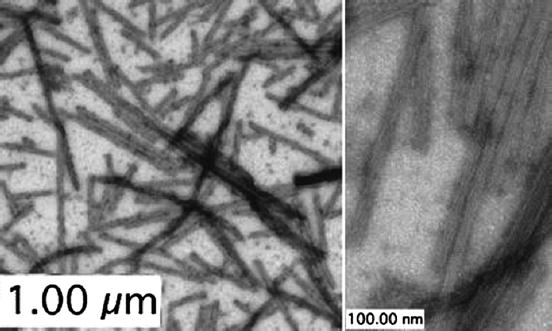

Fig. 9.8
Transmission electron microscopy (TEM) visualization of submicron and subvisible protein particles from a monoclonal antibody solution containing citrate. Analysis of micrographs showed large bundles containing smaller filament bundles. Individual straight filaments were of varying lengths and had an average diameter of 4 nm. Scale bars are 1 μm and 100 nm. Published in Esue et al. (2009)
9.4 Case Studies Using Biophysical Methods to Count, Size and Characterize Protein Subvisible and Visible Particles
9.4.1 Overview of Analytical Methodologies from Case Studies Used to Evaluate Subvisible and Visible Protein Particles
Current analytical methods utilized to count and size subvisible and visible particulates in the size range of 1–100 μm and over 100 μm, respectively, include coulter counter, light obscuration (LO), microflow digital imaging (MFI), light microscopy, and visual assessments. Techniques employed to better characterize the morphology and composition of subvisible and visible protein particulates include zeta potential measurement, flow cytometry, fluorescence, and FTIR microscopy as well as SEM-EDX. A brief discussion of each technique will be presented below followed by relevant case studies that have incorporated these techniques to size, count, and characterize subvisible and visible protein particles.
9.4.1.1 Coulter Counter
The Coulter method counts subvisible particles in the size range of ~0.5–50 μm (micrometer). Unlike LO and MFI, the Coulter method does not rely on the optical characteristics of the particles, but rather on the perturbation of an electric field. Single particles flow through a pore and electrical pulses are generated, which produce a change in conductance. This change is directly proportional to the particle volume. To measure a change in conductance, the Coulter method requires a conductive buffer to permit an electric field to form. In some cases, this can be accomplished by adding a small amount of highly concentrated NaCl (or other electrolyte) to the buffer (Barnard et al. 2012). Since only single particles can transverse the pore, the sample must be diluted. Both dilution and the addition of salt during sample preparation are of concern when monitoring protein particulates since these steps may either disassociate aggregates or induce their formation. Until recently, Coulter counter measurements required large sample volumes (10 ml), but newer instruments have significantly decreased sample volumes to as little as ~0.1 ml (Barnard et al. 2012; Rhyner 2011; Roberts et al. 2012). These reduced sample volumes are far more practical for use with protein containing samples.
9.4.1.2 Light Obscuration
The principle of light obscuration (LO) is simple: the sample is passed through a chamber containing a light source. The amount of light that is blocked is directly proportional to the number and size of the particles. This technique is widely used as the “gold standard” for measuring subvisible particles in pharmaceutical applications since both US and EU pharmacopeia methods have been described. The concentration and size of particles ranging from 2 to 100 μm (micrometer) can be determined. Advantages of this technique include speed and the ability to cover the entire subvisible size range in a single measurement. Disadvantages of LO include a lack of morphological information and potential artifacts arising from air bubbles. Therefore, samples are typically degassed prior to analysis (Huang et al. 2009; Chrai et al. 1987). In addition, LO has been shown to undercount the number of proteinaceous subvisible particles as described in more detail below.
9.4.1.3 Microflow Digital Imaging
Microflow imaging (MFI) is a flow microscopy technique in which a sample is drawn through a flow cell by a peristaltic pump. As the sample slowly transverses the flow cell, bright-field images are illuminated by a 475 nm LED light source, magnified, captured by a digital camera, and then processed by the instrument software. Information about particle counts, size, and morphological characteristics can all be obtained from MFI measurements. Since MFI does not rely on the blockage of light, translucent protein particles are more readily detected and included by this analysis (Huang et al. 2009; Wuchner et al. 2010). Another advantage of MFI is that it can distinguish between silicone oil droplets, air bubbles, and protein aggregates based on morphological characteristics (Sharma et al. 2010a; Strehl et al. 2011; Liu et al. 2011).
9.4.1.4 Light Microscopy and Visual Assessments
During analysis by light microscopy, particles in solution are drawn through a grid-lined filter, dried, and either observed by a standard light microscope or subsequently stained with fluorescent or nonfluorescent dyes to enhance resolution (Li et al. 2007; Demeule et al. 2007a, 2009). Particles can then be counted manually or by automated methods. Advantages of staining protein aggregates include enhanced detection of smaller particles and the selective binding of certain dyes to proteinaceous particles (Li et al. 2007; Rosenberg et al. 2009). Artifacts resulting from sample preparation, handling, and/or filtering are again the major pitfalls in using microscopy. In addition, particles <10 μm can be difficult to visualize and care should be taken to ensure amorphous or fibril shaped particles do not pass through the filter.
Visual assessments of protein-containing solutions for visible particles suggest a straightforward process, but complications can arise due to a variety of factors, that is, the method setup (lighting, distance, background), training of the analyst (physical abilities of the individual performing the counting, time spent counting), and type of container and physical properties of the solution. Furthermore, particle morphology and refractive index can influence the ability to detect and count visible particles. Ideally, two independent, certified analysts need to count visible particles in defined illumination conditions using a black and white panel as background. Blanks and particle standards are also counted in conjunction with the unknowns to ensure accurate and unbiased counting (Wuchner et al. 2010; Madsen et al. 2009).
9.4.1.5 Zeta Potential
The zeta potential is a property of particles in suspension related to their surface charge. In an electric field, each particle and its most closely associated ions move through the solution as a unit, and the potential at the boundary between this unit and the bulk solution is known as the zeta potential. Zeta potentials can be experimentally determined by measuring the drift velocity of particles in an electrical field of known strength (Ross and Morrison 2002; Greenwood 2003) or by a method known as phase analysis light scattering. Since zeta potential reflects the effective charge on the particles and is thus related to the electrostatic repulsion between particles in suspension, it has proven to be extremely useful in predicting the stability of emulsions, colloids, as well as proteins in solution. A higher zeta potential value reflects a more stable suspension since the charged particles repel one another overcoming the natural tendency to aggregate. Conversely, lower values facilitate interactions between the particles. The zeta potential measurement is often a key to understanding dispersion and aggregation processes in various applications including protein formulation (Sejersen et al. 2007; Uskokovic et al. 2010; Schmitt et al. 2007). The zeta potential can be measured with particles ranging from a few nanometers to as large as 30 μm in diameter.
9.4.1.6 Fluorescence-Activated Cell Sorting
Fluorescence-activated cell sorting (FACS), often referred to as flow cytometry, is a technique used for quantitative measurements on single cells, cellular constituents, or particles. Flow cytometry has also been used to detect baculovirus particles and their aggregates (Jorio et al. 2006), monitor platelet aggregation events (Ginsberg et al. 1990; Harding et al. 2007), and characterize amyloid fibrils (Wall and Solomon 1999). Flow cytometry uses the principles of light scattering, light excitation, and the emission of fluorochrome molecules to generate specific multiparameter data from particles and cells in the size range of 0.5–100 μm (Shapiro 1995; Cram 2002). Using hydrodynamic focusing techniques, cells or particles are presented to a light source (usually a laser) and the light scattering and fluorescence emission of thousands of individual particles per second are measured using several detectors (forward scatter, side scatter and fluorescent detectors). Light scattering and/or fluorescence emission is unique to each cell/particle. Thus, a combination of the two can be used to distinguish different particles or cells in a heterogeneous sample. The capability of flow cytometer to characterize individual particles makes it an attractive technique for use in the study of subvisible particles/aggregates in protein formulations. This technique has been widely used in the field of cellular and molecular biology, but its potential for use in the study of subvisible particles in protein formulations has only recently been recognized (Ludwig et al. 2011; Mach et al. 2011).
Stay updated, free articles. Join our Telegram channel

Full access? Get Clinical Tree


