Chapter 3 Cardiovascular physiology
Cardiovascular function reflects the properties both of the different blood vessels which make up the circulation and of the heart, which pumps blood through those vessels. Cardiac physiology depends on the electrical and mechanical properties of cardiac cells, and on their integrated activity in the intact heart. This is under a number of controls; some are intrinsic to the heart itself while other, extrinsic systems depend on nerves and hormones. As a result, the output from the heart can be varied to meet changing tissue needs.
3.1 Relevant structure
Components of the circulation
The cardiovascular system consists of a muscular pump, the heart, and two functionally distinct circulations, systemic and pulmonary (Fig. 34). Blood flow through the systemic circulation depends on contraction of the left ventricle of the heart, which forces blood into the aorta. Large arteries branch off this to supply different areas of the body, forming regional circulations which are effectively in parallel with one another. Within each tissue, smaller and smaller arterial vessels are arranged in series, terminating in the arterioles, which supply the tissue capillaries. These act as the sites of gas and nutrient exchange between blood and the interstitial fluid. Capillaries drain through venules into veins, which empty in turn into the superior and inferior venae cavae. It is these large venous vessels which return systemic blood to the right atrium of the heart.
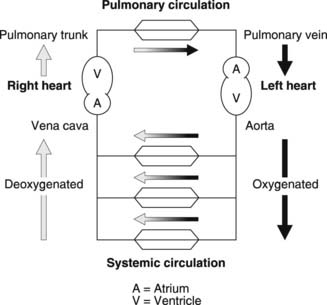
The right side of the heart drives blood through the pulmonary circulation. The right ventricle fills from the right atrium and then contracts, driving blood into the pulmonary trunk, which supplies the pulmonary arteries. Pulmonary capillaries lie in close contact with the air-filled alveoli of the lung and are involved in the gaseous diffusion which oxygenates the blood (Section 4.3). The pulmonary veins return this oxygenated blood to the left atrium, which empties into the left ventricle, thus completing the double circulation.
Cardiac structure
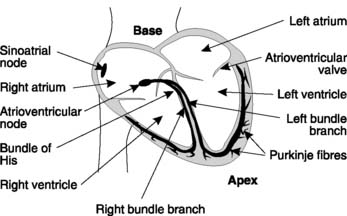
The heart is a double pump arranged as a muscular cone with its apex directed downwards and to the left and its base behind the upper sternum. Each pumping unit consists of two chambers, with a thin-walled atrium opening into a more muscular ventricle. Endocardium lines the inner surface of the muscular myocardium, which is covered in turn by the epicardium. The whole heart is surrounded by a tough, fibrous sac, the pericardium. Atrioventricular valves prevent back flow of blood from ventricles to atria (Fig. 35). On the right side, this valve has three cusps and is known as the tricuspid valve, while on the left it has two cusps and is called the mitral valve. There are also one-way semilunar valves at the ventricular outlets, where blood flows into the pulmonary trunk (pulmonary valve) or aorta (aortic valve). The chambers on the right and left sides of the heart are separated by shared dividing walls known as the atrial and ventricular septa.
Cardiac muscle cells
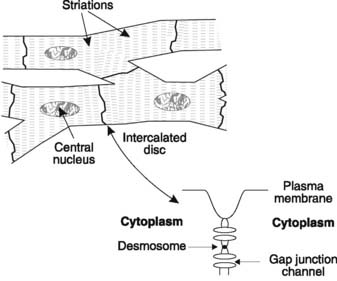
The muscle cells (also known as cardiac myocytes or cardiac fibres) of the heart contain contractile proteins, as described in Section 1.6. Cardiac muscle is rich in mitochondria, reflecting its dependence on aerobic metabolism, and the cells contain only one nucleus. The fibres may branch at either end and they connect with the next cell in series through a region of close cellular association known as an intercalated disc (Fig. 36). Desmosomes link the membranes of adjacent cells at these sites. There are also special transmembrane channel proteins, which form gap junctions connecting the cytoplasm of the cells on either side of the intercalated discs. This provides electrical continuity from cell to cell allowing easy transmission of action potentials. Because of this the heart behaves as a functional syncytium, with rapid conduction of electrical signals leading to well-coordinated contraction.
3.2 Electrical properties of the heart
At the end of this section you should be able to:
Cardiac action potentials
Intracellular recordings from ventricular cells show that the resting membrane potential is similar to that in skeletal muscle, but more negative than that in nerve, at about −90 mV. As with any excitable cell, depolarization of the membrane to threshold leads to the production of an ‘all or none’ action potential with a characteristic shape (Fig. 37). There is an initial rapid depolarization to about +20 mV followed by an initial, partial repolarization of some 5–10 mV. Further repolarization is very slow indeed and this produces an action potential plateau in which membrane potential remains close to 0 mV for some 150–300 ms. After this, the membrane repolarizes rapidly, returning to the resting potential.
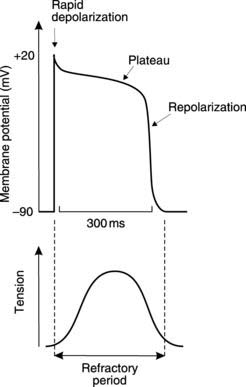
It is the plateau which distinguishes cardiac action potentials from those in skeletal muscle and nerve, as it greatly prolongs the action potential. This has important functional consequences for the mechanical activity of the heart. Cardiac cells are absolutely refractory to stimulation for the whole duration of the action potential and show a high degree of relative refractoriness for an additional 50 ms (Section 1.4). Therefore, a second action potential cannot be generated for a period of up to 350 ms after stimulation in ventricular cells. Contraction and relaxation are complete within this time (Fig. 37) and so it is impossible to get summation of contractions, or continuous tetanic contractions, as are commonly seen in skeletal muscle at higher frequencies of stimulation (Section 1.6). Since effective cardiac pumping depends on cyclical contraction and relaxation, the prolonged action potential protects against pump failure caused by sustained contraction, which would prevent the heart from refilling. It also sets an upper limit on the rate of contraction, which cannot exceed about 3–4 beats s−1 in the ventricle. Atrial rates can be considerably higher, however, because the atrial action potential, and, therefore, the refractory period, is shorter (less than 200 ms).
Mechanism of the cardiac action potential
The mechanisms underlying the cardiac action potential are similar to those in nerve, i.e., they depend on transmembrane ion gradients and voltage-sensitive changes in membrane permeability, or conductance, to those ions (Section 1.4). Three ions, Na+, Ca2+ and K+, are involved (Fig. 38).
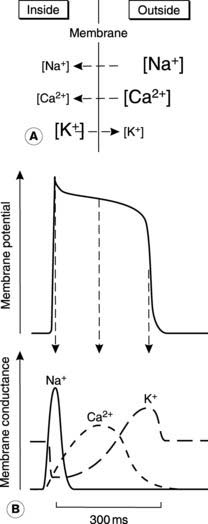
Calcium channels. There are also Ca2+ channels in the membrane, which open in response to depolarization. They activate more slowly than the Na+ channels but once open they allow Ca2+ to flow into the cell (Fig. 38). This inward Ca2+ current keeps the membrane depolarized and thus maintains the plateau in the action potential.
Potassium channels. The conductance changes to K+ in cardiac cells are more complicated than those described for nerve. Potassium conductance first decreases following depolarization, so that during the plateau there is actually less outward K+ current than normal. This makes it easier for the inward Ca2+ current to maintain depolarization, since there is very little current flowing in the opposite direction. After 200 ms or so, however, K+ conductance rises, increasing the outward current. This K+ current repolarizes the membrane. Repolarization is assisted by the reduction in the opposing, inward Ca2+ current which also occurs in the latter part of the action potential (Fig. 38). The fact that K+ conductance first decreases and then increases in response to the initial depolarization reflects the fact that there is more than one type of K+ channel in these cells and each type responds differently to voltage changes.
Spontaneous electrical activity (automaticity)
An isolated heart beats regularly without any extrinsic stimulation from nerves or hormones. This mechanical automaticity reflects the fact that the action potentials which are conducted throughout the heart (the signals which lead to contraction) are generated spontaneously within the cardiac muscle itself. Such activity is said to be myogenic (unlike action potentials in skeletal muscle which are neurogenic, i.e., they are only produced in response to nervous stimuli). The cells responsible for spontaneous action potential production are often referred to as pacemaker cells because they determine the rate at which the heart beats. Electrical recordings from such cells show that, instead of a constant resting membrane potential between action potentials, there is a steadily depolarizing potential known as a pacemaker potential (Fig. 39). When threshold is reached an action potential fires, and then the cycle of events is repeated.
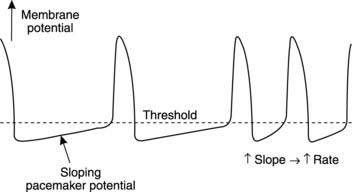
Several cell types in the heart are capable of pacemaker activity, but in the intact organ it is the fastest pacemaker which drives the rest of the heart. Once an action potential is generated at one site, it is rapidly conducted throughout the cardiac muscle and will trigger an action potential in slower pacemaker regions before they can reach the threshold potential spontaneously. Normally the pacemaking frequency is highest in a group of specialized cells called the sino-atrial node, which also have a different shape of action potential (Fig. 39). These cells dictate the rate of electrical events in the rest of the heart. This produces a resting heart rate of 60–70 beats min−1, and the regular pattern of excitation and contraction which results is called sinus rhythm.
Conducting pathways in the heart
Cardiac action potentials normally originate in the pacemaker cells of the sino-atrial node, which is located in the wall of the right atrium close to the superior vena cava (Fig. 35). Action potentials are conducted away from the sino-atrial node through the normal atrial fibres. This is made possible by the interbranching structure of cardiac cells and the easy transmission of action potentials from one cell to another via the low-resistance gap junctions in the intercalated discs (Fig. 36). The conduction velocity through the atrial muscle is 0.3 m s−1 and this is rapid enough to produce a coordinated atrial contraction which forces blood into the ventricles.
Electrocardiogram (ECG)
To understand the principle underlying the ECG, let us consider an area of myocardium with two surface electrodes being used to record any potential differences from the overlying skin (Fig. 40A). At rest there will be zero potential difference between the electrodes, but as the depolarizing phase of an action potential spreads across the heart, the transmembrane potential will be reversed in one area while other areas remain polarized. This generates a potential difference which is recorded as a positive deflection, assuming the electrodes are attached to the positive and negative poles of the voltmeter as shown (reversing this connection would reverse the sign of the recorded potential difference but would not alter the shape of the ECG). Eventually, all the local myocardium will be depolarized, so the potentials at the two surface electrodes will be identical, giving zero potential difference again. Once repolarization starts to spread, however, a negative potential will be recorded until the whole tissue returns to the resting potential again.
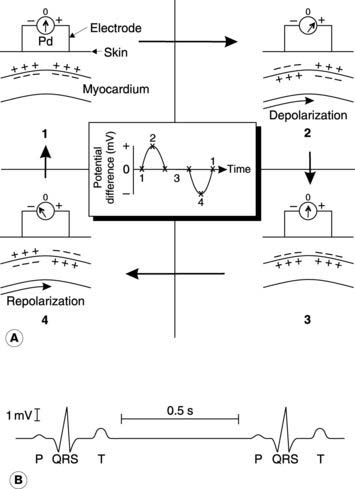
A typical ECG recording consists of three different waves (Fig. 40B). There is an initial positive deflection known as the P wave. This is generated by the spread of depolarization across the atria. It is followed by the QRS complex, which is produced by the spread of depolarization across the ventricles. These contain more muscle and so generate larger surface potentials. The final T wave is the result of repolarization of the ventricles. The T wave is usually smaller than the QRS wave because repolarization spreads over the surface of the ventricles more slowly than does depolarization. The same is true for the atria, and this explains why no ECG wave attributable to repolarization of the atria is seen. The exact shape of the ECG depends on which points on the body surface are used for recording. Different electrode combinations (different recording leads) can give information about different parts of the heart.
Box 7 Clinical note: Cardiac arrhythmias
Any abnormal or irregular pattern of cardiac contraction is referred to as an arrhythmia. These arise from defects of pacemaking activity or abnormal electrical conduction through the heart. The normal rhythm which results from the activity of the sino-atrial node is referred to as sinus rhythm. The heart rate is not actually constant in normal individuals but varies during the respiratory cycle, speeding up during inspiration and slowing again during expiration. This is referred to as sinus arrhythmia and is particularly marked in fit young individuals. Pathological arrhythmias include atrial fibrillation, in which there is no coordinated atrial contraction. Action potentials are conducted randomly to the ventricles, producing a very irregular pulse, and there are no P waves on the ECG. This condition may lead to heart failure, but some cardiac function is maintained since atrial contraction is not necessary for passive filling of the ventricles (Fig. 41). Ventricular fibrillation, by comparison, is fatal, since there is no effective cardiac output in the absence of coordinated ventricular contraction. This is a common arrhythmia in those who have suffered from myocardial infarction but it may be reversed by the immediate application of DC electrical shocks from a defibrillator which synchronize depolarization of the myocardium.
3.3 Cardiac contractility
The cellular basis of contraction is essentially the same as in skeletal muscle, with thick and thin myofilaments sliding past one another because of the formation of mobile cross bridges between myosin and actin (Section 1.6). Cross bridge formation is regulated by intracellular Ca2+ so that increases in the cytoplasmic [Ca2+] lead to contraction through changes in the shape of the troponin–tropomyosin system on the thin myofilaments. The event which triggers contraction is the action potential. In cardiac muscle this stimulates Ca2+ release from the sarcoplasmic reticulum but the mechanism differs from skeletal muscle, in which Ca2+ release is activated directly by membrane depolarization (Section 1.6). In the heart, Ca2+ entry during the plateau phase of the action potential is the important stimulus (Section 3.2), but the effect of this influx on the intracellular [Ca2+] is amplified by Ca2+-induced Ca2+ release from the cardiac sarcoplasmic reticulum. Once the plasma membrane has repolarized, Ca2+ is rapidly removed from the cytoplasm (both by transport across the plasma membrane and reuptake into the sarcoplasmic reticulum), and the cell relaxes.
3.4 The cardiac cycle
At the end of this section you should be able to:
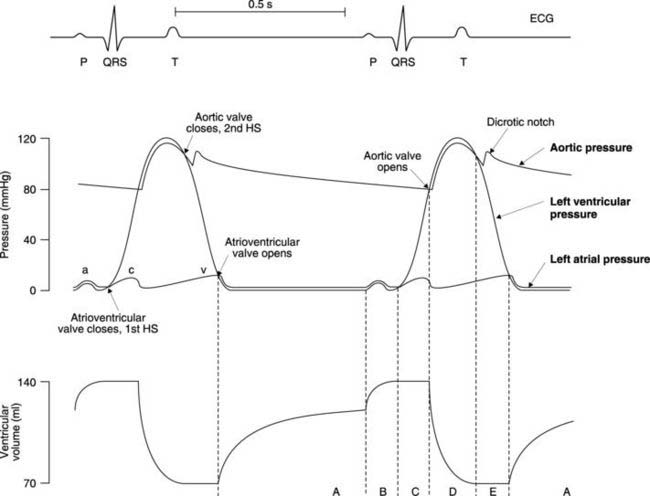
The cardiac cycle refers to the mechanical and electrical events during a single cycle of contraction and relaxation. It describes both the patterns of change observed in individual measurements of mechanical and electrical function and how the timings of events in different chambers of the heart relate to each other (Fig. 41).
Mechanical events
Ventricular pressure
This is the simplest of the three relevant pressure waves. During most of ventricular diastole, when the ventricle is relaxed, intraventricular pressure is low (less than 1 mmHg). This rises to about 5 mmHg at the end of diastole because of atrial systole, which forces additional blood into the ventricle. As the atrium relaxes, pressure falls but ventricular systole, or contraction, then commences and pressure rises rapidly, reaching a peak of about 120 mmHg in the left ventricle. (The wave form in the right ventricle is identical in shape to that in the left but the peak pressure during systole is much lower, at about 25 mmHg.) Pressure falls back to its original low value as the ventricle relaxes (diastole). In Figure 41 the cardiac cycle lasts 0.9 s (i.e., resting heart rate equals 66 beats min−1), systole lasting 0.3 s and diastole 0.6 s. As heart rate increases, it is mainly diastole which shortens, and if the heart rate rises too high, cardiac pumping becomes very inefficient because of inadequate ventricular filling during diastole.
Atrial pressure
There are three peaks in atrial pressure, known as the ‘a’, ‘c’ and ‘v’ waves. Throughout ventricular diastole there is a pressure gradient favouring blood flow through the open atrioventricular valve into the ventricle. Atrial pressure remains constant, at about 1 mmHg, until atrial systole, when active atrial contraction raises it to a peak of about 6 mmHg. This is the ‘a’ wave. The atrium then relaxes and ventricular pressure starts to rise so the atrial and ventricular pressure curves cross each other. This reverses the pressure gradient and, as a result, the atrioventricular valve (which only permits flow from atrium to ventricle) closes. The back pressure on the valve cusps during early ventricular systole, when both the inflow and outflow valves of the ventricles are closed, causes a secondary rise in atrial pressure, the ‘c’ wave. As soon as the aortic or pulmonary valves open, atrial pressure falls rapidly to almost zero (the ‘x’ descent). Blood continues to enter the atria from the venous system, however, and since the atrio-ventricular valves are closed this produces a steady increase in pressure, the ‘v’ wave. This peaks at 3–4 mmHg just before the rapidly falling pressure in the relaxing ventricle drops below that in the atrium (the ‘y’ descent). The atrioventricular valves reopen and the atrial pressure drops back to about 1 mmHg. The ‘a’ and ‘v’ waves, or perhaps more correctly, the ‘x’ and ‘y’ descents, can be observed during careful examination of the jugular veins of the neck (the ‘c’ wave is rarely visible; see Section 3.9).
Aortic pressure
During ventricular diastole, there is a gradual decline in aortic pressure to a minimum of about 80 mmHg. Throughout this period, aortic pressure is higher than left ventricular pressure so the aortic valve remains closed. During systole, the ventricular pressure rises above aortic pressure, opening the valve and allowing blood to be ejected into the aorta. Aortic pressure follows ventricular pressure closely during systole, peaking at about 120 mmHg, but as the pressure in the ventricles starts to decline there is a much slower drop in aortic pressure. This reflects the elasticity of the aorta, which is stretched by the rapid inflow of blood during ventricular systole. The stored elastic energy is then released during diastole, as the walls of the aorta passively recoil, thus maintaining aortic pressure. As a result, the aortic and ventricular pressure waves cross once more, and the aortic valve closes. This halts the back flow of blood towards the ventricle and the force generated as the momentum of this blood is dissipated shows up as a brief increase in aortic pressure, resulting in the incisura or dicrotic notch (Fig. 41).
Ventricular volume
At the end of systole, there is about 70 ml of blood in the ventricle. This increases to about 125 ml during diastole as a result of passive filling from the atrium (Fig. 41). Active filling during atrial systole at the end of ventricular diastole only increases filling by a further 25%, to about 140 ml. The dominance of passive filling explains why ventricular function is still possible in the absence of coordinated atrial contraction, e.g., during atrial fibrillation.
Following closure of the atrioventricular valve, but before the aortic valve opens, the ventricles are effectively closed boxes whose volume cannot change. There is, therefore, a short period of isovolumetric contraction, with constant volume but rising ventricular pressure. Opening of the aortic valve then leads to the ejection phase during which ventricular volume drops from 140 ml to 70 ml. Therefore, about 70 ml of blood are ejected in each cycle, i.e., the stroke volume is 70 ml. The normal ejection fraction (a useful measure of ventricular function) is, therefore, around 50% (stroke volume/end diastolic volume). Ejection is followed by a period of isovolumetric relaxation during which atrioventricular and aortic valves are again closed. Passive filling then recommences with opening of the atrioventricular valve.
Electrical events
The electrical signals in the heart act as stimuli for the mechanical responses and so each wave on the ECG is associated with the onset of the relevant pressure change (Fig. 41). The P wave indicates depolarization of the atria and comes at the start of the pressure wave caused by atrial contraction. Similarly, the spread of depolarization over the ventricles, recorded as the QRS complex, marks the onset of ventricular contraction. This is followed by ventricular repolarization and the resulting T wave overlaps the drop in pressure caused by ventricular relaxation.
3.5 Cardiac output

Measurement of cardiac output
Fick’s method
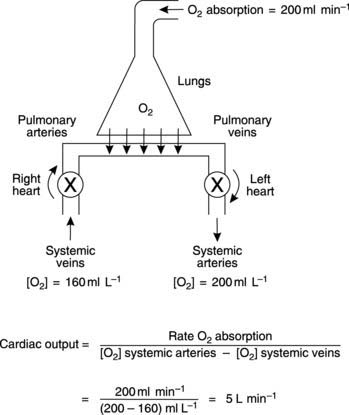
The Fick technique for the estimation of cardiac output is a specific application of Fick’s principle, which states that the rate of addition or removal of a substance in any part of the circulation equals the blood flow multiplied by the resulting change in concentration. We can apply this to the pulmonary circulation where there is a continuous uptake of O2 from the alveoli and, as a result, [O2] in blood increases (Fig. 42). The relationship between the magnitude of the change in [O2] and the pulmonary blood flow can be derived from the considerations outlined in Box 8.
Box 8 Background mathematics: Cardiac output from Fick’s method
Each minute, the amount of O2 entering the lungs in pulmonary arterial blood = (Pulmonary blood flow) × (Pulmonary arterial [O2]).
Since pulmonary blood flow equals cardiac output we can simplify this to:
Cardiac output × (Pulmonary venous [O2] − Pulmonary arterial [O2]) = Rate of O2 absorption.
In practice, the rate of O2 absorption is measured using a device called a spirometer and is about 200 ml min−1 at rest. Systemic arterial [O2] can be measured from any peripheral artery and usually equals 200 ml L−1. Systemic venous [O2] cannot be measured from a peripheral vein, however, since venous [O2] varies for different organs. A mixed venous sample must be obtained instead, either from the right ventricle or the pulmonary trunk. Such samples give an [O2] of 160 ml L−1. Inserting these values into Fick’s equation (Eq. 7) gives a value of 5 L min−1 for the resting cardiac output (Fig. 42).
Indicator dilution technique
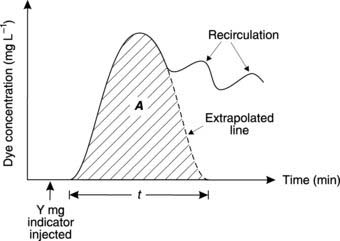
Following injection of a known amount (Y mg) of a measurable dye (the indicator) into the central venous system close to the heart, indicator concentration (c) in systemic arterial blood rapidly rises to a peak and then declines again (Fig. 43). Recirculation of the indicator leads to secondary peaks on the concentration curve, but extrapolation of the initial decline gives an estimate of what the concentration curve would have been like in the absence of such recirculation. Box 9 shows how cardiac output can be calculated from these studies.
Box 9 Background mathematics: Cardiac output using indicator dilution
Figure 43 shows the changes in dye concentration (c). The area under the curve (A) produced by extrapolating the initial decline can be used to calculate the average concentration of indicator for the time of one circulation (t).
In theory, we could also calculate the average indicator concentration using the expression:
By equating Eq. 8 and Eq. 9 we get:
In choosing an indicator, one requires a physiologically inert substance which is retained in the circulation and is not metabolized. An adaptation of the method which fulfils all of these criteria uses injections of warm or cold saline into the pulmonary trunk and the resulting change in blood temperature is measured a few centimetres further on. This is referred to as the thermodilution technique.
Control of cardiac output
Intrinsic control of cardiac function
The most important intrinsic mechanism involved in the control of cardiac output is usually referred to as Starling’s law of the heart, or the Frank–Starling mechanism, after the two physiologists who first described it. They observed an increase in the force of contraction as the resting length of the cardiac muscle fibres was increased. This resulted in increases in stroke volume and, therefore, in cardiac output, as the volume of the ventricle immediately before contraction (the end diastolic volume) was increased (Fig. 44A). This is independent of any extrinsic nervous and hormonal controls. Similar results are obtained if some other measure of the degree of ventricular filling is used, e.g., venous return (the total rate of blood flow into the atrium from the veins) or atrial pressure. One way of summarizing the overall effect of the Frank–Starling mechanism on cardiac function is as a plot of cardiac output against atrial pressure, which demonstrates clearly that increased ventricular filling leads to increased output across the normal range of atrial pressures (Fig. 44B).
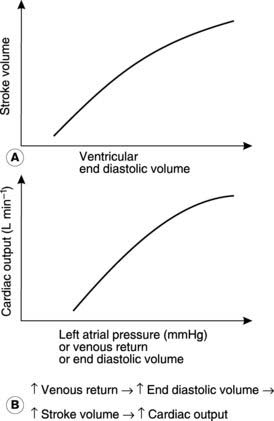
Preload and afterload As in any muscle, the contractile performance of the heart is influenced by the mechanical forces, or loads, which it experiences. Preload refers to the level of stretch in the relaxed muscle immediately before it contracts. In the heart this is largely dictated by the venous return. Increases in venous return increase the preload, i.e., they increase the stretch in the muscle fibres before contraction. This increases contractile force and, therefore, cardiac output, as described by Starling’s law (Fig. 44).
Nervous control
Both the sympathetic and parasympathetic divisions of the autonomic nervous system help regulate the heart’s activity (Section 7.6). They can alter the heart rate (chronotropic effects) or the strength of ventricular contraction (inotropic effects) but are not under conscious control. Instead, they are reflexly regulated by inputs from cardiovascular and other receptors, e.g., from the baroreceptors, which help regulate arterial pressure, or through connections with higher centres in the brain, e.g., in response to emotions such as anger or fear.
Sympathetic nerves Sympathetic nervous activity to the heart is controlled from a number of regions in the central nervous system (CNS), including the medulla oblongata. The postganglionic nerves release the neurotransmitter noradrenaline (norepinephrine) and supply both pacemaking and contractile cells throughout the atria and ventricles. Stimulation of these nerves leads to increases both in heart rate (positive chronotropic effect) and in myocardial contractility (positive inotropic effect). This increases the cardiac output at any given atrial filling pressure, pushing the relationship between cardiac output and atrial pressure upwards and to the left (Fig. 45A). There is a limit to the benefits of increasing heart rate, however, since the time available for diastolic filling between contractions decreases, and rates over 200 beats min−1 may lead to a decline in cardiac output.
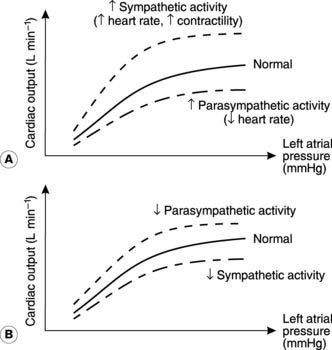
Parasympathetic nerves These come from the medulla oblongata in the brain and reach the heart via the vagus nerve. They supply the sino-atrial and atrioventricular nodes, releasing acetylcholine when stimulated, and this slows the heart (a negative chronotropic effect) through its influence on pacemaker activity. Maximal parasympathetic activity can reduce the heart rate to 30–40 beats min−1 (vagal brake). The result is a reduction in cardiac output, pushing the cardiac function curve down and to the right (Fig. 45A). Parasympathetic nerves are not distributed to ventricular muscle and so they have no appreciable effect on contractility (i.e., no inotropic effect).
Resting nervous tone Under resting conditions, there is activity in both the sympathetic and parasympathetic nerves supplying the heart. This is referred to as resting nervous tone and cardiac function can be altered by either decreasing or increasing the frequency of stimulation by either set of nerves. For example, heart rate and cardiac output may be doubled by completely blocking the resting parasympathetic tone (Fig. 45B).
Hormonal control
The most important circulating hormones affecting the heart are the catecholamines, i.e., noradrenaline (also called norepinephrine) and adrenaline (or epinephrine). These are released by adrenal medullary cells in response to increased preganglionic sympathetic nervous stimulation of that gland (Section 8.6). They have the same effects on the heart as noradrenaline (norepinephrine) from sympathetic nerves, increasing both heart rate and myocardial contractility, and thus increasing cardiac output. Circulating catecholamines prolong the period of cardiac stimulation for some minutes after sympathetic nervous activity has returned to normal.
Exercise and cardiac function
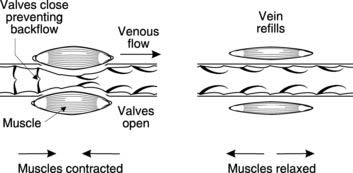
Venous return. This rises as a result of compression of the veins by contracting skeletal muscle and, therefore, increases cardiac output through the Starling mechanism. Unidirectional venous valves ensure that blood is forced towards the right atrium (see Fig. 56).
Sympathetic nervous activity increases both in response to higher centres involved in initiating exercise and reflexly by receptors in the exercising muscles themselves. Heart rate and myocardial contractility are increased as a result, helping boost cardiac output. In practice, the rise in heart rate is the dominant effect and there is usually little change in stroke volume. Sympathetic stimulation also leads to active constriction of the smooth muscle in the walls of veins (venoconstriction), further enhancing venous return.
Box 10 Clinical note: Cardiac failure
If the muscle of the heart becomes damaged, e.g., because of decreased myocardial blood supply (myocardial ischaemia), or if the demands placed on the heart are abnormally large, e.g., in hypertension where the arterial pressure is abnormally high, the heart may fail to perform its pump functions adequately. This failure affects the body in two main ways. Firstly, the cardiac output may fall below the required level, so that tissue perfusion is reduced (forward failure). This leads to fatigue and poor exercise tolerance. Secondly, blood accumulates in the failing ventricle, which becomes dilated, and this leads to an increase in atrial pressure (backward failure). The pressure in the veins emptying into the affected atrium will also rise, and this increases capillary pressure (Section 3.8). The result is an accumulation of fluid (oedema) either in the pulmonary tissue (in the case of left ventricular failure) or in the skin and systemic organs (right ventricular failure). Pulmonary oedema is particularly serious since it interferes with gas exchange in the alveoli (Section 4.3), causing breathlessness.
3.6 Control of arterial pressure
Measurement of blood pressure
Pressure may be measured directly by inserting a cannula into an artery, but this is only appropriate for experimental or intensive care situations. Indirect measurement makes use of an inflatable cuff which can be wrapped around the upper arm, over the biceps area. Cuff pressure is recorded using a device known as a sphygmomanometer. The pressure is raised well above the normal arterial pressure, to approximately 200 mmHg, and then the cuff is slowly deflated. At the same time a stethoscope is used to listen, or auscultate, over the brachial artery distal to the cuff. This method is sometimes referred to as the auscultatory method. Initially there is silence because the high pressure in the cuff completely collapses the artery, but as cuff pressure falls, a short tapping sound, known as the first Korotkoff sound, is heard. This occurs when the highest pressure achieved in the artery (the systolic pressure) is slightly greater than the cuff pressure, and so a brief jet of blood is forced through in each cardiac cycle. This turbulent flow vibrates the arterial walls and produces the Korotkoff sounds. As the cuff deflates further, arterial pressure exceeds cuff pressure for longer and longer in each cycle, allowing blood to flow through for longer and with less turbulence. As a result, the Korotkoff sounds become longer and quieter. Eventually the sound disappears completely (the fifth and last Korotkoff sound) as blood flow becomes continuous and nonturbulent because the cuff pressure is below arterial diastolic pressure. The sphygmomanometer pressures corresponding with the first and last Korotkoff sounds are recorded as the systolic and diastolic arterial pressures.
where Pulse pressure = (Systolic pressure − Diastolic pressure).
A simple (arithmetic) average of systolic and diastolic values is not used for the mean pressure because diastole normally lasts twice as long as systole (Fig. 41).
Blood pressure and peripheral resistance
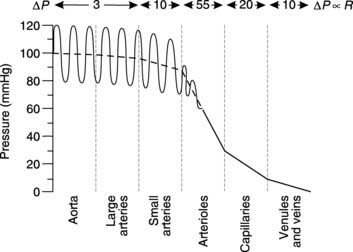
For fluid to flow through a pipe, there must be a pressure gradient between the two ends of the pipe (Fig. 46). The size of that gradient (ΔP) equals the rate of fluid flow (Q) times the resistance to flow (R), i.e.
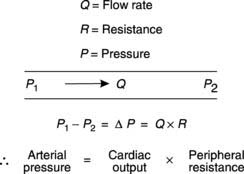
where peripheral resistance is the total resistance to blood flow through the systemic circulation.
Pressures and resistances in different types of blood vessel
Using Equation 12 we can see that if Q is constant, then the pressure difference between two points in the circulation will be proportional to the resistance of the blood vessels between those two points. The total blood flow through any class of systemic blood vessel (e.g., all arteries or all veins) must be equal to the cardiac output, so the drop in pressure along any type of blood vessel is proportional to the total resistance to blood flow offered by all vessels of that type. Blood pressure measurements can be made at different sites around the systemic circulation and the overall pressure profile determined (Fig. 47). The pressure in the aorta and large arteries is high and pulsatile (about 120/80 mmHg), and there is only a small drop in pressure along their length. Both the mean pressure and the amplitude of the pulse pressure (systolic pressure − diastolic pressure) decrease somewhat more in the small arteries but the largest pressure drop occurs within the arterioles. This tells us that the single largest contribution to the peripheral resistance comes from the arterioles (about 55% of total resistance). Arterioles have a considerable amount of smooth muscle in their walls and peripheral resistance can be actively controlled by constriction or dilatation of these vessels (vasoconstriction and vasodilatation, respectively). The resulting changes in arteriolar diameter dramatically affect their resistance since the resistance (R) of a single vessel is inversely proportional to the fourth power of the radius (r), i.e.

Physical factors affecting vascular resistance
The total resistance offered by all the blood vessels in the body of any given type represents the balance between the resistance of a single vessel and the total number of such vessels in parallel with each other. The resistance of a single blood vessel to fluid flow is mainly dictated by its radius (Eq. 14), so an individual capillary (diameter of 5–10 μm) offers a much greater resistance to blood flow than a single arteriole (diameter of 10–100 μm). Within the circulation as a whole, however, many blood vessels of each type are arranged in parallel, and this reduces their total resistance. The total resistance of all capillaries taken together is less than that of all arterioles, however, because there is a much larger number of capillaries in parallel with each other and this more than compensates for the higher resistance in a single capillary.
Stay updated, free articles. Join our Telegram channel

Full access? Get Clinical Tree


