Introduction
Diseases of the cardiovascular system frequently confront the physician involved in the day-to-day care of patients. Knowledge of the underlying pathophysiologic processes associated with diseases of the heart and blood vessels provides a critical framework for patient management. This chapter deals with diseases of the heart with the following chapter focusing on diseases of the blood vessels. Normal cardiac structure and function are summarized here, and pathophysiologic mechanisms for commonly encountered cardiac problems are then discussed, with emphasis on arrhythmias, heart failure, valvular heart disease, coronary artery disease, and pericardial disease.
Normal Structure & Function of the Heart
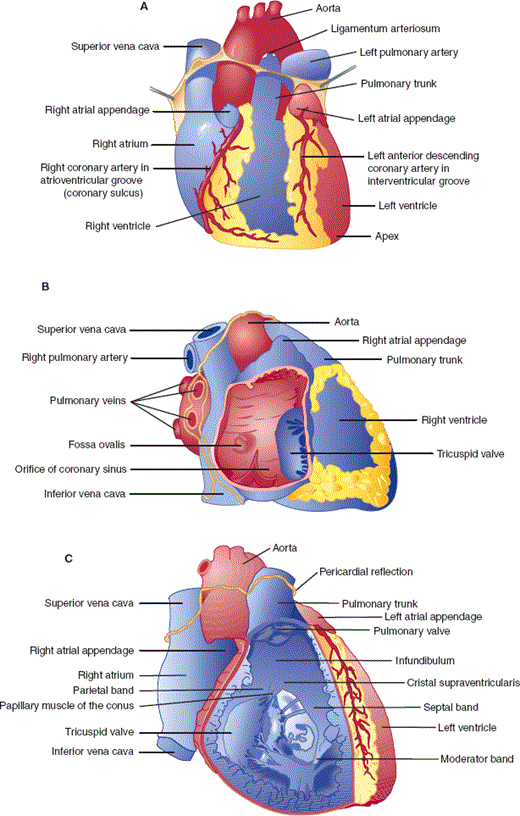
The heart is a complex organ whose primary function is to pump blood through the pulmonary and systemic circulations. It is composed of four muscular chambers: the main pumping chambers, the left and right ventricles, and the left and right atria, which act like “priming pumps” responsible for the final 20–30% of ventricular filling (Figure 10–1A). Peripheral venous return from the inferior and superior venae cavae fills the right atrium and ventricle (through the open tricuspid valve) (Figure 10–1B). With atrial contraction, additional blood flows through the tricuspid valve and completes the filling of the right ventricle. Unoxygenated blood is then pumped to the pulmonary artery and lung by the right ventricle through the pulmonary valve (Figure 10–1C). Oxygenated blood returns from the lung to the left atrium via four pulmonary veins (Figure 10–1D). Sequential left atrial and ventricular contraction pumps blood back to the peripheral tissues. The mitral valve separates the left atrium and ventricle, and the aortic valve separates the left ventricle from the aorta (Figures 10–1D and 10–1E).
Figure 10–1
Anatomy of the heart. A: Anterior view of the heart. B: View of the right heart with the right atrial wall reflected to show the right atrium. C: Anterior view of the heart with the anterior wall removed to show the right ventricular cavity. D: View of the left heart with the left ventricular wall turned back to show the mitral valve. E: View of the left heart from the left side with the left ventricular free wall and mitral valve cut away to reveal the aortic valve. (Redrawn, with permission, from Cheitlin MD et al, eds. Clinical Cardiology, 6th ed. Originally published by Appleton & Lange. Copyright © 1993 by The McGraw-Hill Companies, Inc.)
The heart lies free in the pericardial sac, attached to mediastinal structures only at the great vessels. During embryologic development, the heart invaginates into the pericardial sac like a fist pushing into a partially inflated balloon. The pericardial sac is composed of a serous inner layer (visceral pericardium) directly apposed to the myocardium and a fibrous outer layer called the parietal pericardium. Under normal conditions, approximately 40–50 mL of clear fluid, which probably is an ultrafiltrate of plasma, fills the space between the layers of the pericardial sac.
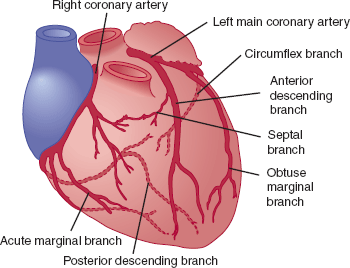
The left main and right coronary arteries arise from the root of the aorta and provide the principal blood supply to the heart (Figure 10–2). The large left main coronary artery usually branches into the left anterior descending artery and the circumflex coronary artery. The left anterior descending coronary artery gives off diagonal and septal branches that supply blood to the anterior wall and septum of the heart, respectively. The circumflex coronary artery continues around the heart in the left atrioventricular groove and gives off large obtuse marginal arteries that supply blood to the left ventricular free wall. The right coronary artery travels in the right atrioventricular groove and supplies blood to the right ventricle via acute marginal branches. The posterior descending artery, which supplies blood to the posterior and inferior walls of the left ventricle, arises from the right coronary artery in 80% of people (right-dominant circulation) and from the circumflex artery in the remainder (left-dominant circulation).
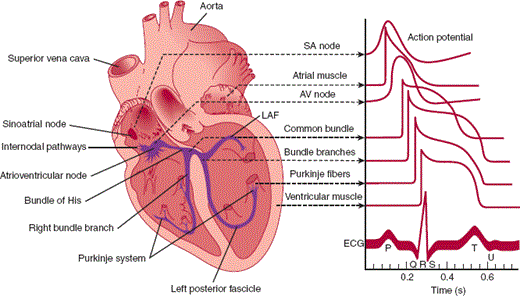
Contraction of the heart chambers is coordinated by several regions in the heart that are composed of myocytes with specialized automaticity (pacemaker) and conduction properties (Figure 10–3). Cells in the sinoatrial (SA) node and the atrioventricular (AV) node have fast pacemaker rates (SA node: 60–100 bpm; AV node: 40–70 bpm), and the His bundle and Purkinje fibers are characterized by rapid rates of conduction. Because it has the fastest intrinsic pacemaker rhythm, the SA node is usually the site of initiation of the cardiac electrical impulse during a normal heartbeat. The impulse then rapidly depolarizes both the left and right atria as it travels to the AV node. Conduction velocity slows from 1 m/s in atrial tissue to 0.05 m/s in nodal tissue. After the delay in the AV node, the impulse moves rapidly down the His bundle (1 m/s) and Purkinje fibers (4 m/s) to simultaneously depolarize the right and left ventricles. The atria and ventricles are separated by a fibrous framework that is electrically inert, so under normal conditions the AV node and the contiguous His bundle form the only electrical connection between the atria and ventricles. This arrangement allows the atria and ventricles to beat in a synchronized fashion and minimizes the chance of electrical feedback between the chambers.
Figure 10–3
Conducting system of the heart. Typical transmembrane action potentials for the SA and AV nodes, other parts of the conduction system, and the atrial and ventricular muscles are shown along with the correlation to the extracellularly recorded electrical activity (ie, the electrocardiogram [ECG]). The action potentials and ECG are plotted on the same time axis but with different zero points on the vertical scale. The PR interval is measured from the beginning of the P wave to the beginning of the QRS. (LAF, left anterior fascicle.) (Redrawn, with permission, from Ganong WF. Review of Medical Physiology, 22nd ed. McGraw-Hill, 2005.)
The electrical activity of the heart can be measured from the body surface at standardized positions by electrocardiography. On the electrocardiogram (ECG), the P wave represents depolarization of atrial tissue; the electrocardiographic wave (QRS) interval, ventricular depolarization; and the T wave, ventricular repolarization (Figure 10–3). Because normal ventricular depolarization occurs almost simultaneously in the right and left ventricles—usually within 60–100 ms—the QRS complex is narrow. Although the electrical activity of the small specialized conduction tissues cannot be measured directly from the surface, the interval between the P wave and the start of the QRS complex (PR interval) represents primarily the conduction time of the AV node and His bundle.
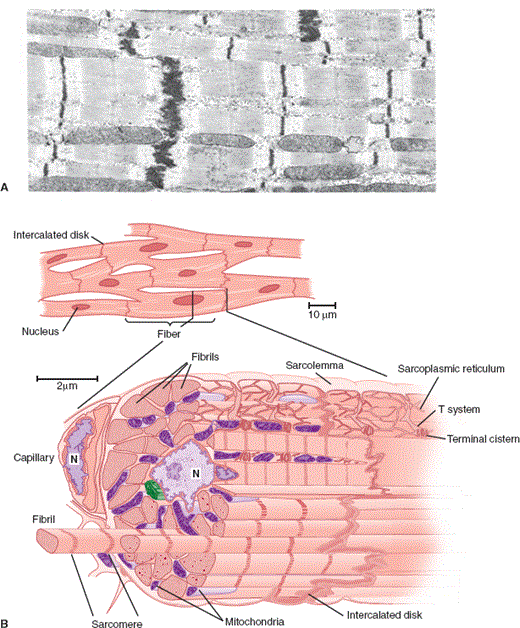
Ventricular myocytes are normally 50–100 mm long and 10–25 mm wide. Atrial and nodal myocytes are smaller, whereas myocytes of the Purkinje system are larger in both dimensions. Myocytes are filled with hundreds of parallel striated bundles termed myofibrils. Myofibrils are composed of repeating units, termed sarcomeres, that form the major contractile unit of the myocyte (Figure 10–4). Sarcomeres are complex structures composed of the contractile proteins, myosin, and actin, which are connected by cross-bridges, and a regulatory protein complex, tropomyosin. (See Cellular Physiology section later.)
Figure 10–4
A: Electron photomicrograph of cardiac muscle. The fuzzy thick lines are intercalated disks (×12,000). (Reproduced, with permission, from Bloom W et al. A Textbook of Histology, 10th ed. Saunders, 1975.) B: Diagram of cardiac muscle as seen under the light microscope (top) and the electron microscope (bottom). (N, nucleus.) (Redrawn, with permission, from Braunwald E et al. Mechanisms of contraction of the normal and failing heart. N Engl J Med. 1967;277:794.)
Because the ventricles are the primary physiologic pumps of the heart, analysis has focused on these chambers, particularly the left ventricle. Function of intact ventricles is traditionally studied by evaluating pressure-time and pressure-volume relationships.
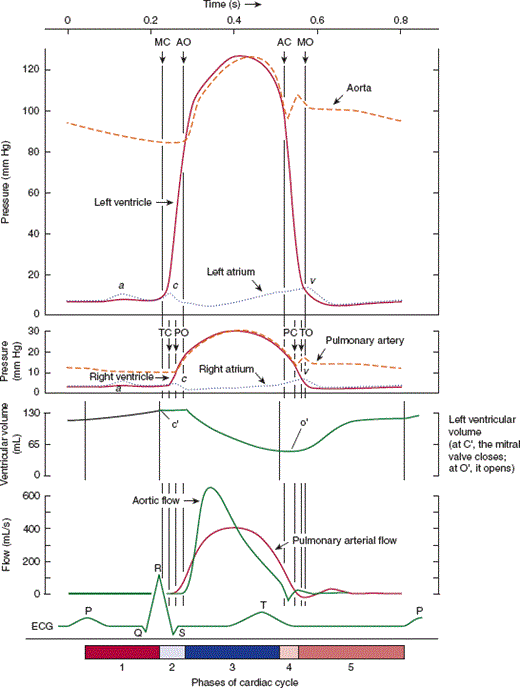
In pressure-time analysis (Figure 10–5), pressures in the chambers of the heart and the great vessels are measured during the cardiac cycle and plotted as a function of time. At the beginning of the cardiac cycle, the left atrium contracts, forcing additional blood into the left ventricle and giving rise to an a wave on the left atrial pressure tracing. At end diastole, the mitral valve closes, producing the first heart sound (S1), and a brief period of isovolumic contraction follows during which both the aortic and the mitral valve are closed but the left ventricle is actively contracting. When intraventricular pressure rises to the level of aortic pressure, the aortic valve opens and blood flows into the aorta. Beyond this point, the aorta and left ventricle form a contiguous chamber with equal pressures, but left ventricular volume decreases as blood is expelled. Left ventricular contraction stops and ventricular relaxation begins, and end systole is reached when intraventricular pressure falls below aortic pressure. The aortic valve then closes, producing the second heart sound (S2). Throughout systole, blood has slowly accumulated in the left atrium (because the mitral valve is closed), giving rise to the v wave on the left atrial pressure tracing. During the first phase of diastole—isovolumic relaxation—no change in ventricular volume occurs, but continued relaxation of the ventricle leads to an exponential fall in left ventricular pressure. Left ventricular filling begins when left ventricular pressure falls below left atrial pressure and the mitral valve opens. Ventricular relaxation is a relatively long process that begins before the aortic valve closes and extends past mitral valve opening. The rate and extent of ventricular relaxation depend on multiple factors: heart rate, wall thickness, chamber volume and shape, aortic pressure, sympathetic tone, and presence or absence of myocardial ischemia. Once the mitral valve opens, there is an initial period of rapid filling of the ventricle that contributes 70–80% of blood volume to the ventricle and occurs largely because of the atrioventricular pressure gradient. By mid-diastole, flow into the left ventricle has slowed, and the cardiac cycle begins again with the next atrial contraction. Right ventricular pressure-time analysis is similar but with lower pressures because the impedance to flow in the pulmonary vascular system is much lower than in the systemic circulation.
Figure 10–5
Diagram of events in the cardiac cycle. From top downward: pressure (in millimeters of mercury) in aorta, left ventricle, left atrium, pulmonary artery, right ventricle, right atrium; blood flow (mL/s) in ascending aorta and pulmonary artery; ECG. Abscissa, time in seconds. (Valvular opening and closing are indicated by AO and AC, respectively, for the aortic valve; MO and MC for the mitral valve; PO and PC for the pulmonary valve; TO and TC for the tricuspid valve.) Events of the cardiac cycle at a heart rate of 75 bpm. The phases of the cardiac cycle identified by the numbers at the bottom are as follows: 1, atrial systole; 2, isovolumetric ventricular contraction; 3, ventricular ejection; 4, isovolumetric ventricular relaxation; 5, ventricular filling. Note that late in systole aortic pressure actually exceeds left ventricular pressure. However, the momentum of the blood keeps it flowing out of the ventricle for a short period. The pressure relationships in the right ventricle and pulmonary artery are similar. (Redrawn, with permission, from Milnor WR. The circulation. In: Mountcastle VB, ed. Medical Physiology, 2 vols. Mosby, 1980.)
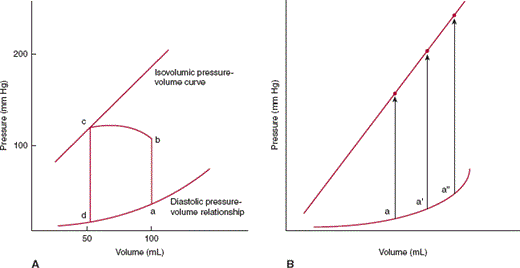
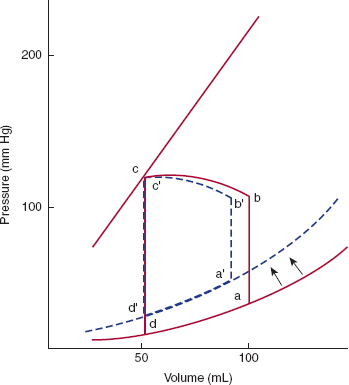
In pressure-volume analysis (Figure 10–6), pressure during the cardiac cycle is plotted as a function of volume rather than time. During diastole, as ventricular volume increases during both the initial rapid filling period and atrial contraction, ventricular pressure increases (curve da). The shape and position of this curve, the diastolic pressure-volume relationship, are dependent on relaxation properties of the ventricle, the elastic recoil of the ventricle, and the distensibility of the ventricle. The curve shifts to the left (higher pressure for a given volume) if relaxation of the ventricle is decreased, the ventricle loses elastic recoil, or the ventricle becomes stiffer. At the beginning of systole, active ventricular contraction begins and volume remains unchanged (isovolumic contraction period) (ab). When left ventricular pressure reaches aortic pressure, the aortic valve opens, and ventricular volume decreases as the ventricle expels its blood (curve bc). At end systole (c), the aortic valve closes and isovolumic relaxation begins (cd). When the mitral valve opens, the ventricle begins filling for the next cardiac cycle, repeating the entire process. The area encompassed by this loop represents the amount of work done by the ventricle during a cardiac cycle. The position of point c is dependent on the isovolumic systolic pressure-volume curve. If the ventricle is filled with variable amounts of blood (preloads) and allowed to contract but the aortic valve is prevented from opening, a relatively linear relationship exists, termed the isovolumic systolic pressure-volume curve (Figure 10–6B). The slope and position of this line describe the inherent contractile state of the ventricle. If contractility is increased by catecholamines or other positive inotropes, the line will shift to the left.
Figure 10–6
A: Pressure-volume loop for the left ventricle. During diastole the left ventricle fills and pressure increases along the diastolic pressure-volume curve from d to a. Line ab represents isometric contraction, and bc the ejection phase of systole. The aortic valve closes at point c, and pressure drops along cd (isovolumic relaxation), until the mitral valve opens at point d and the cycle repeats. The distance from b to c represents the stroke volume ejected by that beat. Point a represents end-diastole and point c, end-systole. B: If the left ventricle is filled by varying amounts a, a′, a″ and allowed to undergo isovolumic contraction, a relatively linear relationship, the isovolumic pressure-volume relation, can be defined.
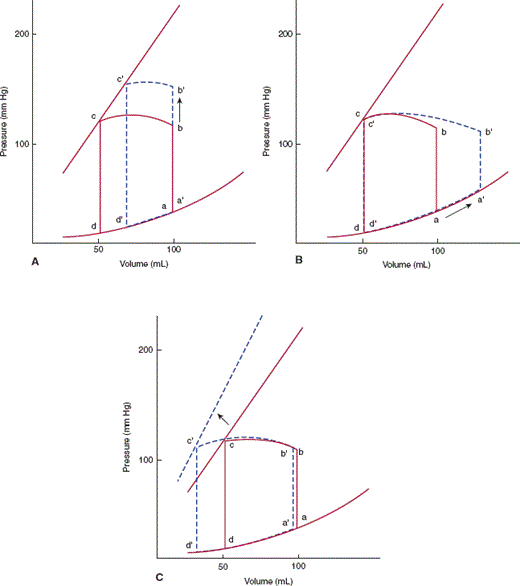
Pressure-volume relationships help illustrate the effects of different stresses on cardiac output. Cardiac output of the ventricle is the product of the heart rate and the volume of blood pumped with each beat (stroke volume). The width of the pressure-volume loop is the difference between end-diastolic volume and end-systolic volume, or the stroke volume (Figure 10–6). The stroke volume is dependent on three parameters: contractility, afterload, and preload (Figure 10–7). Changing the contractile state of the heart will change the width of the pressure-volume loop by changing the position of the isovolumic systolic pressure curve. The impedance against which the heart must work (aortic pressure for the left ventricle) is termed afterload; increased afterload will cause a decrease in stroke volume. Preload is the amount of filling of the ventricle at end-diastole. Up to a point, the more a myocyte or ventricular chamber is stretched, the more it will contract (Frank-Starling relationship), so that increased preload will lead to an increase in stroke volume.
Figure 10–7
A: Increasing afterload from b to b′ decreases stroke volume from bc to b′c′. B: Increasing preload from a to a′ increases stroke volume from bc to b′c′, but at the expense of increased end-diastolic pressure. C: Increasing contractile state shifts the isovolumic pressure-volume relationship leftward, increasing stroke volume from bc to b′c′.
Pressure-time and pressure-volume relationships are critical for understanding the pathophysiologic mechanisms of diseases that affect the entire ventricular chamber function, such as heart failure and valvular abnormalities.
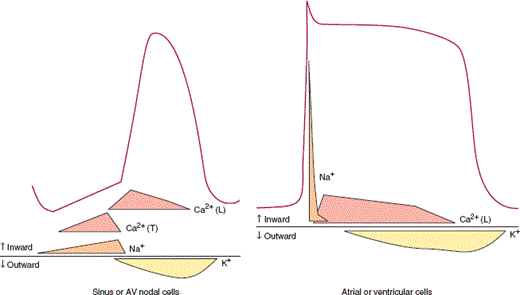
The cellular mechanism of myocyte contraction after electrical stimulation is too complex to be fully addressed in this section, but excellent discussions of electromechanical coupling can be found. Briefly, when the myocyte is stimulated, sodium channels on the cell surface membrane (sarcolemma) open, and sodium ions (Na+) flow down their electrochemical gradient into the cell. This sudden inward surge of ions is responsible for the sharp upstroke of the myocyte action potential (phase 0) (Figure 10–8). A plateau phase follows during which the cell membrane potential remains relatively unchanged owing to the inward flow of calcium ions (Ca2+) and the outward flow of potassium ions (K+) through several different specialized potassium channels. Repolarization occurs because of continued outward flow of K+ after inward flux of Ca2+ has stopped.
Figure 10–8
Changes in ionic conductances responsible for generating action potentials for ventricular or atrial tissue (right) and a sinus or AV node cell (left). In nodal cells rapid Na+ channels are absent, so that the action potential upstroke is much slower. Diastolic depolarization observed in nodal cells is due to decreased K+ efflux and slow Na+ and Ca2+ influx. Ca2+ (T): influx via Ca2+ (T) channels; Ca2+ (L): influx via Ca2+ (L) channels.
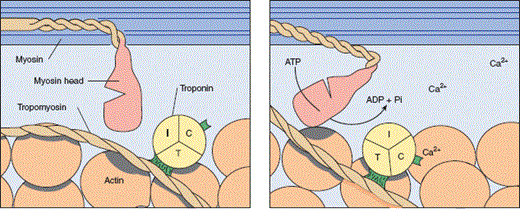
Within the cell, the change in membrane potential from the sudden influx of Na+ and the subsequent increase in intracellular Ca2+ causes the sarcoplasmic reticulum to release large numbers of calcium ions via specialized Ca2+ release channels. The exact signaling mechanism is not known. Once in the cytoplasm, however, Ca2+ released from the sarcoplasmic reticulum binds with the regulatory proteins troponin and tropomyosin. Myosin and actin are then allowed to interact and the cross-bridges between them bend, giving rise to contraction (Figure 10–9). The process of relaxation is poorly understood also but appears to involve return of Ca2+ to the sarcoplasmic reticulum via two transmembrane sarcoplasmic reticulum-embedded proteins: Ca2+-ATPase and phospholamban. Reuptake of Ca2+ is an active process that requires adenosine triphosphate (ATP).
Figure 10–9
Initiation of muscle contraction by Ca2+. When Ca2+ binds to troponin C, tropomyosin is displaced laterally, exposing the binding site for myosin on actin (dark area). Hydrolysis of ATP then changes the conformation of the myosin head and fosters its binding to the exposed site. For simplicity, only one of the two heads of the myosin-II molecule is shown. (Redrawn, with permission, from Ganong WF. Review of Medical Physiology, 22nd ed. McGraw-Hill, 2005.)
The action potential of pacemaker cells is different from that described for ventricular and atrial myocytes (Figure 10–8). Fast sodium channels are absent, so that rapid phase 0 depolarization is not observed in SA nodal and AV nodal cells. In addition, these cells are characterized by increased automaticity from a relatively rapid spontaneous phase 4 depolarization. A combination of reduced outward flow of K+ and inward flow of Na+ and Ca2+ via specialized channels appears to be responsible for this dynamic change in membrane potential. Myofibrils are sparse, although present, in the specialized pacemaker cells.
Checkpoint
1. What are the differences in pacemaker and conduction properties in different regions of the heart, and why do these differences explain the observation that cardiac electrical impulses normally arise in the SA node?
2. Describe pressure-time analysis through the cardiac cycle.
3. Describe pressure-volume analysis through the cardiac cycle.
4. What are preload and afterload?
5. Briefly describe the molecular mechanism of electromechanical coupling in cardiac myocyte contraction.
Pathophysiology of Selected Cardiovascular Disorders
At rest, the heart is normally activated at a rate of 50–100 bpm. Abnormal rhythms of the heart (arrhythmias) can be classified as either too slow (bradycardias) or too fast (tachycardias).
Bradycardia can arise from two basic mechanisms. First, reduced automaticity of the sinus node can result in slow heart rates or pauses. As shown in Figure 10–10, if sinus node pacemaker activity ceases, the heart will usually be activated at a slower rate by other cardiac tissues with pacemaker activity. Reduced sinus node automaticity can occur during periods of increased vagal tone (sleep, carotid sinus massage, “common faint”), with increasing age and secondary to drugs (beta blockers, calcium channel blockers).
Second, slow heart rates can occur if the cardiac impulse is prevented from activating the ventricles normally because of blocked conduction (Figure 10–11). Because the fibrous valvular annulus is electrically inert, the AV node and His bundle normally form the only electrically active connection between the atria and the ventricles. Although this arrangement is useful for preventing feedback between the two chambers, it also makes the AV node and His bundle vulnerable sites for blocked conduction between the atria and ventricles. Although block can be observed in either the left or right bundle branches, bradycardia does not necessarily occur, because the ventricles can still be activated by the contralateral bundle. Atrioventricular block has been classified as first degree when there is an abnormally long atrioventricular conduction time (PR interval >0.22 s) but activation of the atria and ventricles still demonstrates 1:1 association. In second-degree atrioventricular block, some but not all atrial impulses are conducted to the ventricles. Finally, in third-degree block, there is no association between atrial and ventricular activity. Atrioventricular block can occur with increasing age, with increased vagal input, and as a side effect of certain drugs. Atrioventricular block can sometimes be observed also in congenital disorders such as muscular dystrophy, tuberous sclerosis, and maternal systemic lupus erythematosus and in acquired disorders such as sarcoidosis, gout, Lyme disease, systemic lupus erythematosus, ankylosing spondylitis, and coronary artery disease.
Bradycardia resulting from either decreased automaticity or blocked conduction requires evaluation to search for reversible causes. However, implantation of a permanent pacemaker is often required.
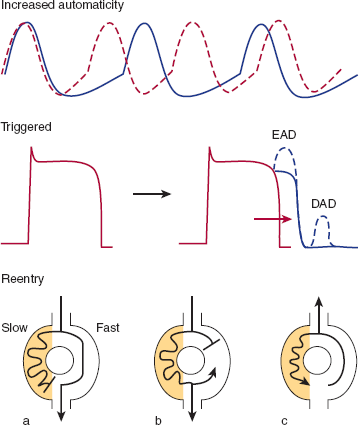
Tachycardias can arise from three basic cellular mechanisms (Figure 10–12). First, increased automaticity resulting from more rapid phase 4 depolarization can cause rapid heart rate. Second, if repolarization is delayed (longer plateau period), spontaneous depolarizations (caused by reactivation of sodium or calcium channels) can sometimes occur in phase 3 or phase 4 of the action potential. These depolarizations are called triggered activity because they are dependent on the existence of a preceding action potential. If these depolarizations reach threshold, tachycardia can occur in certain pathologic conditions. Third, and most commonly, tachycardias can arise from a reentrant circuit. Any condition that gives rise to parallel but electrically separate regions with different conduction velocities (such as the border zone of a myocardial infarction or an accessory atrioventricular connection) can serve as the substrate for a reentrant circuit.
Figure 10–12
Tachyarrhythmias can arise from three different mechanisms. First, increased automaticity from more rapid phase 4 depolarization can cause arrhythmias. Second, in certain conditions, spontaneous depolarizations during phase 3 (early afterdepolarizations; EAD) or phase 4 (late afterdepolarizations; DAD) can repetitively reach threshold and cause tachycardia. This appears to be the mechanism of the polymorphic ventricular tachycardia (torsades de pointes) observed in some patients taking procainamide or quinidine and the arrhythmias associated with digoxin toxicity. Third, the most common mechanism for tachyarrhythmia is reentry. In reentry, two parallel pathways with different conduction properties exist (perhaps at the border zone of a myocardial infarction or a region of myocardial ischemia). The electrical impulse normally travels down the fast pathway and the slow pathway (shaded region), but at the point where the two pathways converge the impulse traveling down the slow pathway is blocked since the tissue is refractory from the recent depolarization via the fast pathway (a). However, when a premature beat reaches the circuit, block can occur in the fast pathway, and the impulse will travel down the slow pathway (shaded region) (b). After traveling through the slow pathway the impulse can then enter the fast pathway in retrograde fashion (which because of the delay has recovered excitability), and then reenter the slow pathway to start a continuous loop of activation, or reentrant circuit (c).
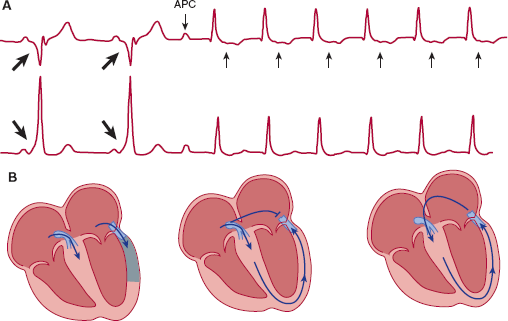
The best studied example of reentrant tachyarrhythmias is Wolff-Parkinson-White syndrome (Figure 10–13). As mentioned, the AV node normally forms the only electrical connection between the atria and the ventricles. Perhaps because of incomplete formation of the annulus, an accessory atrioventricular connection is found in approximately 1 in 1000 persons. This accessory pathway is usually composed of normal atrial or ventricular tissue. Because part of the ventricle is “pre-excited” over the accessory pathway rather than via the AV node, the surface ECG shows a short PR interval and a relatively wide QRS with a slurred upstroke, termed a delta wave. Because the atria and ventricles are linked by two parallel connections, reentrant tachycardias are readily initiated. For example, a premature atrial contraction could be blocked in the accessory pathway but still conduct to the ventricles via the AV node. If enough time has elapsed so that the accessory pathway has recovered excitability, the cardiac impulse can travel in retrograde fashion to the atria over the accessory pathway and initiate a reentrant tachycardia.
Figure 10–13
Reentrant tachyarrhythmia resulting from Wolff-Parkinson-White syndrome. A: First two beats demonstrate sinus rhythm with preexcitation of the ventricles over an accessory pathway. The large arrows show the delta wave. An atrial premature contraction (APC) blocks in the accessory pathway, which leads to normalization of the QRS, and the atria are activated in retrograde fashion via the accessory pathway (small arrows) and supraventricular tachycardia ensues. B: The left panel schematically depicts the first two beats of the rhythm strip. The QRS is wide owing to activation of the ventricles over both the AV node and the accessory pathway. The middle panel depicts the atrial premature contraction, which is blocked in the accessory pathway but conducts over the AV node. In the right panel, the atria are activated in retrograde fashion over the accessory pathway, and a reentrant circuit is initiated.
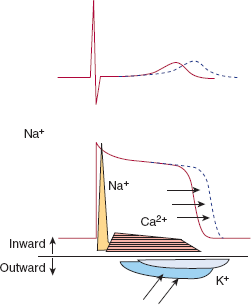
The best example of tachycardias from triggered activity is the long QT syndrome. More than 40 years ago, investigators described several clusters of patients with a congenital syndrome associated with a long QT interval and ventricular arrhythmias. Data have shown that the long QT interval can be due to several specific ion channel defects. For example, reduced function of potassium channels leads to a prolonged plateau period (Figure 10–14). The prolonged plateau phase in ventricular tissue leads to a prolonged QT interval. These patients are prone to triggered activity because of reactivation of sodium and calcium channels (early after depolarizations). Triggered activity in the ventricles can lead to life-threatening ventricular arrhythmias.
Figure 10–14
In certain patients with the long QT syndrome, potassium channel function is reduced (diagonal arrows), which leads to prolongation of the action potential of ventricular myocytes and prolongation of the QT interval. In some cases, reactivation of sodium and calcium channels can lead to triggered activity that can initiate life-threatening ventricular arrhythmias.
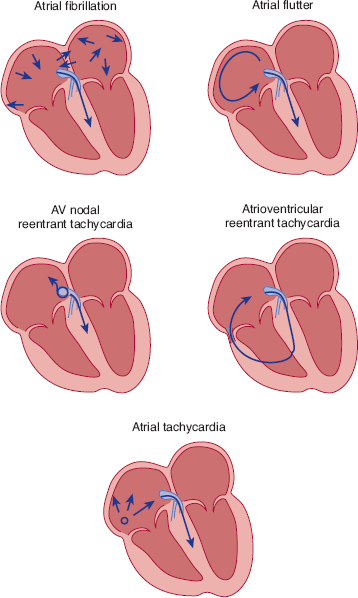
Regardless of the mechanism, the approach to immediate clinical management of tachycardias depends on whether the QRS complex is narrow or wide. If the QRS complex is narrow, depolarization of the ventricles must be occurring normally over the specialized conduction tissues of the heart, and the arrhythmia must be originating at or above the AV node (supraventricular) (Figure 10–15).
Figure 10–15
In supraventricular tachycardia, the QRS is narrow because the ventricles are depolarized over the normal specialized conduction tissues (light blue region). Five possible arrhythmias are commonly encountered. First, in atrial fibrillation, multiple microreentrant circuits can lead to chaotic activation of the atrium. Because impulses are reaching the AV node at irregular intervals, ventricular depolarization is irregular. Second, in atrial flutter, a macroreentrant circuit, traveling up the interatrial septum and down the lateral walls, can activate the atria in a regular fashion at approximately 300 bpm. The AV node can conduct only every other or every third beat, so that the ventricles are depolarized at 150 or 100 bpm. In AV nodal reentrant tachycardia, slow and fast pathways exist in the region of the AV node and a microreentrant circuit can be formed. Fourth, in atrioventricular reentry, an abnormal connection between the atrium and ventricle exists so that a macroreentrant circuit can be formed with the AV node forming the slow pathway, and the abnormal atrioventricular connection, the fast pathway. Finally, in atrial tachycardia an abnormal focus of atrial activity as a result of either reentry, triggered activity, or abnormal automaticity can activate the atria in a regular fashion.
A wide QRS complex suggests that ventricular activation is not occurring normally over the specialized conduction tissues of the heart. The tachycardia either is arising from ventricular tissue or is a supraventricular tachycardia with aberrant conduction over the His-Purkinje system or an accessory pathway. Criteria have been developed for distinguishing between ventricular and supraventricular tachycardia with aberrance.
Inadequate pump function of the heart, which leads to congestion resulting from fluid in the lungs and peripheral tissues, is a common end result of many cardiac disease processes. Heart failure (HF) is present in approximately 3 million people in the United States; more than 400,000 new cases are reported annually. The clinical presentation is highly variable; for an individual patient, symptoms and signs depend on how quickly heart failure develops and whether it involves the left, right, or both ventricles.
Patients with left ventricular failure most commonly present with a sensation of breathlessness (dyspnea), particularly when lying down (orthopnea) or at night (paroxysmal nocturnal dyspnea). In addition, the patient may complain of blood-tinged sputum (hemoptysis) and occasionally chest pain. Fatigue, nocturia, and confusion can also be caused by heart failure.
On physical examination, the patient usually has elevated respiratory and heart rates. The skin may be pale, cold, and sweaty. In severe heart failure, palpation of the peripheral pulse may reveal alternating strong and weak beats (pulsus alternans). Auscultation of the lungs reveals abnormal sounds, called rales, that have been described as “crackling leaves.” In addition, the bases of the lung fields may be dull to percussion. On cardiac examination, the apical impulse is often displaced laterally and sustained. Third and fourth heart sounds can be heard on auscultation of the heart. Because many patients with left ventricular failure also have accompanying failure of the right ventricle, signs of right ventricular failure may also be present (see next section).
Heart failure is a pathophysiologic complex associated with dysfunction of the heart and is a common end point for many diseases of the cardiovascular system. There are many possible causes (Table 10–1), and the specific reason for heart failure in a given patient must always be sought. In general, heart failure can be caused by (1) inappropriate workloads placed on the heart, such as volume overload or pressure overload; (2) restricted filling of the heart; (3) myocyte loss; or (4) decreased myocyte contractility. Any one of these causes can initiate an evolving sequence of events that are described next.
| Volume overload |
|
|
|
|
|
|
|
|
|
The pathophysiology of heart failure is complex and must be understood at multiple levels. Traditionally, research has focused on the hemodynamic changes of the failing heart, considering the heart as an isolated organ. However, studies of the failing heart have emphasized the importance of understanding changes at the cellular level and the neuro-hormonal interactions between the heart and other organs of the body (Table 10–2).
|
|
|
|
|
|
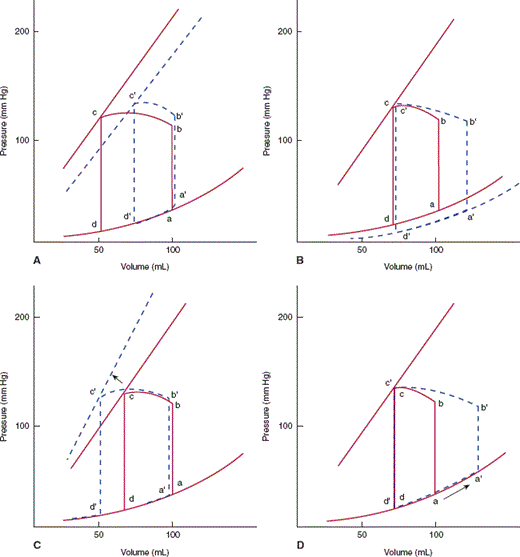
From a hemodynamic standpoint, heart failure can arise from worsening systolic or diastolic function or, more frequently, a combination of both. In systolic dysfunction, the isovolumic systolic pressure curve of the pressure-volume relationship is shifted downward (Figure 10–16A). This reduces the stroke volume of the heart with a concomitant decrease in cardiac output. To maintain cardiac output, the heart can respond with three compensatory mechanisms: First, increased return of blood to the heart (preload) can lead to increased contraction of sarcomeres (Frank-Starling relationship). In the pressure-volume relationship, the heart operates at a′ instead of a, and stroke volume increases, but at the cost of increased end-diastolic pressure (Figure 10–16D). Second, increased release of catecholamines can increase cardiac output by both increasing the heart rate and shifting the systolic isovolumetric curve to the left (Figure 10–16C). Finally, cardiac muscle can hypertrophy and ventricular volume can increase, which shifts the diastolic curve to the right (Figure 10–16B). Although each of these compensatory mechanisms can temporarily maintain cardiac output, each is limited in its ability to do so, and if the underlying reason for systolic dysfunction remains untreated, the heart ultimately fails.
Figure 10–16
A: Systolic dysfunction is represented by shifting of the isovolumic pressure-volume curve to the right (dashed line), thus decreasing stroke volume. The ventricle can compensate by (B) shifting the diastolic pressure-volume relationship rightward (dashed line) by increasing left ventricular volume or elasticity, (C) increasing contractile state (dashed line) by activation of circulating catecholamines, and (D) increasing filling or preload (a to a′).
In diastolic dysfunction, the position of the systolic isovolumic curve remains unchanged (contractility of the myocytes is preserved). However, the diastolic pressure-volume curve is shifted to the left, with an accompanying increase in left ventricular end-diastolic pressure and symptoms of heart failure (Figure 10–17). Diastolic dysfunction can be present in any disease that causes decreased relaxation, decreased elastic recoil, or increased stiffness of the ventricle. Hypertension often leads to compensatory increases in left ventricular wall thickness that can cause diastolic dysfunction by changing all three parameters. Lack of sufficient blood to myocytes (ischemia) can also cause diastolic dysfunction by decreasing relaxation. If ischemia is severe, as in myocardial infarction, irreversible damage to the myocytes can occur, with replacement of contractile cells by fibrosis, which will lead to systolic dysfunction. In most patients, a combination of systolic and diastolic dysfunction is responsible for the symptoms of heart failure.
After an injury to the heart (Table 10–1), increased secretion of endogenous neuro-hormones and cytokines is observed. Initially, increased activity of the adrenergic system and the renin-angiotensin system provides a compensatory response that maintains perfusion of vital organs. However, over time these changes can lead to progressive deterioration of cardiac function.
Increased sympathetic activity occurs early in the development of heart failure. Elevated plasma norepinephrine levels cause increased cardiac contractility and an increased heart rate that initially help maintain cardiac output. However, continued increases lead to increased preload (as a result of venous vasoconstriction) and afterload (from arterial vasoconstriction), which can worsen heart failure. In addition, sympathetic hyperactivity causes deleterious cellular changes, which are discussed in the next section.
Reduced renal blood pressure stimulates the release of renin and increases the production of angiotensin II. Both angiotensin II and sympathetic activation cause efferent glomerular arteriolar vasoconstriction, which helps maintain the glomerular filtration rate despite a reduced cardiac output. Angiotensin II stimulates aldosterone synthesis, which leads to sodium resorption and potassium excretion by the kidneys. However, a vicious circle is initiated as continued hyperactivity of the renin-angiotensin system leads to severe vasoconstriction, increased afterload, and further reduction in cardiac output and glomerular filtration rate.
Heart failure is associated with increased release of vasopressin from the posterior pituitary gland. Vasopressin is another powerful vasoconstrictor that also promotes reabsorption of water in the renal tubules.
Heart failure is associated with the release of cytokines and other circulating peptides. Cytokines are a heterogeneous family of proteins that are secreted by macrophages, lymphocytes, monocytes, and endothelial cells in response to injury. The interleukins (ILs) and tumor necrosis factor (TNF) are the two major groups of cytokines that may have an important pathophysiologic role in heart failure. Upregulation of the gene responsible for TNF with an accompanying increase in circulating plasma levels of TNF has been found in patients with heart failure. TNF appears to have an important role in the cycle of myocyte hypertrophy and cell death (apoptosis) described in the next section. Preliminary in vitro data suggest that IL-1 may accelerate myocyte hypertrophy. Another peptide important for mediating some of the pathophysiologic effects observed in heart failure is the potent vasoconstrictor endothelin, which is released from endothelial cells. Preliminary data have suggested that excessive endothelin release may be responsible for hypertension in the pulmonary arteries observed in patients with left ventricular heart failure. Endothelin is also associated with myocyte growth and deposition of collagen in the interstitial matrix.
Pathophysiologic changes at the cellular level are very complex and include changes in Ca2+ handling, adrenergic receptors, contractile apparatus, and myocyte structure.
In heart failure, both delivery of Ca2+ to the contractile apparatus and reuptake of Ca2+ by the sarcoplasmic reticulum are slowed. Decreased levels of messenger ribonucleic acid (mRNA) for the specialized Ca2+ release channels have been reported by some investigators. Similarly, myocytes from failing hearts have reduced levels of mRNA for the two sarcoplasmic reticulum proteins phospholamban and Ca2+-ATPase.
Two major classes of adrenergic receptors are found in the human heart. Alpha1-adrenergic receptors are important for induction of myocardial hypertrophy; levels of α1 receptors are slightly increased in heart failure. Heart failure is associated with significant β-adrenergic receptor desensitization as a result of chronic sympathetic activation. This effect is mediated by downregulation of β1-adrenergic receptors, downstream uncoupling of the signal transduction pathway, and upregulation of inhibitory G proteins. All of these changes lead to a further reduction in myocyte contractility.
Cardiac myocytes cannot proliferate once they have matured to their adult form. However, there is a constant turnover of the contractile proteins that make up the sarcomere. In response to the hemodynamic stresses associated with heart failure, angiotensin II, TNF, norepinephrine, and other molecules induce protein synthesis via intranuclear mediators of gene activity such as c-fos, c-jun, and c-myc. This causes myocyte hypertrophy with an increase in sarcomere numbers and a re-expression of fetal and neonatal forms of myosin and troponin. Activation of this primitive program results in the development of large myocytes that do not contract normally and have decreased ATPase activity.
The heart enlarges in response to continued hemodynamic stress. Changes in myocardial size and shape associated with heart failure are collectively referred to as left ventricular remodeling. Several tissue changes appear to mediate this process. First, heart failure is associated with myocyte loss via a process called apoptosis (programmed cell death). Unlike the process of necrosis, apoptotic cells initially demonstrate decreased cell volume without disruption of the cell membrane. However, as the apoptotic process continues, the myocyte ultimately dies, and “holes” are left in the myocardium. Loss of myocytes places increased stress on the remaining myocytes. The process of apoptosis is accelerated by the proliferative signals that stimulate myocyte hypertrophy such as TNF. Although apoptosis is a normal process that is essential in organs made up of proliferating cells, in the heart apoptosis initiates a vicious circle whereby cell death causes increased stress that leads to hypertrophy and further acceleration of apoptosis.
A second tissue change observed in heart failure is an increased amount of fibrous tissue in the interstitial spaces of the heart. Collagen deposition is due to activation of fibroblasts and myocyte death. Endothelin release leads to interstitial collagen deposition. The increase in connective tissue increases chamber stiffness and shifts the diastolic pressure-volume curve to the left.
Finally, heart failure is associated with gradual dilation of the ventricle. Myocyte “slippage” as a result of activation of collagenases that disrupt the collagen network may be responsible for this process.
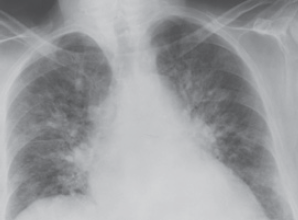
Shortness of breath, orthopnea, paroxysmal nocturnal dyspnea—Although many details of the physiologic mechanisms for the sensation of breathlessness are unclear, the inciting event probably is a rise in pulmonary capillary pressures as a consequence of elevated left ventricular and atrial pressures. The rise in pulmonary capillary pressure relative to plasma oncotic pressure causes fluid to move into the interstitial spaces of the lung (pulmonary edema), which can be seen on chest x-ray film (Figure 10–18). Interstitial edema probably stimulates juxtacapillary J receptors, which in turn causes reflex shallow and rapid breathing. Replacement of air in the lungs by blood or interstitial fluid can cause a reduction of vital capacity, restrictive physiology, and air trapping as a result of closure of small airways. The work of breathing increases as the patient tries to distend stiff lungs, which can lead to respiratory muscle fatigue and the sensation of dyspnea. Alterations in the distribution of ventilation and perfusion result in relative ventilation-perfusion mismatch, with consequent widening of the alveolar-arterial O2 gradient, hypoxemia, and increased dead space. Edema of the bronchial walls can lead to small airway obstruction and produce wheezing (“cardiac asthma”). Shortness of breath occurs in the recumbent position (orthopnea) because of reduced blood pooling in the extremities and abdomen, and, because the patient is operating on the steep portion of the diastolic pressure-volume curve, any increase in blood return leads to marked elevations in ventricular pressures. Patients usually learn to minimize orthopnea by sleeping with the upper body propped up by two or more pillows. Sudden onset of severe respiratory distress at night—paroxysmal nocturnal dyspnea—probably occurs because of the reduced adrenergic support of ventricular function that occurs with sleep, the increase in blood return as described previously, and normal nocturnal depression of the respiratory center.
Fatigue, confusion—Fatigue probably arises because of inability of the heart to supply appropriate amounts of blood to skeletal muscles. Confusion may arise in advanced heart failure because of under-perfusion of the cerebrum.
Nocturia—Heart failure can lead to reduced renal perfusion during the day while the patient is upright, which normalizes only at night while the patient is supine, with consequent diuresis.
Chest pain—If the cause of failure is coronary artery disease, patients may have chest pain secondary to ischemia (angina pectoris). In addition, even without ischemia, acute heart failure can cause chest pain by unknown mechanisms.
Figure 10–18
Posteroanterior chest x-ray film in a man with acute pulmonary edema resulting from left ventricular failure. Note the bat’s wing density, cardiac enlargement, increased size of upper lobe vessels, and pulmonary venous congestion. (Reproduced, with permission, from Cheitlin MD et al, eds. Clinical Cardiology, 6th ed. Originally published by Appleton & Lange. Copyright © 1993 by The McGraw-Hill Companies, Inc.)
Rales, pleural effusion—Increased fluid in the alveolar spaces from the mechanisms described previously can be heard as rales. Increased capillary pressures can also cause fluid accumulation in the pleural spaces.
Displaced and sustained apical impulse—In most people, contraction of the heart can be appreciated by careful palpation of the chest wall (apical impulse). The normal apical impulse is felt in the midclavicular line in the fourth or fifth intercostal space and is palpable only during the first part of systole. When the apical impulse can be felt during the latter part of systole, it is sustained. Sustained impulses suggest that increases in left ventricular volume or mass are present. In addition, when left ventricular volume is increased as a compensatory mechanism of heart failure, the apical impulse is displaced laterally.
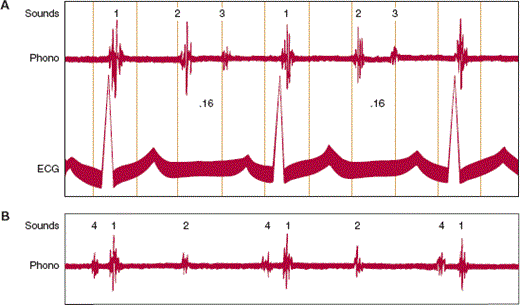
Third heart sound (S3)—The third heart sound is a low-pitched sound that is heard during rapid filling of the ventricle in early diastole (Figure 10–19A). The exact mechanism responsible for the genesis of the third heart sound is not known, but the sound appears to result either from the sudden deceleration of blood as the elastic limits of the ventricular chamber are reached or from the actual impact of the ventricular wall against the chest wall. Although a third heart sound is normal in children and young adults, it is rarely heard in healthy adults older than 40 years. In these individuals, the presence of a third heart sound is almost pathognomonic of ventricular failure. The increased end-systolic volumes and pressures characteristic of the failing heart are probably responsible for the prominent third heart sound. When it arises because of left ventricular failure, the third heart sound is usually heard best at the apex. It can be present in patients with either diastolic or systolic dysfunction.
Fourth heart sound (S4)—Normally, sounds arising from atrial contraction are not heard. However, if there is increased stiffness of the ventricle, a low-pitched sound at end-diastole that occurs concomitantly with atrial contraction can sometimes be heard (Figure 10–19B). As with the third heart sound, the exact mechanism for the genesis of the fourth heart sound is not known. However, it probably arises from the sudden deceleration of blood in a noncompliant ventricle or from the sudden impact of a stiff ventricle against the chest wall. It is best heard laterally over the apex at the point of maximal impulse, particularly when the patient is partially rolled over onto the left side. The fourth heart sound is commonly heard in any patient with heart failure resulting from diastolic dysfunction.
Pale, cold, and sweaty skin—Patients with severe heart failure often have peripheral vasoconstriction, which maintains blood flow to the central organs and head. In some cases, the skin appears dusky because of reduced oxygen content in venous blood as a result of increased oxygen extraction from peripheral tissues that are receiving low blood flow. Sweating occurs because body heat cannot be dissipated through the constricted vascular bed of the skin.
Symptoms of right ventricular failure include shortness of breath, pedal edema, and abdominal pain.
The findings on physical examination are similar to those of left ventricular failure but in different positions, because the right ventricle is anatomically anterior and to the right of the left ventricle (Figure 10–1). Patients with right ventricular failure may have a third heart sound heard best at the sternal border or a sustained systolic heave of the sternum. Inspection of the neck reveals elevated jugular venous pressures. Because the most common cause of right ventricular failure is left ventricular failure, signs of left ventricular failure are often also present.
Right ventricular failure can be due to several causes. As mentioned, left ventricular failure can cause right ventricular failure because of the increased afterload placed on the right ventricle. Increased afterload can also be present from abnormalities of the pulmonary arteries or capillaries. For example, increased flow from a congenital shunt can cause reactive pulmonary artery constriction, increased right ventricular afterload, and, ultimately, right ventricular failure. Right ventricular failure can occur as a sequela of pulmonary disease (cor pulmonale) because of destruction of the pulmonary capillary bed or hypoxia-induced vasoconstriction of the pulmonary arterioles. Right ventricular failure can also be caused by right ventricular ischemia, usually in the setting of an inferior wall myocardial infarction (Table 10–3).
|
