Carbohydrate Metabolism


Carbohydrate Metabolism


This chapter discusses carbohydrate metabolism and its abnormalities, with emphasis on diabetes mellitus and hypoglycaemia. In the next decade it is predicted that there will be about 250 million people worldwide with type 2 diabetes mellitus.


CHEMISTRY

The main monosaccharide hexoses are reducing sugars. Naturally occurring polysaccharides are long-chain carbohydrates composed of glucose subunits (Table 12.1):


  • Starch, found in plants, is a mixture of amylose (straight chains) and amylopectin (branched chains).


  • Glycogen, found in animal tissue, is a highly branched polysaccharide.


PHYSIOLOGY


Functions of extracellular glucose

The main function of glucose is as a major tissue energy source. The simplified pathways of glycolysis and the Krebs cycle [tricarboxylic acid (TCA) cycle] are shown in Figures 12.1 and 12.2. The brain is highly dependent upon the extracellular glucose concentration for its energy supply; indeed, hypoglycaemia is likely to impair cerebral function or even lead to irreversible neuronal damage. This is because the brain cannot:


Table 12.1 Common reducing and non-reducing sugars


Reducing sugars


Non-reducing sugars


Monosaccharides


Glucose


Fructose


Galactose


Disaccharides


Lactose (galactose + glucose)


Sucrose (fructose + glucose)


Maltose (glucose + glucose)


  • synthesize glucose,


  • store glucose in significant amounts,


  • metabolize substrates other than glucose and ketones


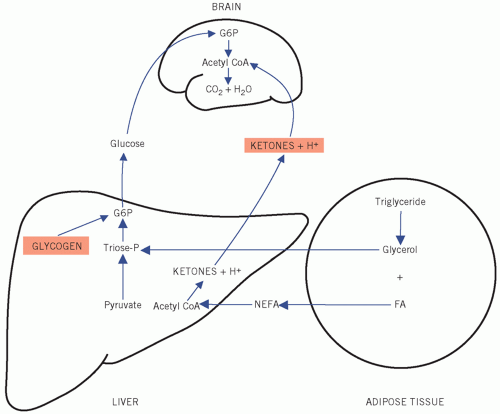
    • plasma ketone concentrations are usually very low and ketones are of little importance as an energy source under physiological conditions,


  • extract enough glucose from the extracellular fluid (ECF) at low concentrations for its metabolic needs, because entry into brain cells is not facilitated by insulin.

Normally the plasma glucose concentration remains between about 4 mmol/L and 10 mmol/L, despite the intermittent load entering the body from the diet. The maintenance of plasma glucose concentrations below about 10 mmol/L minimizes loss from the body as well as providing the optimal supply to the tissues. Renal tubular cells reabsorb almost all the glucose filtered by the glomeruli, and urinary glucose concentration is normally too low to be detected by the usual tests,
even after a carbohydrate meal. Significant glycosuria usually occurs only if the plasma glucose concentration exceeds about 10 mmol/L – the renal threshold.


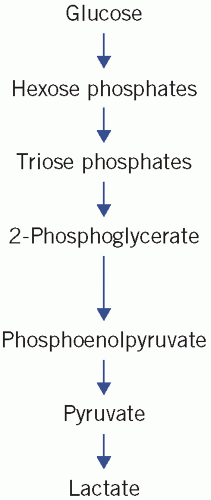
Figure 12.1 Simplification of glycolysis pathways. Reproduced with kind permission from Candlish JK and Crook M. Notes on Clinical Biochemistry. Singapore: World Scientific Publishing, 1993.


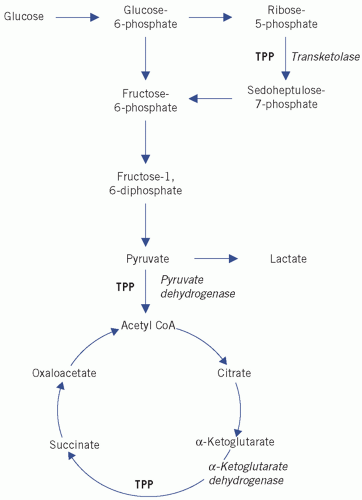
Figure 12.2 Simplification of the tricarboxylic acid (Krebs) cycle. CoA, coenzyme A; TPP, thiamine pyrophosphate. Reproduced with kind permission from Candlish JK and Crook M. Notes on Clinical Biochemistry. Singapore: World Scientific Publishing, 1993.


How the body maintains extracellular glucose concentrations


Control of plasma glucose concentration

During normal metabolism, little glucose is lost unchanged from the body. Maintenance of plasma glucose concentrations within the relatively narrow range of 4-10 mmol/L, despite the widely varying input from the diet, depends on the balance between the glucose entering cells from the ECF and that leaving them into this compartment.


Hormones concerned with glucose homeostasis

Some of the more important effects of hormones on glucose homeostasis are summarized in Table 12.2.


Insulin

Insulin is the most important hormone controlling plasma glucose concentrations. A plasma glucose concentration of greater than about 5 mmol/L acting via the glucose transporter 2 stimulates insulin release from the pancreas β-cell. These cells produce proinsulin, which consists of the 51-amino-acid polypeptide insulin and a linking peptide (C-peptide, Fig. 12.3). Splitting of the peptide bonds by prohormone convertases releases via intermediates (mostly 32-33 split proinsulin) equimolar amounts of insulin and C-peptide into the ECF.

Insulin binds to specific cell surface receptors on muscle and adipose tissue, thus enhancing the rate of glucose entry into these cells. Insulin-induced activation of enzymes stimulates glucose incorporation into glycogen (glycogenesis) in liver and muscle (Fig 12.4). Insulin also inhibits the production of glucose (gluconeogenesis) from fats and amino acids, partly by inhibiting fat and protein breakdown (lipolysis and proteolysis).

The transport of glucose into liver cells is insulin independent but, by reducing the intracellular glucose concentration, insulin does indirectly promote the passive diffusion of glucose into them. Insulin also directly increases the transport of amino acids, potassium and phosphate into cells, especially muscle; these processes are independent of glucose transport. In the longer term, insulin regulates growth and development and the expression of certain genes.


Glucagon

Glucagon is a single-chain polypeptide synthesized by the a-cells of the pancreatic islets. Its secretion is stimulated by hypoglycaemia. Glucagon enhances hepatic glycogenolysis (glycogen breakdown) and gluconeogenesis.


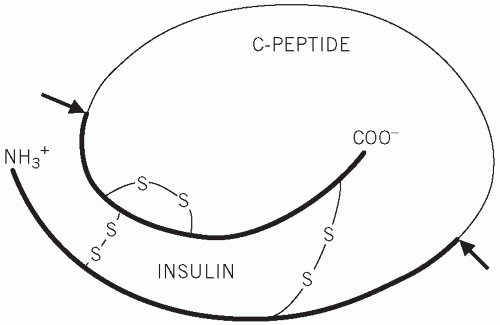
Figure 12.3 Structure of proinsulin, indicating the cleavage sites at which insulin and C-peptide are produced.


Table 12.2 Action of hormones that affect intermediary metabolism


Insulin


Glucagon


Growth hormone


Glucocorticoids


Adrenaline


Carbohydrate metabolism


In liver


Glycolysis


+


Glycogenesis


+


Glycogenolysis


+


+


Gluconeogenesis


+


+


In muscle


Glucose uptake


+


Glycogenesis


+


Glycogenolysis


+


Protein metabolism


Synthesis


+


+


Breakdown


+


Lipid metabolism


Synthesis


+


Lipolysis


+


+


+


Secretion


Stimulated by


Hyperglycaemia


Hypoglycaemia


Hypoglycaemia


Hypoglycaemia


Hypoglycaemia


Amino acids


Amino acids


Stress


Stress


Stress


Glucagon


Fasting


Sleep


Gut hormones


Inhibited by


Adrenaline


Insulin


Somatostatin


Glucocorticoids


β-blockers


Fasting


IGF-1


Somatostatin


Plasma NEFA concentrations


Fall


Rise


Rise


Rise


Rise


Plasma glucose concentrations


Fall


Rise


Rise


Rise


Rise


+, stimulates; -, inhibits; IGF-1, insulin-like growth factor 1; NEFA, non-esterified fatty acid.


Somatostatin

This peptide hormone is released from the D cells of the pancreas and inhibits insulin and growth hormone release.


Other hormones

When plasma insulin concentrations are low, for example during fasting, the hyperglycaemic actions of hormones, such as growth hormone (GH), glucocorticoids, adrenaline (epinephrine) and glucagon, become apparent, even if there is no increase in secretion rates. Secretion of these so-called counterregulatory hormones may increase during stress and in patients with acromegaly (GH, see Chapter 6), Cushing’s syndrome (glucocorticoids, see Chapter 8) or in phaeochromocytoma (adrenaline and noradrenaline see Chapter 24) and thus oppose the normal action of insulin.


The liver

The liver is the most important organ maintaining a constant glucose supply for other tissues, including the brain. It is also of importance in controlling the postprandial plasma glucose concentration.

Portal venous blood leaving the absorptive area of the intestinal wall reaches the liver first, and consequently the hepatic cells are in a key position to buffer the hyperglycaemic effect of a high-carbohydrate meal (Fig. 12.5).


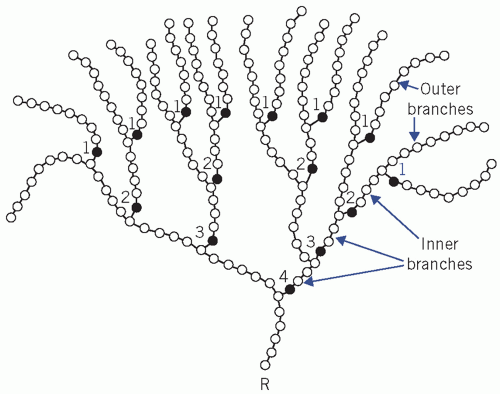
Figure 12.4 Structure of glycogen. Open circles depict glucose moieties in α-1,4 linkage and the black circles those in α-1,6 linkages at branch points. R indicates the reducing end group. The outer branches terminate in non-reducing end groups. Reproduced with permission from Nyhan WL and Barshop BA. Atlas of Inherited Metabolic Diseases, 3rd edition. London: Hodder Arnold, 2012.

The entry of glucose into liver and cerebral cells is not directly affected by insulin, but depends on the extracellular glucose concentration. The conversion of glucose to glucose-6-phosphate (G6P), the first step in glucose metabolism in all cells, is catalysed in the liver by the enzyme glucokinase, which has a low affinity for glucose compared with that of hexokinase, which is found in most other tissues. Glucokinase activity is induced by insulin. Therefore, hepatic cells extract proportionally less glucose during fasting, when concentrations in portal venous plasma are low, than after carbohydrate ingestion. This helps to maintain a fasting supply of glucose to vulnerable tissues such as the brain.

The liver cells can store some of the excess glucose as glycogen. The rate of glycogen synthesis (glycogenesis) from G6P may be increased by insulin secreted by the β-cells of the pancreas in response to systemic hyperglycaemia. The liver can convert some of the excess glucose to fatty acids, which are ultimately transported as triglyceride in very low-density lipoprotein (VLDL) and stored in adipose tissue.

Under normal aerobic conditions, the liver can synthesize glucose by gluconeogenesis using the metabolic products from other tissues, such as glycerol, lactate or the carbon chains resulting from deamination of certain amino acids (mainly alanine) (Table 12.3). The liver contains the enzyme glucose-6-phosphatase, which, by hydrolysing G6P derived from either glycogenolysis or gluconeogenesis, releases glucose and helps to maintain extracellular fasting concentrations. Hepatic glycogenolysis is stimulated by the hormone glucagon, secreted by the α-cells of the pancreas in response to a fall in the plasma glucose concentration, and by catecholamines such as adrenaline or noradrenaline.

During fasting, the liver converts fatty acids, released from adipose tissue as a consequence of low insulin activity, to ketones. The carbon chains of some amino acids may also be converted to ketones (Table 12.3). Ketones can be used by other tissues, including the brain, as an energy source when plasma glucose concentrations are low.


Other organs

The renal cortex is the only other tissue capable of gluconeogenesis, and of converting G6P to glucose. The gluconeogenic capacity of the kidney is particularly important in hydrogen ion homeostasis and during prolonged fasting.

Other tissues, such as muscle, can store glycogen but, because they do not contain glucose-6-phosphatase, they cannot release glucose from cells and so can only use it locally; this glycogen plays no part in maintaining the plasma glucose concentration.


Systemic effects of glucose intake

The liver modifies the potential hyperglycaemic effect of a high-carbohydrate meal by extracting relatively more glucose than in the fasting state from the portal plasma. However, some glucose does pass through the liver and the rise in the systemic concentration
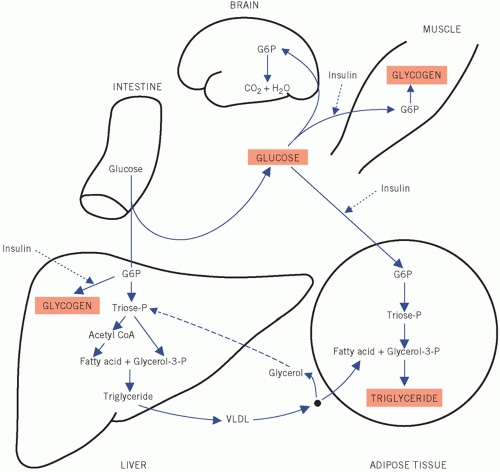
stimulates the β-cells of the pancreas to secrete insulin. Insulin may further enhance hepatic and muscle glycogenesis. More importantly, entry of glucose into adipose tissue and muscle cells, unlike that into liver and brain, is stimulated by insulin and, under physiological conditions, the plasma glucose concentration falls to near fasting levels. Conversion of intracellular glucose to G6P in adipose and muscle cells is catalysed by the enzyme hexokinase, which, because its affinity for glucose is greater than that of hepatic glucokinase, ensures that glucose enters the metabolic pathways in these tissues at lower extracellular concentrations than those in the liver. The relatively high insulin activity after a meal also inhibits the breakdown of triglyceride (lipolysis) and protein (proteolysis). If there is relative or absolute insulin deficiency, as in diabetes mellitus, these actions are impaired. Both muscle and adipose tissue store the excess post-prandial glucose, but the mode of storage and the function of the two types of cell are very different, as will be shown later.


Table 12.3 Metabolism of the carbon skeleton of some amino acids to either carbohydrate (glycogenic) or fat (ketogenic)


Glycogenic


Glycogenic and ketogenic


Ketogenic


Alanine


Isoleucine


Leucine


Arginine


Lysine


Glycine


Phenylalanine


Histidine


Tyrosine


Methionine


Serine


Valine


Figure 12.5 Post-prandial metabolism of glucose. CoA, coenzyme A; G6P, glucose-6-phosphate; Glycerol-3-P, glycerol-3-phosphate; Triose-P, triose phosphate or glyceraldehyde 3-phosphate; VLDL, very low-density lipoprotein.


Ketosis


Adipose tissue and the liver

Adipose tissue triglyceride is the most important longterm energy store in the body. Greatly increased use of fat stores, for example during prolonged fasting, is associated with ketosis. Adipose tissue cells, acting in conjunction with the liver, convert excess glucose to triglyceride and store it in this form rather than as glycogen. The components are both derived from glucose, fatty acids from the glucose entering hepatic cells and glycerol from that entering adipose tissue cells.


In the liver, triglycerides are formed from glycerol-3-phosphate (from triose phosphate or glyceraldehyde-3-phosphate) and fatty acids [from acetyl coenzyme A (CoA)]. The triglycerides are transported to adipose tissue cells incorporated in VLDL, where they are hydrolysed by lipoprotein lipase. The released fatty acids (of hepatic origin) are re-esterified within these cells with glycerol-3-phosphate, derived from glucose, which has entered this tissue under the influence of insulin. The resultant triglyceride is stored and is far more energy dense than glycogen (see Chapter 13).

During fasting, when exogenous glucose is unavailable and the plasma insulin concentration is therefore low, endogenous triglycerides are reconverted to free non-esterified fatty acids (NEFAs) and glycerol by lipolysis (Fig. 12.6). Both are transported to the liver in plasma, the NEFA being protein bound, predominantly to albumin. Glycerol enters the hepatic gluconeogenic pathway at the triose phosphate stage; the glucose synthesized can be released from these cells, thus minimizing the fall in glucose concentrations.


Figure 12.6 Intermediary metabolism during fasting: ketosis. CoA, coenzyme A; FA, fatty acid; G6P, glucose-6-phosphate; NEFA, non-esterified fatty acid.

Most tissues, other than the brain, can oxidize fatty acids to acetyl CoA, which can then be used in the TCA cycle as an energy source. When the rate of synthesis exceeds its use, the hepatic cells produce acetoacetic acid by enzymatic condensation of two molecules of acetyl CoA; acetoacetic acid can be reduced to β-hydroxybutyric acid and decarboxylated to acetone. These ketones can be used as an energy source by brain and other tissues at a time when glucose is in relatively short supply.

Ketosis occurs when fat stores are the main energy source and may result from fasting or from reduced nutrient absorption, for example due to vomiting. Mild ketosis may occur after as little as 12 h of fasting. After short fasts, metabolic acidosis is not usually detectable, but, after longer periods, more hydrogen ions may be produced than can be dealt with by homeostatic buffering mechanisms, depleting the plasma bicarbonate concentration, which therefore falls (see Chapter 4).

The plasma glucose concentration is maintained principally by hepatic gluconeogenesis, but during prolonged starvation, such as that in anorexia nervosa or during childhood, ketotic hypoglycaemia may occur. The
??
During gluconeogenesis, hydrogen ions are reused. Under aerobic conditions, the liver consumes much more lactate than it produces.

The physiological accumulation of lactic acid during muscular contraction is a temporary phenomenon and rapidly disappears at rest, when slowing of glycolysis allows aerobic processes to ‘catch up’.


Pathological lactic acidosis

Lactic acid, produced by anaerobic glycolysis, may either be oxidized to CO2 and water in the TCA cycle or be reconverted to glucose by gluconeogenesis in the liver. Both the TCA cycle and gluconeogenesis need oxygen; anaerobic glycolysis is a non-oxygen-requiring pathway. Pathological accumulation of lactate may occur because:


  • production is increased by an increased rate of anaerobic glycolysis,


  • use is decreased by impairment of the TCA cycle or impairment of gluconeogenesis.

Tissue hypoxia (Fig. 12.8) due to the poor tissue perfusion of the ‘shock’ syndrome is usually the most common cause of lactic acidosis. Hypoxia increases plasma lactate concentrations because:


  • the TCA cycle cannot function anaerobically and oxidation of pyruvate and lactate to CO2 and water is impaired,


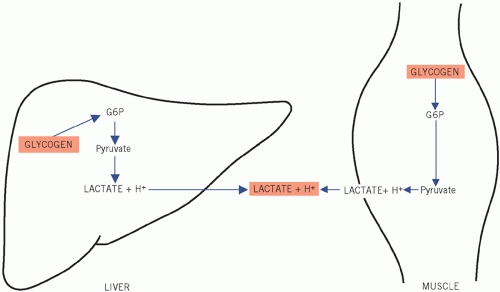
    Figure 12.8 Metabolic pathways during 0tissue hypoxia. G6P, glucose-6-phosphate.


  • hepatic and renal gluconeogenesis from lactate cannot occur anaerobically,


  • anaerobic glycolysis is stimulated because the falling adenosine triphosphate (ATP) levels cannot be regenerated by the TCA cycle under anaerobic conditions.

The combination of impaired gluconeogenesis and increased anaerobic glycolysis converts the liver from an organ that consumes lactate and H+ to one that generates large amounts of lactic acid. Severe hypoxia, for example following a cardiac arrest, causes marked lactic acidosis. If diabetic ketoacidosis is associated with significant volume depletion, this hypoxic syndrome may aggravate the acidosis. (See Chapter 4 for a further discussion of lactic acidosis.)

The glycolytic pathway as well as the TCA cycle are summarized in Figures 12.1 and 12.2.


HYPERGLYCAEMIA AND DIABETES MELLITUS

Hyperglycaemia may be due to:


  • intravenous infusion of glucose-containing fluids,


  • severe stress (usually a transient effect) such as trauma, myocardial infarction or cerebrovascular accidents,


  • diabetes mellitus or impaired glucose regulation.


Diabetes mellitus

Diabetes mellitus is caused by an absolute or relative insulin deficiency. It has been defined by the World Health Organization (WHO), on the basis of laboratory findings, as a fasting venous plasma glucose concentration of 7.0 mmol/L or more (on more than one occasion or once in the presence of diabetes symptoms) or a random venous plasma glucose concentration of 11.1 mmol/L or more. Sometimes an oral glucose tolerance test (OGTT) may be required to establish the diagnosis in equivocal cases. The interpretation of this test is shown below, but, briefly, diabetes mellitus can be diagnosed if the venous plasma glucose concentration is 7.0 mmol/L or more (fasting) and/or 11.1 mmol/L or more 2 h after the oral ingestion of the equivalent of 75 g of anhydrous glucose. Diabetes mellitus can be classified into the following categories.


Type 1 diabetes mellitus

Previously called insulin-dependent diabetes mellitus, this is the term used to describe the condition in patients for whom insulin therapy is essential because they are prone to develop ketoacidosis. It usually presents during childhood or adolescence. Most of these cases are due to immune-mediated processes and may be associated with other autoimmune disorders such as Addison’s disease, vitiligo and Hashimoto’s thyroiditis. It has been suggested that many cases follow a viral infection that has damaged the β-cells of the pancreatic islets. Individuals most at risk are those with human leucocyte antigen (HLA) types DR3 and DR4 of the major histocompatibility complex. Autoantibodies to islet cells, insulin, tyrosine phosphatases IA-2 and IA-2β and glutamic decarboxylase (GAD) are found in about 90 per cent of cases. There is a form of type 1 diabetes called idiopathic diabetes mellitus that is not autoimmune mediated but is strongly inherited and more common in black and Asian people. The insulin requirement of affected people can fluctuate widely and the cause is unknown. There is also LADA (latent autoimmune diabetes of adults), sometimes called slow-onset type 1 diabetes.


Type 2 diabetes mellitus

Previously called non-insulin-dependent diabetes mellitus, this is the most common variety worldwide (about 90 per cent of all diabetes mellitus cases). Patients are much less likely to develop ketoacidosis than those with type 1 diabetes, although insulin may sometimes be needed. Onset is most usual during adult life; there is a familial tendency and an association with obesity. There is a spectrum of disorders ranging from mainly insulin resistance with relative insulin deficiency to a predominantly secretory defect with insulin resistance.


Other specific types of diabetes mellitus

A variety of inherited disorders may be responsible for the syndrome, either by reducing insulin secretion or by causing relative insulin deficiency because of resistance to its action or of insulin receptor defects, despite high plasma insulin concentrations.


Genetic defects of β-cell function


  • Maturity-onset diabetes of the young (MODY):


    • MODY 1: mutation of the hepatocyte nuclear factor (HNF4A) gene,


    • MODY 2: mutation of the glucokinase gene,


    • MODY 3: mutation of the HNF1A gene.

Some cases are thought to be point mutations in mitochondrial deoxyribonucleic acid (DNA) associated with diabetes mellitus and deafness and are usually autosomal dominant.


Genetic defects of insulin action


  • Type A insulin resistance (insulin receptor defect), for example leprechaunism, lipoatrophy and Rabson-Mendenhall syndrome.


Insulin deficiency due to pancreatic disease


  • Chronic pancreatitis.


  • Pancreatectomy.


  • Haemochromatosis.


  • Cystic fibrosis.

Jun 30, 2016 | Posted by in BIOCHEMISTRY | Comments Off on Carbohydrate Metabolism

Full access? Get Clinical Tree

Get Clinical Tree app for offline access