Fig. 8.1
Schematic of overall protein stability
The choice of which biophysical methods to use is dictated by the types of studies and specific requirements that support protein drug development. The type of studies that are often done can be grouped into three general areas: (1) early screening assessments, (2) intense characterization, and (3) confirmatory studies. Early screening studies are used to select a molecule from several versions that are being considered for further development to initiate clinical trials. Once a molecule is chosen, several formulations need to be analyzed to screen impact on physical stability of the protein in these conditions. These screening assessments done early in development require high-throughput as well as small amounts of protein since there are a large number of samples with limited amount of material. Thus, biophysical methods that use small amounts of protein, which are rapid and amenable to automation technology would be considered. Studies that provide in-depth characterization can use more labor-intensive biophysical methods such as analytical ultracentrifugation (AUC). These studies may guide development work or provide a greater understanding of the physical properties of the protein to ensure long-term stability. The confirmatory studies provide alternative methods to support more rapid conventional analysis. There are several reviews that summarize the use of biophysical analysis in the development of protein biopharmaceuticals (Samra and He 2012; Kamerzell et al. 2011; Manta et al. 2011), and this chapter is not intended to be an all-encompassing review of the work that has been done. In this chapter we cite some key examples from the literature and present some examples on how biophysical analysis has been used at Genentech supporting protein pharmaceutical development.
8.2 Early Screening Assessments
8.2.1 Early Molecule Assessments
Early in development there may be several choices of molecule, and it would be prohibitively expensive to move forward with all the choices. In addition, although the molecules designed by research may be acceptable in early testing for activity, there are many attributes such as long-term stability, bioavailability, and manufacturability that may dictate the final choice of molecule. Generally as a first pass the primary structure of the molecule is used to identify particular “hot spots” for potential chemical degradation. Amino acid residues such as methionine and tryptophan are labeled as potential sites for oxidation (Ji et al. 2009; Wang 1999), and potential deamidation and aspartic acid isomerization sites are identified based on N and C terminal flanking residues (Robinson and Robinson 2004). Assessment of physical stability can be a more daunting task since it is not obvious how to link physical stability to primary sequence information. Attempts to assess propensity for aggregation and solubility (Agostini et al. 2012; Tartaglia et al. 2005, 2008) may be useful biophysical computational tools for choice of molecules, but the accuracy of such methods still needs to be verified for protein molecules in development. A nice example of the use of computational algorithms is the recent work of Chennamsetty et al. (2009a, b) where they used spatial aggregation propensity (SAP) using molecular dynamics simulation to predict aggregation prone areas in antibodies and to make mutants with enhanced stability. Stability of the antibodies was confirmed using turbidity, size exclusion chromatography (SEC), and differential scanning calorimetry (DSC) measurements. Recently Lauer et al. (2012) presented a developability index which is an in silico method for mAbs that uses SAP and the mAbs net charge to predict aggregation. Wu et al. (2010) have shown that structure-based engineering identified an aggregation promoting hydrophobic patch that could be modified with a carbohydrate moiety to provide a more soluble and stable analog of human recombinant IL13 antibody. All the above-published literature clearly indicates that computational methods can be used in understanding the physical behavior of mAbs, especially during candidate selection prior to entering clinical development. Although computational methods may be useful, the actual screening of protein molecule choices using biophysical analysis is highly desirable. As stated earlier since the amount of protein available is limited during such early assessments, assays are required that use small amounts of material. Thus, assays such as those SEC can be used to assess levels of aggregate in solution. However, assays that require small amounts of protein to assess particulate formation and physical properties such as viscosity may need to be developed. This can be very challenging especially for the development of high-protein concentration formulations such as those being developed for therapeutic monoclonal antibodies for subcutaneous (SC) delivery (Shire et al. 2004). As an example, viscosity measurements using standard rheometers generally require high volumes, but alternative techniques have been developed such as high-frequency quartz impedance methods (Saluja and Kalonia 2004, 2005; Patel et al. 2009), and several instrument companies are also offering commercial viscometers that can handle small volumes of proteins. Although these alternative techniques require smaller volumes, they may not be readily adaptable for high throughput. Dynamic light scattering (DLS) has been suggested as a way to predict the viscoelastic properties of proteins by monitoring protein–protein interactions (Saluja et al. 2007; Yadav et al. 2012). In this method the diffusion constant is determined as a function of protein concentration resulting in an interaction parameter, k d. A negative value for k d is indicative of attractive protein–protein interactions whereas a positive value represents repulsive interactions. It was shown that net attractive interactions determined using the k d interaction parameter correlated with high viscosities measurements using quartz impedance viscometry (Yadav et al. 2012). Recently this method was adapted for high-throughput screening (HTS) using a DLS plate reader (Connolly et al. 2012). The results for 29 monoclonal antibodies showed overall a very good correlation between negative k d values and viscosity measurements at high concentrations (Fig. 8.2) and demonstrate the utility of this approach.
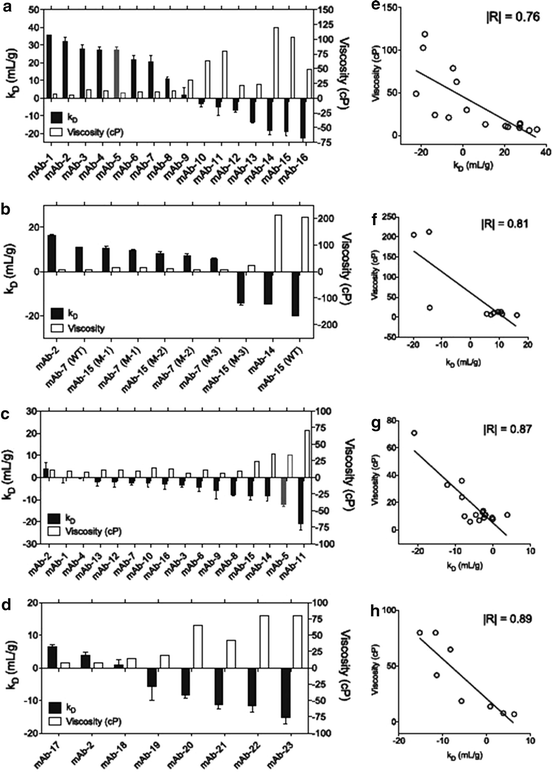

Fig. 8.2
Bar plots comparing kD (filled square) and mAb solution viscosity (open square) in (a) 20 mM His-OAc, pH 5.5, (b) 30 mM His-Cl, pH 6.0, (c) 200 mM Arg-Cl, pH 5.0, and (d) 200 mM Arg-Succ, pH 5.5. Scatter plots display correlation between k d and viscosity for the corresponding mAbs in (e) 20 mM His-OAc, pH 5.5, (f) 30 mM His-Cl, pH 6.0, (g) 200 mM Arg-Cl, pH 5.0, and (h) 200 mM Arg-Succ, pH 5.5. Viscosity was measured at 175 mg/mL by cone and plate rheometry (published previously in Connolly et al. 2012)
8.2.2 Formulation Screening
Gibson et al. (2011) recently have reported the use of HTS methods for protein solubility using an IgG1 mAb. The authors were able to modify a PEG-induced precipitation method in a 96 well format and used ultra violet-visible (UV–Vis) spectroscopy to screen various buffer compositions and pH that help to maintain mAb solubility. Relative solubility profiles of both chimeric and human IgG1 mAbs were determined using this HTS method. He et al. (2010a) reported the use of extrinsic fluorescence in a 96-well format to detect and quantify IgG aggregation. It can be envisioned that several other analytical techniques, such as turbidity, DLS, and various chromatographic methods, can be utilized in the future in an HTS format to help determine protein solubility under different formulation conditions, especially using design of experiments (DOE) principles.
As high concentration mAb formulations become more prevalent, one of the factors that will need to be addressed is screening for formulations that will mitigate high solution viscosity in a HTS format. Since several factors such as ionic strength, protein concentration, buffer composition, and pH influence viscosity, a multivariate analysis for formulation screen in early development would be very helpful. Recently He et al. (2011) demonstrated the application of a DOE approach with HT formulation screening to identify the main factors affecting an IgG2 mAb thermostability and solution viscosity. The authors describe the use of DLS measurements of diffusion coefficients of small volumes of protein samples using an automated 384-well plate reader and correlated the DLS data to viscosity of concentrated protein solutions as previously reported (He et al. 2010b). In the same study, He et al. report the thermostability of the mAbs using a relatively new technique, differential scanning fluorimetry (DSF), instead of the traditionally used DSC, using 96-well plates and significantly low quantities of the mAb. Several factors as well as the interactions between factors on both the thermostability and viscosity using a 34 full factorial design (81 conditions) and robust statistical methods were explored. Full and reduced models considering main effects of factors and two-way interactions were appraised, and selection of optimal formulation conditions was evaluated based on data generated using the JMP® software. Conditions wherein the protein maintains thermostability and has reasonable viscosity at particular pH and protein concentrations can be easily viewed using the contour plot and profiler. In addition to estimating the main factors affecting viscosity and thermostability, the authors were able to apply prediction formulas to determine formulations that can help meet predetermined values. They have successfully explored a formulation design space consisting of different factors using a combination of HTS and statistical methods that contribute significantly to the concepts of quality by design (QbD) and DOE approach to formulation development. Such an analysis can be very valuable to determine optimized formulations for Phase III and commercial development.
Zhao et al. (2010) have recently published formulation development of mAbs using a robotic system and a high-throughput laboratory. While the individual study setup has been published before, this is the first of a kind of work that demonstrates the end to end of formulation screening—from sample preparation to comprehensive sample analysis. Many analytical techniques including UV–vis, DLS, various chromatographic methods, and turbidity—were performed for optimized formulation screens, and the best formulations were selected in a relatively short amount of time. The study demonstrates the value of such a high-throughput laboratory in preformulation development of proteins, especially mAbs.
Lehermayr et al. (2011) compared various biophysical properties of several monoclonal antibodies using a variety of techniques. Protein–protein interactions, which define mAb properties of low and high concentration solutions, were assessed via determination of the second virial coefficient (A 2) using SLS and DLS. As measuring A 2 values using SLS is tedious, the authors measured the interaction parameter k d using DLS. A plot of k d (from DLS) and A 2 (from SLS) for eight different mAbs provided a linear fit and showed the relation as k d = 1.06 A 2 M − 8.9, where M is the molecular weight of the mAb. Overall, this methodology using DLS could be used to analyze A 2 using low protein quantities and is amenable to HTS as demonstrated in this work.
8.3 Intense Characterization Studies
8.3.1 Biophysical Techniques in Intense Characterization
Biophysical measurements that are labor-intensive such as AUC are not amenable to a high-throughput methodology but can provide important information to guide further development of a protein therapeutic. As an example, Lu et al. (2008) used sedimentation velocity AUC to demonstrate its usefulness in monitoring long-term stability and molecular integrity of antibodies. Specifically, their data was used to support the notion that a single point mutant in the hinge region of an IgG4 (S241 to P241) led to an increase in stability of the molecule against freeze–thaw-induced aggregation.
AUC has also been used to characterize the complexes formed in vitro between an anti IgE–IgG1 antibody and IgE (Liu et al. 1995). Monoclonal antibodies that bind to free-circulating IgE can be used for the treatment of IgE-induced allergic asthma, as they prevent the loading of IgE on mast cells or basophils, which can result in release of inflammatory molecules such as leukotrienes and histamine after exposure to an allergen (Fig. 8.3). Theoretically since there are two sites on each IgE where anti IgE can bind and since each anti IgE molecule is bivalent, the complexes could become very large (Fig. 8.4). Sedimentation velocity (Fig. 8.5) and equilibrium measurements were used to determine weight-average molecular weight and size distribution (Fig. 8.6) to clearly show that this did not happen and that the complexes that formed were of limiting size. The complexes formed are dependent on the molar ratio of IgE:anti IgE as shown in a schematic diagram (Fig. 8.7). The formation of these complexes dictates the pharmacokinetics of the drug therapy since IgE has a clearance time of ~6 h whereas an IgG1, due to the binding to FcRN neonatal receptor, has a typical half-life of ~2 weeks in serum. The complexes that form between IgE and anti IgE take on the long half-life typically seen for an IgG1 (Fox et al. 1996). The amount of free IgE in plasma should be related to the clearance rate of anti IgE:IgE complexes, free IgE, unbound anti IgE, and relative binding affinities of high-affinity receptor for IgE and that of IgE with anti IgE (Fig. 8.8). Thus, the dose required for effective lowering of free IgE in plasma will be related to stability of the complexes when interacting with high-affinity receptor. Since it is possible to detect the formed IgE:anti IgE complexes using sedimentation velocity AUC, it is possible to perform competitive binding experiments using AUC. AUC experiments were performed with preformed anti IgE:IgE complexes at a molar ratio of 6:1 where there is an excess of anti IgE and a predominance of a trimeric species consisting of two anti IgE molecules bound to one IgE (Fig. 8.7). A soluble form of the high-affinity receptor, sFcεRIα, was then added at several molar ratios, and the results (Fig. 8.9a) clearly showed that the receptor has a greater affinity for IgE than anti IgE necessitating excess dosing of anti IgE to effectively lower free-circulating IgE. In particular, at a molar ratio of IgE:anti IgE of 1:6, all the IgE is incorporated into a trimeric complex at ~13.3 S, and upon addition of soluble receptor at 0.1:1 of complex, there is a reduction of this 13.3 S peak as well as a slight increase in the baseline between 8 and 9 S and an increase of the unbound anti IgE peak at ~7 S. As more soluble receptor is added, there are additional increases in the anti IgE peak and the appearance of a peak that is likely the receptor:IgE complex, which was characterized as a dimer (Fig. 8.7) in earlier work using sedimentation velocity and equilibrium AUC as well as static light scattering (SLS) (Liu et al. 1997). These data were generated using the differential sedimentation method of Stafford (Stafford 1992), which does not take into account diffusion resulting in a broadening of the peak and is the likely reason that at lower concentrations it is difficult to detect a single peak representative of the receptor:IgE dimer. As an extension of this technique, a competition binding AUC experiment was also done using a genetically engineered version of an anti IgE, referred to as anti IgEZ, which was designed to have a greater affinity for IgE. The competition binding analysis shows that anti IgEZ does indeed have higher affinity since even at a ratio of soluble receptor to IgE at 1:1 there is very little disruption of the complex (Fig. 8.9b).
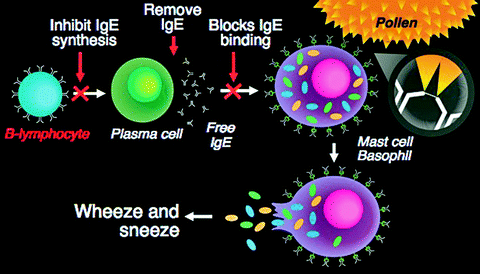

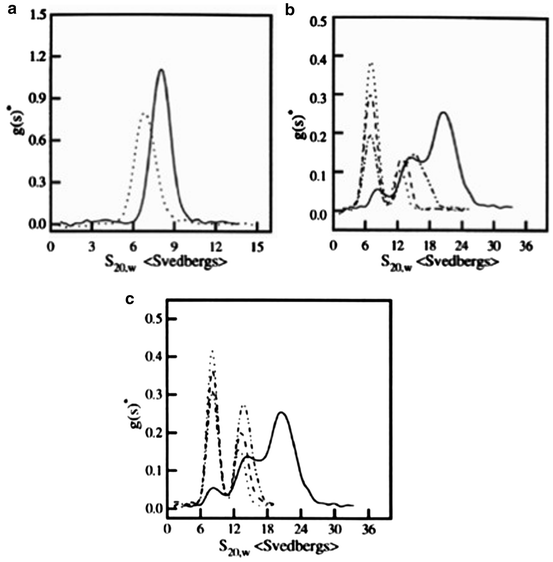
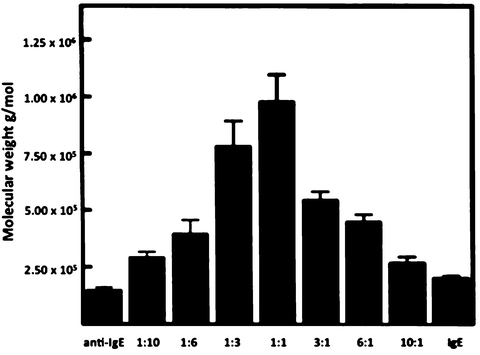
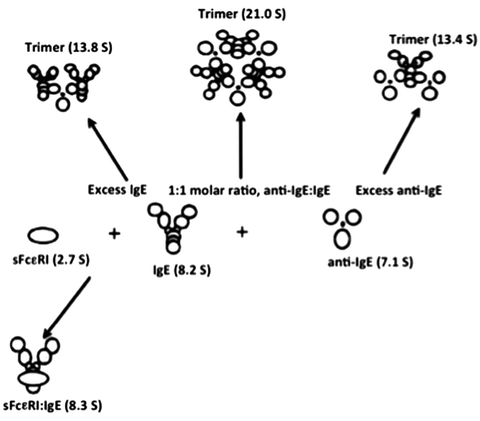
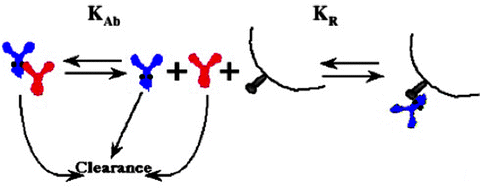
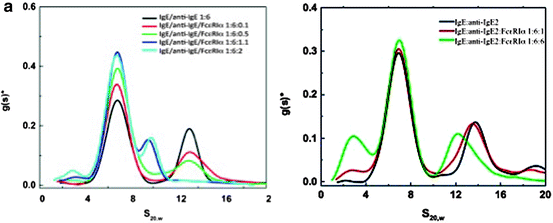

Fig. 8.3
Mechanism of action of an anti IgE mAb in the treatment of IgE allergic-mediated disease. The anti IgE mAb can inhibit IgE synthesis and binds free-circulating IgE preventing the IgE from interacting with the FcεRIα high-affinity receptors on the surface of mast cells or basophils

Fig. 8.4
The theoretical interaction of IgE (dark grey) with an anti IgE mAb (light grey) via binding of the two high-affinity Fc receptor sites on IgE

Fig. 8.5
Differential sedimentation coefficient distribution of IgE (solid line) and anti IgE (dotted line) monomers at 0.64 mg/mL (a); IgE and anti IgE complexes at various molar ratios (b and c) in PBS at 10°C. The molar ratios of IgE:anti IgE were as follows: (b) 1:1 (solid line), 1:3 (dash-dotted line), 1:6 (dashed line), and 1:10 (dotted line): (c) 1:1 (solid line), 3:l (dash-dotted line), 6:1 (dashed line), and 10:1 (dotted line). The sedimentation coefficients have been corrected to the standard condition of water at 20°C. No faster moving species was observed in early scanning (previously published in Liu et al. 1995)

Fig. 8.6
Sedimentation equilibrium analysis of IgE and anti IgE mAb complex formation in PBS at 10°C. The weight-average molecular weights of complexes at different molar ratios were obtained by analyzing the data from three different rotor speeds (5,000, 7,000, and 10,000 rpm) as a single ideal species simultaneously. The error bars correspond to a 95% confidence interval (adapted from Liu et al. 1995)

Fig. 8.7
Schematic diagram of complex formation by IgE and anti IgE and IgE and soluble high-affinity Fc receptor, sFcεRIα (adapted from Liu et al. 1997)

Fig. 8.8
Overall scheme for clearance of IgE (purple), anti IgE (red), and formation and clearance of complexes at excess anti IgE vs. binding of IgE with high-affinity receptor, FcεRIα (grey), on mast cells and basophils

Fig. 8.9
Differential sedimentation coefficient distribution of anti IgE, FcεRIα, and IgE:anti IgE and IgE:FcεRIα complexes (a) and anti IgEZ, FcεRIα, and IgE:anti IgEZ and IgE:FcεRIα complexes (b): assessment of competition of binding of soluble high-affinity receptor, FcεRIα, with either preformed IgE:anti IgE or IgE:anti IgEZ complexes using AUC sedimentation velocity
These examples are typical of how biophysics can be used to study the behavior of biotherapeutics in vitro and help in determining adequate dosing. However, rather little information on chemical and physical stability is available once the drug is administered to humans, since characterization under physiological conditions requires specialized tools. Recent advances in hardware have resulted in the capability to use fluorescence optics in AUC and have been specifically used to detect an anti IgE molecule binding to IgE in a complex matrix such as human serum (Demeule et al. 2009a). Two main differences were noticed for the anti IgE binding to IgE in serum vs. PBS. The absence of the 21 S peak and the presence of an 8.7 S peak in serum for the anti IgE complex with IgE, instead of a 7.3 S peak in PBS, were noticeable. The absence of the 21 S peak and the different profile observed in serum compared to PBS underlines the importance to characterize the molecules under physiologically relevant conditions. Additionally, the absence of the 7.3 S peak that is replaced by a 8.7 S peak further confirms the distinct behavior in serum compared to PBS. The authors hypothesize that affinity of an anti IgE molecule towards IgE was higher in serum compared to that in PBS and that the largest anti IgE:IgE complex observed in serum was smaller than expected. AUC equipped with fluorescence optics was clearly demonstrated to be useful to characterize biopharmaceuticals under physiological conditions. Direct characterization in serum may now allow for better drug candidate selection and should be carefully considered during molecular assessment in early research stages.
8.3.2 Higher Order Structure Determinations
Alterations in conformation of proteins obviously require the use of biophysical analytical tools. Hydrodynamic measurements such as a diffusion coefficient from DLS or sedimentation coefficient from AUC provide such information as long as the overall conformational changes are large enough to elicit a significant change in the determined values. SEC when used with an on-line light scattering detector to determine weight-average molecular weight can also detect mis-folded conformers as long as the shape change is large enough to allow for separation from the properly folded protein monomer (Philo 2006).
Spectrophotometric techniques such as circular dichroism (CD) have often been used to assess the folded state of a protein. Secondary structures (including α helices and β sheets) can be identified in the far-UV region, 190–240 nm, of the CD spectrum. These ellipticity changes stem from the distinct chiral positioning of the amide chromophores within different secondary structures (Johnson 1990). In addition, the local environment of aromatic chromophores such as tryptophan, tyrosine, and phenylalanine gives rise to a CD signal in the near-UV region, 240–340 nm, that can be used to infer tertiary structure changes (Johnson 1990). Thus, CD can be used to determine if the structure of a recombinant DNA-derived protein is that expected of “natural sourced” proteins or whether the structure is altered when exposed to stress conditions. As an example, the far-UV spectrum of a mAb reference material from Genentech showed a minimum at 218 nm indicative of the β-sheet character consistent with IgG1 antibodies (Brahms and Brahms 1980). Comparison of both near- and far-UV spectra between reference material and the stress panel shows no differences in structure by CD, as shown in Fig. 8.10, indicating that any subtle structural changes due to the applied stress (pH, oxidation, etc.) may not be picked up in this technique. However, it has been shown recently by Li et al. (2011) that CD can be used to monitor conformational changes in proteins during manufacturing process conditions. Li et al. (2011) describe the effect of pH or denaturants during purification and show a quantitative method to compare CD spectra using the OMNIC QC compare algorithm. Near-UV CD spectrum of several protein candidates was assessed either in sodium citrate buffer (pH 3.0) or in PBS (pH 7.4). Careful evaluation of the near-UV CD spectrum of these candidates indicated that fewer changes were induced by low pH on candidate 1 over candidate 2, and hence the former may be more amenable to manufacturing processes at low pH. Far-UV CD spectrum of the same two candidates indicated that both proteins underwent the loss of the native β structure when incubated at pH 3.0; however, the secondary structure of candidate 1 was found to be relatively more stable than candidate 2.
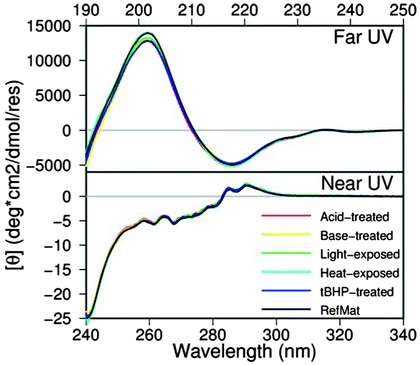

Fig. 8.10
Far- and near-UV CD spectra of a monoclonal antibody after exposure to different stress conditions
Although CD is often used on its own to probe conformation of proteins, it can be a very valuable tool when used in conjunction with other biophysical techniques. The self-association properties and conformation of recombinant DNA-derived human relaxin, a pregnancy hormone, were studied by sedimentation equilibrium analytical ultracentrifugation and CD (Shire et al. 1991). The sedimentation equilibrium AUC data were consistent with a monomer–dimer self-association model with an association constant of ~6 × 10⁵ M−1. An approximate five fold increase in weight fraction of human relaxin monomer elicited by dilution of the protein resulted in no change in the far-UV CD spectrum at 220 nm.
In contrast, after the same increase in weight fraction of monomer, the near-UV circular dichroism spectra for human relaxin showed a significant decrease in the intensity of the CD bands near 277 and 284 nm. Although human relaxin has two tryptophan residues, the near-UV CD spectra exhibit only a broad shoulder near 295 nm rather than the strong CD bands often found for tryptophan. Moreover, there is little change in this broad band after dilution of human relaxin to concentrations that resulted in a five fold increase in the monomer weight fraction (Fig. 8.11). These data suggest that dissociation of the human relaxin dimer to monomer is not accompanied by large overall changes in secondary structure or alteration in the average tryptophan environment, whereas there is a significant change in the tyrosine environment. This conclusion was affirmed by the X-ray crystal structure of human relaxin, which crystallized as a dimer with the lone tyrosine from each monomer at the dimer interface (Eigenbrot et al. 1991). Thus, the solution studies were in good agreement with the crystal studies, suggesting that the determined crystal structure is very similar to the structure of the protein in solution.
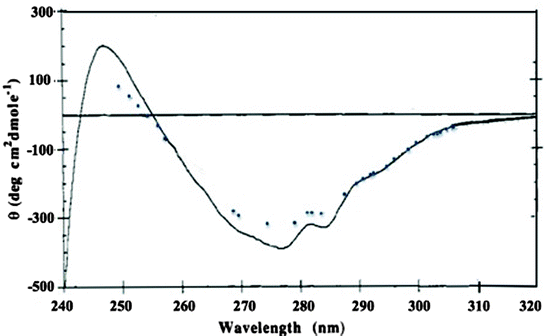

Fig. 8.11
Near-UV circular dichroism of human relaxin at 0.5 mg/mL (solid line) and 20 μg/mL (dotted line). Relaxin at 0.5 mg/mL was thermostated at 20 °C in a 1-cm cell, whereas relaxin at 20 μg/mL was in an unthermostated 10-cm cylindrical cuvette. The temperature in the sample compartment was ~27°C during the data collection process. The CD data were collected at 0.25-nm intervals at a spectral bandwidth of 0.5 nm and are the result of an average of three scans using an average time for each single data point collection of 5 s for the 0.5 mg/mL samples and the result of an average of ten scans using an average time for each single data point collection of 10 s for the 20 μg/mL sample. The weight fraction of human relaxin monomer estimated from the determined association constant by sedimentation equilibrium AUC of 100 (g/L)−1 is 0.13 at 0.5 mg/mL and 0.50 at 20 μg/mL (adapted from Shire et al. 1991)
Another spectroscopic technique widely used to assess conformational changes in proteins is Fourier transform infrared (FTIR) spectroscopy, which can be used to probe secondary structural elements including α helices and β sheets in solution as well as in solid-state dosage forms. These structural features appear in FTIR spectra as broad, characteristic absorption bands in the regions 1,700–1,620 cm–1 (Amide I) and 1,600–1,500 cm–1 (Amide II), among others (Byler and Susi 1986; Dong et al. 1990; Jackson and Mantsch 1995). These absorption bands are caused by a combination of bending and stretching vibrations of bonds along the peptide backbone. Since the technique can be used to assess conformation of proteins in solution as well as in the solid state, it allows for assessments of excipients used to stabilize the protein during drying. Studies using omalizumab clearly showed that the native conformation of a monoclonal antibody could be preserved when a lyoprotectant such as sucrose was added to the formulation. Freeze drying in the absence of lyoprotectant resulted in formation of covalent aggregates, which were linked by disulfide bonds as shown by nonreducing and reducing SDS polyacrylamide gel electrophoresis (SDS PAGE) (Andya et al. 2003). FTIR has also been used to investigate the conformational stability of Pulmozyme in the aqueous and solid states (lyophilized). Pulmozyme is a recombinant DNA-derived DNase used for the treatment of cystic fibrosis and requires calcium ions for stability and activity (Chen et al. 1999). Exogenous calcium can be removed by treatment with EGTA leaving one tightly bound calcium ion per rhDNase molecule. Analysis of the FTIR spectra in the amide III region in either the aqueous or lyophilized state demonstrated that removal of exogenous Ca2+ by EGTA treatment had little effect on the secondary structure (Fig. 8.12, Table 8.1). This result for the aqueous state was confirmed using CD that also showed that there was no large overall change in the secondary or tertiary structure upon the removal of calcium. The primary degradation route for rhDNase in solution is deamidation. For the EGTA-treated protein, there was also severe covalent aggregation, e.g., formation of intermolecular disulfides facilitated by the cleavage of Cys173-Cys209, which resulted in complete loss of activity. The aggregates had a very different secondary structure compared to the native protein. In particular, the β-sheet band observed at ~1,620 cm−1 wave number in the amide I second derivative spectra was increased.
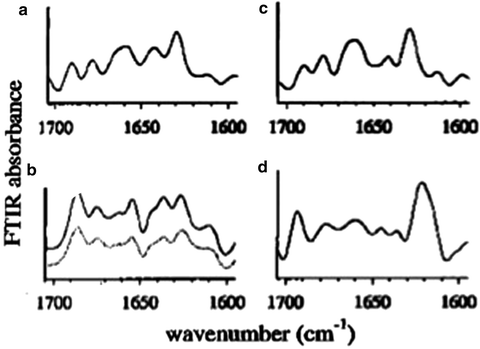

Fig. 8.12
Inverted second derivative of the amide I IR spectra of rhDNase I: (a) in aqueous solution (EGTA treated, no incubation), (b) lyophilized-untreated power (solid line) and lyophilized EGTA-treated power (dotted line) (no incubation for either sample), (c) deamidated form (aqueous protein incubated in 1 mM CaCl2 for 120 days at 40°C), and (d) aggregated form (aqueous EGTA-treated protein incubated in the absence of exogenous calcium ions for 120 days at 40°C) (published previously in Chen et al. 1999)
Sample | Secondary structure (%) | ||
|---|---|---|---|
α helix | β sheet | Otherb | |
Aqueous solution, with Ca2+,c,d | 21 ± 2 | 23 ± 3 | 56 ± 6 |
Aqueous solution, EGTA treated | 20 ± 2 | 26 ± 2 | 54 ± 3 |
Lyophilized, with Ca2+,d | 13 ± 2 | 41 ± 3 | 46 ± 2 |
Lyophilized, EGTA treated | 14 ± 2 | 45 ± 3 | 41 ± 3 |
Deamidated forme | 21 ± 1 | 25 ± 2 | 54 ± 2 |
Aggregated formf | 10 ± 1 | 44 ± 4 | 46 ± 3 |
For the protein lyophilized in the presence of Ca2+, there was no increase in deamidated species during solid-state storage; however, some aggregation was observed. For the lyophilized EGTA-treated protein, aggregation was even more pronounced, and there was some loss in enzymatic activity upon reconstitution. Thus, the removal of calcium ions by EGTA treatment decreased the stability of rhDNase in both the aqueous and solid states even though no large overall calcium-induced structural changes could be observed by FTIR or CD. This example shows one of the problems in using spectroscopic methods such as FTIR or CD to assess structural alterations. Unless there are gross overall changes, it is unlikely that these techniques can detect the more subtle changes that may occur which still can lead to large amounts of aggregate and loss of potency. Thus, biophysical techniques that can detect subtle conformational changes are required, and recent improvement of an old technique, hydrogen–deuterium (H/D) exchange introduced by Linderstrøm–Lang in 1954 (Hvidt and Linderstrom-Lang 1954), may address those needs.
8.3.3 H/D Exchange by MS
Hydrogen/deuterium exchange mass spectrometry (HDX-MS) utilizes mass spectrometry to identify hydrogen atoms that are exchanged for deuterium and is based on the principle that the kinetics of H/D exchange is greatly affected by local structure of the peptide bond. Houde et al. (2009) used HDX-MS to study changes to IgG1mAb conformation as a result of deglycosylation by comparing the glycosylated and deglycosylated forms of the antibody. Two regions of the IgG1 (residues 236–253 and 292–308) were found to have altered exchange properties upon deglycosylation. Previous studies using X-ray crystallography and NMR have indicated that the residues in the same region are involved with Fc receptor binding confirming the HDX-MS is a useful tool to show subtle conformation changes.
Burkitt et al. (2010) recently reported the use of HDX-MS in the analysis of oxidized mAbs. Structural alterations in a number of segments of the Fc region corresponding to large changes in the hydrogen exchange profile of residues 247–253 of the heavy chain that contains the peptide LFPPKPKDTL were observed for an IgG1 mAb after oxidative stress. The peptide is located in the Fc region of the antibody adjacent to Met253 and spatially close to Met430, both of which are found to easily oxidized under various conditions.
Stay updated, free articles. Join our Telegram channel

Full access? Get Clinical Tree


