where the molar extinction coefficient  of TNB is 1.36 × 10⁴ L/mol/cm. This is the absorbance of a 1 M solution in a 1 cm light path. The total volume in the cuvette is 3.17 mL, and there are (100 × 0.05) = 5 mg tissue in the cuvette. The factor of 106 is to convert mL to L.
The % inhibition is calculated as:
(8.2) 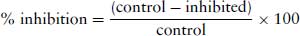
Questions
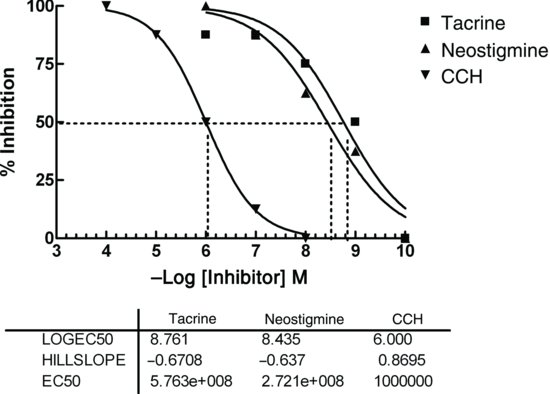
Figure 8.1 Inhibition of AChE by tacrine, neostigmine and CCh. The rates of the enzyme reaction were measured from the slope.
8.4 MONOAMINE OXIDASE INHIBITORS
MAO catalyses the deamination of a wide range of substrates including the neurotransmitters noradrenaline, 5-HT and dopamine. This mitochondrial enzyme has a wide tissue distribution, and occurs as two isoenzymes, MAOA and MAOB, that are different gene products. MAOA has a high affinity for the neurotransmitters noradrenaline and 5-HT, and is inhibited by clorgyline. MAOB is less specific and oxidizes dietary organic amines such as phenylethylamine and benzylamine. It is inhibited by deprenyl. Both enzymes deaminate tyramine and dopamine, and are inhibited by tranylcypromine. MAO can be assayed by several methods including oxygen uptake and radioisotopic measurements. In this practical, a fluorimetric method is used. The deamination of the substrate, kynuramine to the cyclic product 4-hydoxyquinoline (4-OHq), which fluoresces in alkaline solutions, is monitored (Morinan and Garratt, 1985).
Aim
This experiment is carried out in two parts:
8.4.1 Sub-cellular Distribution of MAO Activity
The aim of this experiment is to demonstrate that MAO (EC 1.4.3.4) is located in the mitochondrial fraction of a homogenate fractionated by differential and density gradient centrifugal fractionation. A 10% homogenate of rat brain in 0.32 M sucrose/1 mM EDTA, pH 7.2, is prepared using an Ultra-Turrax homogenizer (setting 6 for 20 s). This is centrifuged at 1000 g for 10 min at 4°C to give the nuclear pellet (P1). The supernatant (S1) is carefully removed and centrifuged at 10 000 g for 20 min to give the mitochondrial pellet (P2) and the supernatant (S2). Finally, the microsomal pellet (P3) and the soluble cytoplasmic components (S3) were prepared by centrifugation of S2 at 100 000 g for 60 min. P1 and P2, each resuspended in 15 mL of homogenizing medium together with P3 in 5 mL homogenizing medium and S3, are stored on ice until use in the MAO assays.
MAO Assay of Sub-cellular Fractions
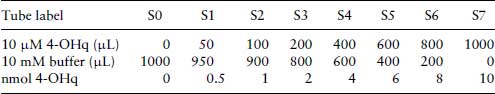
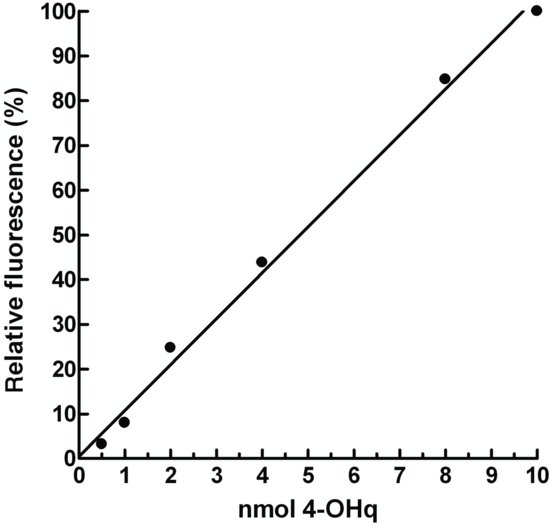
4-hydroxyquinoline Standard (calibration) Curve
To calculate the amount of product formed by MAO in the sample tubes, a standard curve is prepared.
Table 8.1 Preparation of standard concentrations of 4-OHq for the MAO assay.
Protein Assay
This is an adaption of the Lowry method which was first described by Markwell et al. (1978). Prepare a stock solution containing 100 μL/mL of bovine serum albumin, and prepare standard tubes containing 0, 10, 20, 30, 40, 50, 60, 70, 80, 90 and 100 μg in 1 mL of distilled water. Make up the following dilutions of the sub-cellular fractions in distilled water: P1 and P2: 1/100 and 1/200; P3 and S3: 1/20 and 1/50. Add and mix 3 mL of Markwell C reagent (1% Reagent B in Reagent A) to duplicate 1 mL aliquots of each of these eight dilutions (a total of 16 tubes) and the standards. After 10 min at room temperature, add with immediate mixing 0.3 mL Reagent D (50% Folin-Ciocalteau Phenol reagent in distilled water). Leave the solutions at room temperature for a further 45 min before reading the absorbance at λ = 660 nm.
Calculations
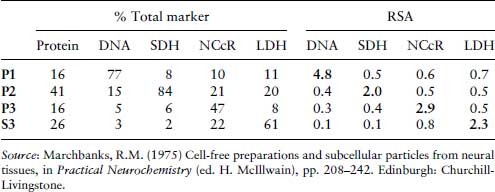
Calculate the RSA of MAO in each sub-cellular fraction. A RSA value greater than 1 indicates an association of the marker with a particular fraction (see Table 8.2) and that the fraction is relatively pure from other organelles. The RSA is defined as:
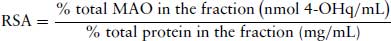
Table 8.2 RSA data for enzymes and nucleic acid markers (Marchbanks, 1975). Fraction P1 is the nuclear fraction, P2, the mitochondrial fraction, P3, the microsomal fraction and S3 is the cytoplasmic fraction. The abbreviations used to denote enzymes are SDH, succinate dehydrogenase, NCcR, NADPH cytochrome c reductase (NADPH cytochrome P450 reductase) and LDH, lactate dehydrogenase.
8.4.2 Specificity of MAO Inhibitors for Isoenzymes
For this experiment, a crude homogenate of rat brain can be used. A 10% homogenate of rat brain in 10 mM phosphate buffer, pH 7.2, is prepared using an Ultra-Turrax homogenizer (setting 6 for 20 s). This is then centrifuged at 1000 g for 10 min to remove cell debris and nuclei, and the supernatant carefully removed and stored on ice until required. Acceptable results can be obtained if this homogenate stored at −80°C for several months.
Make seven 10-fold dilutions of the 1 mM stock concentration of each of the inhibitors. Label these as T4 (1 mM stock undiluted tranylcypromine, final incubation concentration 10−4 M), and T5–T11 for subsequent 10-fold dilutions (representing final incubation concentrations of 10−5–10−11 M) of tranylcypromine. Follow a similar procedure for clorgyline (C4–C11) and deprenyl (D4–D11). Note that a standard curve for the product of the reaction, 4-OHq, must also be prepared. This is done as detailed for the cell fractionation experiment (above). This should be done at this stage to prevent any delay at the end of the experiment. Standards should be read with the experimental samples.
Stay updated, free articles. Join our Telegram channel

Full access? Get Clinical Tree


