, Sam Salek2 and Stuart Walker3
(1)
Centre of Regulatory Excellence, Duke-NUS Graduate Medical School, Singapore, Singapore
(2)
Department of Pharmacy, University of Hertfordshire, Hatfield, UK
(3)
Centre for Innovation in Regulatory Sciences, London, UK
Introduction
The benefit–risk assessment of medicines is a critical process in regulatory decisions, resulting in their approval or rejection. Regulatory authorities bear the responsibility to ensure that the approved products demonstrate the efficacy and safety as shown in the clinical trial data submitted. However, such regulatory decisions are largely based on clinical judgment and the local medical context in each country. In a bid to minimize subjectivity for such important decisions, there have been attempts to utilize quantitative approaches in assessing benefits and risks of a medicine (EMA 2009). As a result, pharmaceutical companies have also initiated the use of quantitative approaches in developing their products for submission to the regulatory authorities (Levitan et al. 2011).
Guo et al. (2010) reviewed the methodologies and identified 12 quantitative approaches such as multi-criteria decision analysis (MCDA), probabilistic simulation methods (PSM), Monte Carlo simulation (MCS), incremental net health benefit (INHB), minimum clinical efficacy (MCE), number needed to treat (NNT), number needed to harm (NNH), and quality-adjusted time without symptoms and toxicity (Q-TWiST). They concluded that these quantitative methodologies should serve as supplementary tools, but not replace the decision-making process of clinicians or regulators. In the absence of a consensus among the agencies for a standard methodology, they recommended the use of multiple approaches across different clinical settings.
During 2010, the European Medicines Agency (EMA 2010) completed the second phase of their research into benefit–risk assessment, with the main objective of identifying suitable approaches that can be utilized within member states. Based on their first phase and experience, a list of criteria (logical soundness, comprehensiveness, acceptability of results, practicality, and generativeness) for reviewing the methodologies was constructed. A list of qualitative and quantitative techniques, identified through literature search and experience, was reviewed against the criteria. When reviewing, these methodologies were also subjected to evaluators’ opinion of relevance. The conclusions of the second phase were that a combination of approaches may be useful in different clinical settings and an overarching qualitative framework will be required to effectively develop any quantitative methodologies. Structured processes should be in place to improve transparency, audit trail, communication, as well as the quality and speed of decision-making.
The aims of this study were to solicit opinions from the major stakeholders (agencies and companies) regarding their knowledge and use of different qualitative and quantitative techniques in order to put the findings by Guo et al. (2010) and EMA (2010) into an international context as well as to elucidate any potential differences between agencies’ and companies’ expectations.
Objectives
The objectives of the study were to:
Identify agencies’ and companies’ current approaches to benefit–risk assessment
Establish the criteria for including a framework/model for benefit–risk assessment
Investigate agencies’/companies’ current views of the advantages and disadvantages of the various models/frameworks available or being developed
Identify both the internal and external barriers and possible solutions to incorporate a framework/model into medicine development and their regulatory review
Methods
Development of the Assessment Tool
Current knowledge suggested that regulatory agencies and pharmaceutical companies had in place a framework for the assessment of the benefits and risks of medicines. These frameworks can be broadly classified into 3 types, as seen in the Table 3.1. Of note, all final decisions incorporated expert judgment, thus emphasizing the role of the framework as a supporting tool and not as a replacement for decision-making.
Table 3.1
Definitions of systems
System | Definition |
|---|---|
Qualitative | The system is a purely qualitative framework based on internal experts or management making a “gut decision” on the benefit–risk profile of each product and providing a conclusion. The final decision will be exercised based on expert judgment |
Semiquantitative | The system is semiquantitative in that it has a structured (written) framework or standard operating procedure for data collection and analysis. The conclusion is based on the result of the outcomes of the internal system, as well as contributing opinions. The final decision will be exercised based on expert judgment |
Quantitative | The system is a fully quantitative model which includes a benefit–risk balance for a new medicine and is applied across study data and contributing opinions. The conclusion is based on the cumulative outcome from this single system. The final decision will be exercised based on expert judgment |
In addition, current opinions on the advantages and barriers to implementing a universal framework were sought, and relevant factors for the review of a framework were investigated. Seven factors (Table 3.2) were proposed for this study, and these had been identified from those utilized by the EMA (2010) study.
Table 3.2
Definition of factors for reviewing of frameworks
1. Logical soundness | Provides an approach that is sound and allows decisions that are coherent and aids rational thinking |
2. Comprehensiveness | Provides an approach that handles all forms of data (including qualitative and quantitative, subjective and objective information) and allows for multiple criteria |
3. Acceptability of results | Provides an approach that checks for inconsistencies in data and judgment and a realistic approach to the evaluation of benefits and risks |
4. Practicality | Provides an approach with minimum burden on resources and ease of use |
5. Specificity and sensitivity | Provides a statistical perspective underpinning the reliability of the decision |
6. Presentation (visualization) | Provides outcomes in an easily understandable format such as charts and plots |
7. Scope | Provides a consistent approach throughout drug development and post-approval monitoring |
It was presumed that agencies and companies would have different opinions and experiences and it would be meaningful to study these differences and their potential impact on the development and implementation of a universal framework. Therefore, the study decided to stratify the data pertaining to agencies and companies.
Study Participants
The participants were those holding senior positions and involved in benefit–risk assessment and decision-making. To improve the representation, participants from various-sized organizations and geographical locales were invited.
Data Collection
The assessment tool was finalized into a questionnaire consisting of 13 questions. Out of these, the following 4 questions required the participant to rate or rank a list of statements found within each question:
Perceived advantages of the benefit–risk framework
Barriers to implementing a formal benefit–risk framework
Perception of the need for an appropriate benefit–risk framework
Factors for reviewing benefit–risk frameworks
Eight questions were included using checkboxes for information collection:
The current system employed by the organization for the benefit–risk assessment of a new medicine during review (qualitative, semiquantitative, or quantitative)
The use of values, weights, and selected parameters during assessment of benefits and risks
Satisfaction with current system
Reasons for not using a semiquantitative or quantitative system
Plans to implement a semiquantitative or quantitative system
Construction of the benefit–risk framework
Opinions of various models and approaches
Development of visualization tools for communicating benefit–risk balance
An open-ended question was also used to solicit the potential hurdles and solutions, to be provided in a free-text manner. Most of the questions had an open field for comments, allowing the participants to provide any issues of concern or relevant points that were not addressed by the questionnaire. The study tool can be seen in Fig. 3.1.
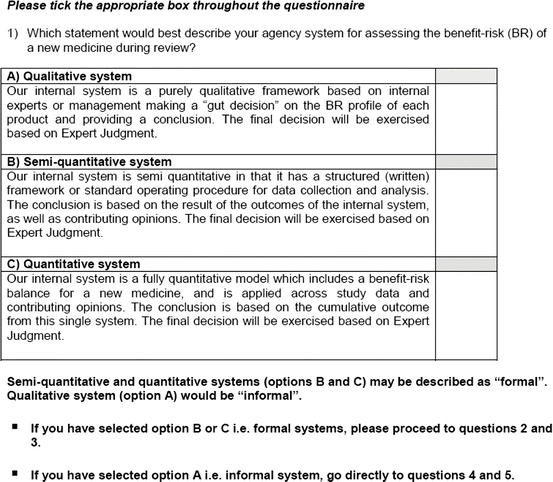
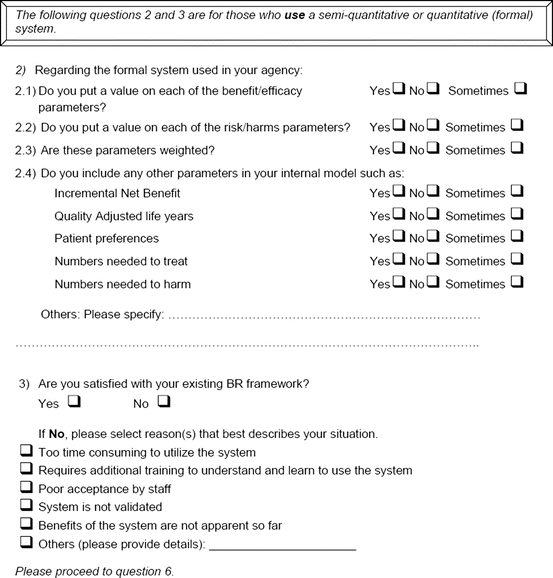
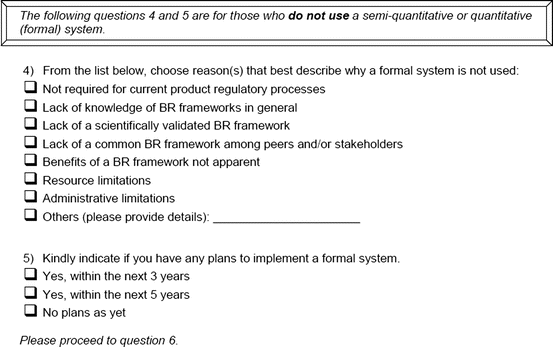
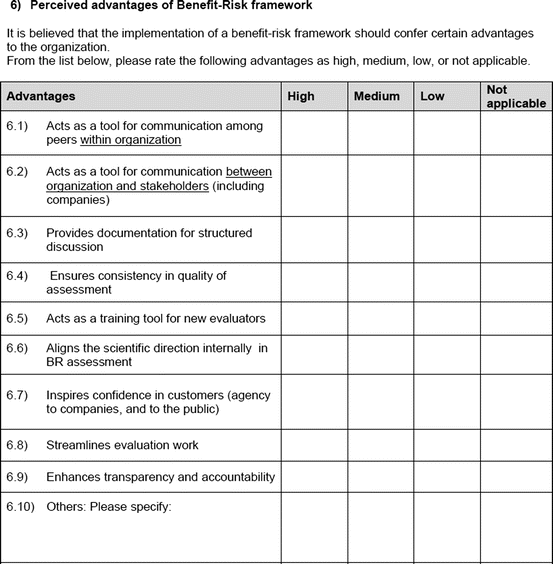
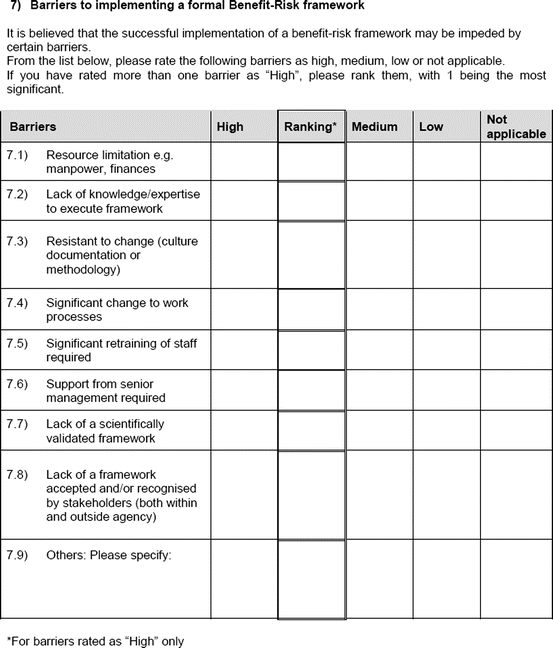
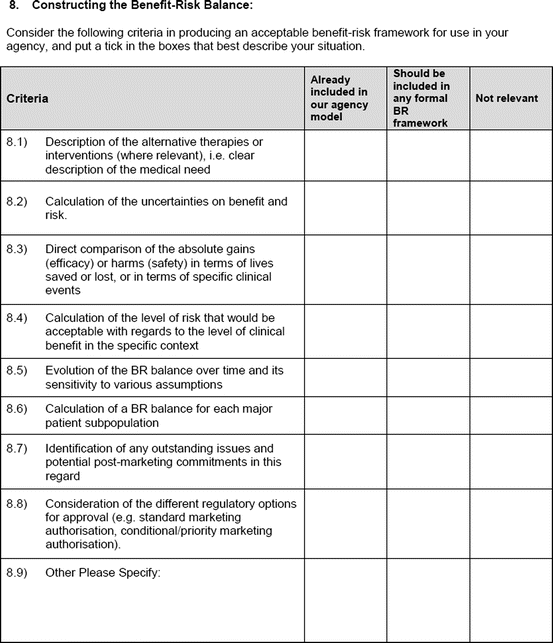
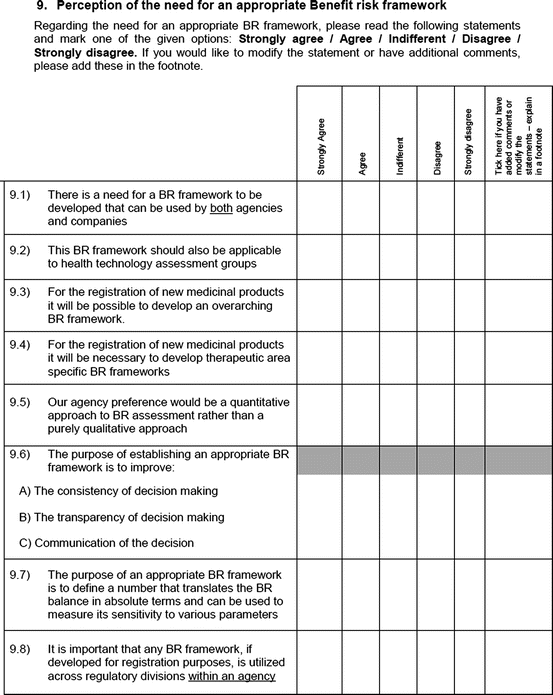
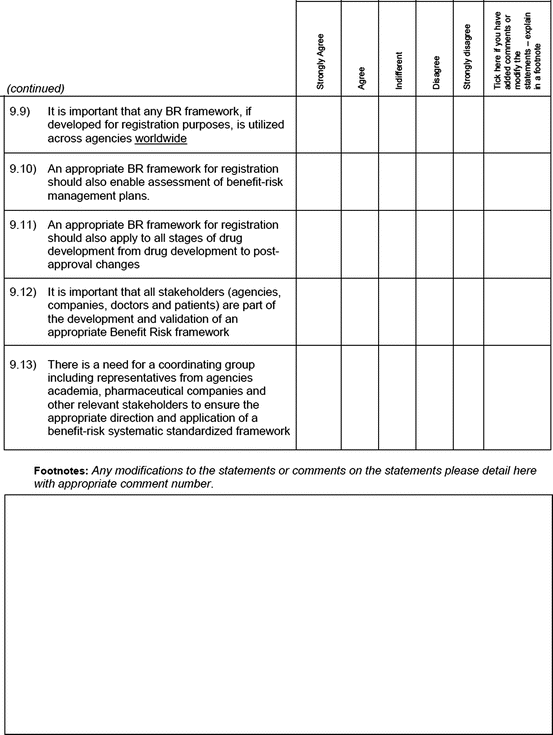
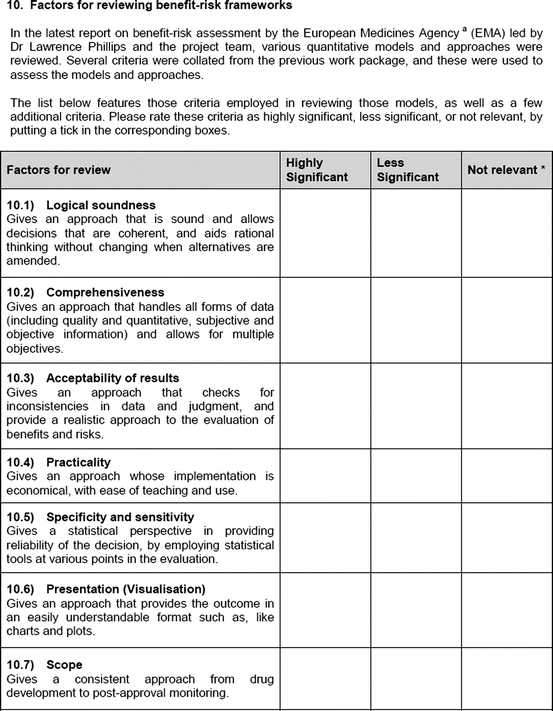


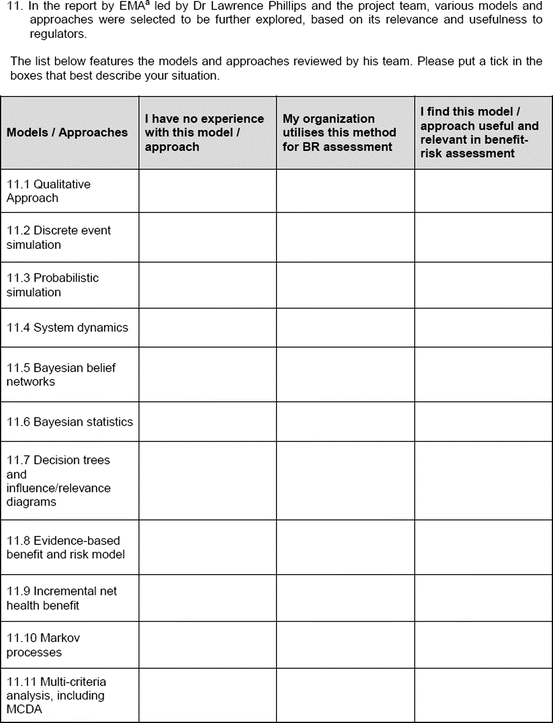
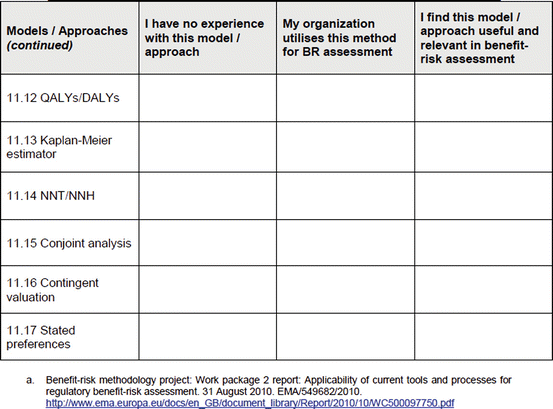
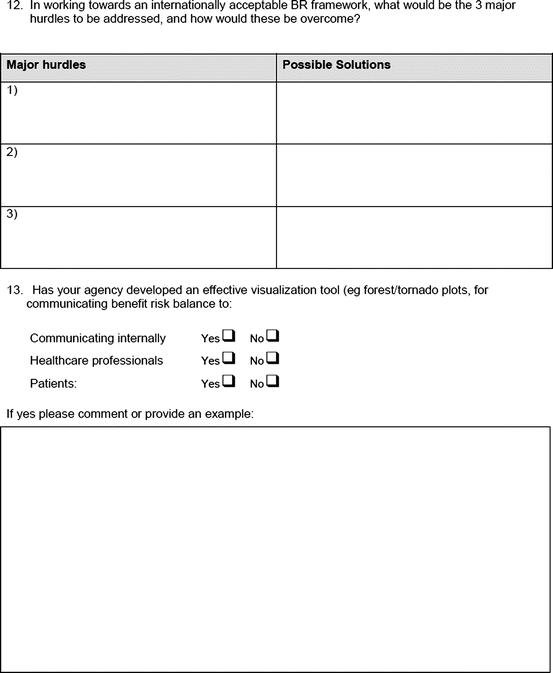
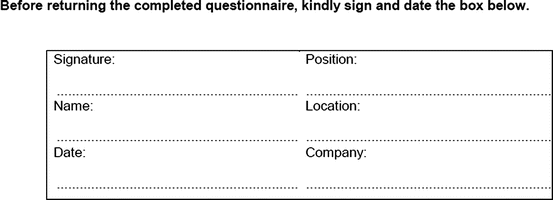


Fig. 3.1
Study tool
All participants were required to indicate if they were from regulatory authorities (“agencies”) or pharmaceutical companies (“companies”). The questionnaires were sent via email directly to the participants. Completed responses were received via email, as instructed to the participants.
Data Processing and Analysis
All responses were stratified into two groups, the agencies and the companies, allowing comparisons between these two stakeholders.
Some items that required categorical inputs in the questionnaire received very low responses. To allow meaningful interpretation of the results, these low responses were combined with others into logical categories. Variables of similar opinions were also grouped, as seen in Table 3.3.
Table 3.3
Grouping of categorical variables
Categorical variables | Logical groups for interpretation | |
|---|---|---|
Yes, no, sometimes | Yes, sometimes | No |
Strongly agree, agree, indifferent, disagree, strongly disagree | Strongly agree, agree | Indifferent, disagree, strongly disagree |
High, medium, low, not applicable | High | Medium, low, not applicable |
All other data were expressed as percentage over number of responders for that item, and ranking was applied when necessary. Free-text comments were collated and presented in appropriate categories.
This was designed as an exploratory study and the outcomes were interpreted to provide qualitative inferences relating to the objectives. No statistical analyses were planned or conducted.
Results
For the purpose of clarity, the results will be presented in three parts:
Part I: Current systems for benefit–risk assessment during development and review
Part II: Criteria identified for the development of a universal benefit–risk assessment framework
Part III: Barriers and solutions to implementing benefit–risk assessment frameworks
Demographic Characteristics of the Study Participants
A total of 38 questionnaires were sent out to 24 pharmaceutical companies and 14 regulatory agencies. Eleven out of 14 (79 %) agencies responded. These agencies included the European Medicines Agency (EMA), national agencies from the European member states, Medicines and Healthcare products Regulatory Agency of UK (MHRA), the US Food and Drug Administration (US FDA), Therapeutic Goods Administration of Australia (TGA), Health Canada, Swissmedic, and the Health Sciences Authority of Singapore (HSA). Among the companies, 20 out of 24 (83 %) responded. These companies comprised of both small and large organizations. The overall responders formed a diverse group with representation from developed and developing nations.
Part I: Current Systems of Benefit–Risk Assessment During Development and Review
Usage of Qualitative and Semiquantitative Systems
No responders indicated that they used a fully quantitative system. Among the agencies, there were similar numbers using qualitative and semiquantitative systems (five versus six agencies, respectively). A similar trend was observed among the companies when making a decision to submit an application, with ten companies using qualitative systems and nine using semiquantitative systems. However, during the companies’ development of a medicine, more used qualitative systems than semiquantitative systems (13 versus seven companies respectively). Generally, it was observed that the companies utilized qualitative systems more frequently than the agencies.
Use of Values, Weights, and Selected Assessment Parameters
Six agencies and nine companies who were currently using semiquantitative systems responded and similar trends were observed between the two. Combining the two response options of “Yes” and “Sometimes,” it demonstrated that two thirds of responders assigned values and one third assigned weights for benefit and risk parameters (Fig. 3.2). There was no observed correlation between responders who provided value inputs and those who applied weighting. This suggests weighting of parameters was not commonly utilized in the assessment of benefits and risks.
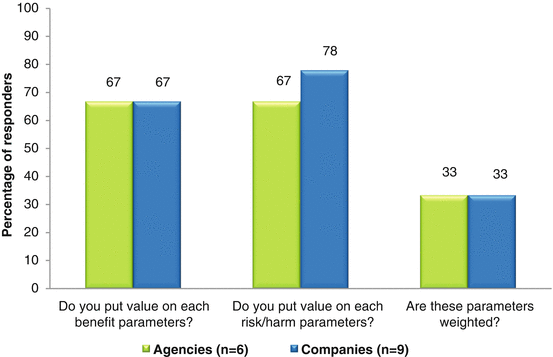

Fig. 3.2
Percentage of responders applying values and weights to benefit and risk parameters
Among these agencies, the majority used number needed to treat (NNT) and number needed to harm (NNH), while the companies tended to include other parameters (Fig. 3.3). Nonetheless, NNT and NNH were the commonly utilized parameters in semiquantitative systems for assessing benefits and risks between the agencies and companies.
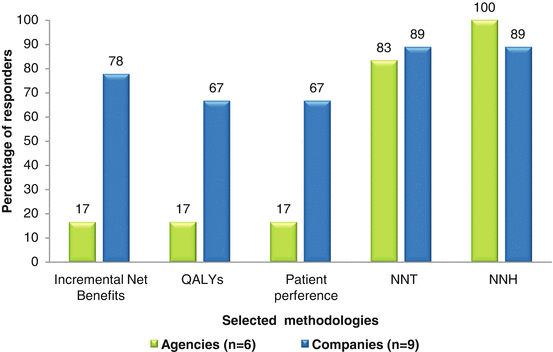

Fig. 3.3
Percentage of responders applying selected methodologies
Other parameters indicated by responders were Markov modeling, Pharmaceutical Research and Manufacturers of America Benefit–Risk Action Team (PhRMA BRAT) framework, probabilistic sensitivity analysis, and sales statistics.
Experiences with Various Systems and Approaches
To obtain the participants’ experience with some commonly used systems and approaches (collectively known as methodologies), a list of 17 methodologies (Table 3.4) was presented to the participants in the study. Ten agencies and 19 companies responded.
Table 3.4
List of 17 methodologies presented in study
Qualitative approach | Decision trees and influence/relevance diagrams | KM estimators |
Discrete event approach | Evidence-based benefit–risk model | NNT/NNH |
Probabilistic simulation | Incremental net health benefits | Conjoint analysis |
System dynamics | Markov processes | Contingent valuation |
Bayesian belief networks | MCDA | Stated preferences |
Bayesian statistics | QALY/DALY |
The most common methodologies used by the agencies included the qualitative approach and NNT/NNH (Table 3.5). The agencies had minimal or no experience with a discrete event approach, system dynamics, stated preferences, conjoint analysis, Bayesian belief network, and contingent valuation. In comparison, companies showed a similar trend to the agencies for the methodologies frequently used. However, the companies had more experience with a wider variety of methodologies, with responses provided across all the presented systems and approaches. Major differences in experience were observed for stated preferences (agencies 11 % versus companies 56 %) and conjoint analysis (agencies 10 % versus companies 61 %); companies had markedly more experience with these two methodologies.
Table 3.5


Top five methodologies currently used by agencies and companies
Stay updated, free articles. Join our Telegram channel

Full access? Get Clinical Tree


