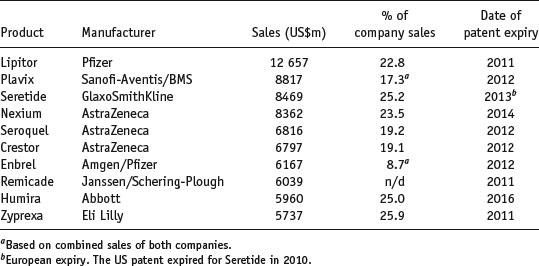
While it is tempting to assume that all drug products are financial blockbusters, approximately 70% never generate sufficient sales to recoup their development costs. Table 1.2 shows the top 20 medicines by sales worldwide (and the percentage of revenue they generate for their respective companies). It is apparent that a significant percentage of income is generated from these blockbuster products, and the financial health and prospects of the originator company are largely dependent upon the extent of patent protection (allowing market exclusivity) and new drug products in the development pipeline.
Table 1.2 Top ten drugs by sales worldwide in 2010 (data from IMS Health).
These numbers imply that development of a drug product in the right therapeutic area can result in significant income, but the costs involved in reaching market are such that only a few potential drug substances can be considered for development. How best to select a compound for development from the myriad of chemical structures that may be available? It is tempting to think that the decision reduces to efficacy against a biological target alone, but in practice physicochemical properties affect how a substance will process, its stability and interaction with excipients, how it will transfer to solution and, ultimately, define its bioavailability. The compound showing greatest efficacy may not ultimately be selected if another compound has a better set of physicochemical properties that make it easier to formulate and/or manufacture. It follows that characterising the physicochemical properties of drug substances early in the development process will provide the fundamental knowledge base upon which candidate selection, and in the limit dosage form design, can be made, reducing development time and cost. This is the concept of preformulation.
1.2 Assay design
In the early stages of preformulation the need rapidly to determine bioavailability, dose and toxicity data predominate and hence the first formulations of a drug substance are usually for intravenous injection. The first task facing any formulator is thus to prepare a suitable formulation for injection – most often this requires only knowledge of solubility and the development of a suitable assay. It is extremely important to note here that no development work can proceed until there is a suitable assay in place for the drug substance. This is because experimentation requires measurement.
1.2.1 Assay development
Assays greatly assist quantitative determination of physicochemical parameters. Since each assay will in general be unique to each drug substance (or, more correctly, analyte) development of assays may be time-consuming in cases where many drug substances are being screened. The first assays developed should ideally require minimum amounts of sample, allow determination of multiple parameters and be applicable to a range of compounds. For instance, a saturated solution prepared to determine aqueous solubility may subsequently be used to determine partition coefficient, by addition of n-octanol.
Note at this stage that determination of approximate values is acceptable in order to make a go/no go decision in respect of a particular candidate and so assays do not need to be as rigorously validated as they do later in formulation development. Table 1.3 lists a range of molecular properties to be measured during preformulation, in chronological order, and the assays that may be used to quantify them. These properties are a function of molecular structure. Once known, further macroscopic (or bulk) properties of the drug candidate can be measured (Table 1.4). These properties result from intermolecular interactions. Note also that determination of chemical structure does not appear, as it is assumed that the chemists preparing the candidate molecules would provide this information. Note also that solubility will be dependent upon physical form (polymorph, pseudopolymorph or amorphous).
Table 1.3 Molecular sample properties and the assays used to determine them.
| Property | Assay | Requirement of sample |
Solubilitya
| UV | Chromophore |
| pKa | UV or potentiometric titration | Acid or basic group |
| Po, w/log P | UV TLC HPLC | Chromophore |
| Hygroscopicity | DVS TGA | No particular requirement |
Stability
| HPLC, plus suitable storage conditions | No particular requirement |
aSolubility will depend on physical form. | ||
Table 1.4 Macroscopic (bulk) sample properties and the techniques used to determine them.
| Derived property | Technique |
| Melting point | DSC or melting point apparatus |
| Enthalpy of fusion (and so ideal solubility) | DSC |
| Physical forms (polymorphs, pseudopolymorphs or amorphous) | DSC, XRPD, microscopy |
Particle shape
| MicroscopyParticle sizingBET (surface area) |
Density
| Tapping densitometer |
| Flow | Angle of repose |
| Compressibility | Carr’s indexHausner ratio |
| Excipient compatibility | HPLC, DSC |
Full characterisation of a drug substance should be possible with just five techniques: ultraviolet (UV) spectrophotometry, thin-layer chromatography (TLC), high-performance liquid chromatography (HPLC), differential scanning calorimetry (DSC) and dynamic vapour sorption (DVS). This explains the popularity of these techniques in pharmaceutical development laboratories and so their basic principles are outlined below. Other, more specialised techniques (such as X-ray powder diffraction, XPRD) provide additional information. Application of the techniques is discussed in later chapters, but the basic principles are discussed below.
Note that in the limit the sensitivity of the assay will be dependent upon the purity of the sample (greater levels of impurity lowering sensitivity) and so assay development should be undertaken with the purest sample obtainable. Sensitivity can be expressed in many ways, but commonly detection limits (DL) or quantification limits (QL) are specified. There are many ways of calculating DL and QL values. ICH Guideline Q2(R1) (2005) defines the following:
(1.1)
(1.2)
where σ is the standard deviation of the blank measurement and s is the slope of the calibration plot. Since all assays require understanding of concentration terms, these concepts will be discussed first.
1.3 Concentrations
Concentration terms simply define the ratio of two components in a particular sample. The minor component is termed the solute and the major component is termed the solvent. It does not matter what the physical forms of the solute and solvent are (i.e. they can be solid, liquid or gas, although certain combinations are not usually encountered, such as a gas dissolved in a solid).
Importantly, a concentration term specifies the amount of solute present per unit of solvent. Thus, defining a concentration gives no information on how large the sample is; everything is normalised to a particular unit. So, for instance, if a sample is defined as a 1 M aqueous solution of aspirin, there is a mole of aspirin in every litre of water. It is not possible to know from this statement how much solution there is. If, instead, the sample was defined as 500 mL of a 1 M aqueous solution of aspirin, there is sufficient information to know everything about what material is present and in what quantity.
1.3.1 Units of concentration
The amounts of solute and solvent can be specified a number of ways. The most commonly encountered units in pharmaceutics are:
- Molar (M, moles per litre)
- Molal (m, moles per kg)
- Percentages (w/w, w/v, v/v)
- Weight per volume (mg mL−1)
- Parts per million (ppm)
- Mole fraction (x)
Since it is possible to define concentrations with a multitude of terms, care must be taken when comparing systems expressed in different units. The major issue to be accounted for is the molecular mass of the solute.
Example 1.1 Which of the following pairs of solutions (assume there is 1 L of each) contains the same number of solute molecules?
The answer is (b), because the amount of solute is expressed in terms of molarity, which is independent of molecular weight.
For small organic molecules, such as the majority of drugs, differences in the number of molecules between solutions expressed in weight percentages may be small, but as the molecular weight of the solute increases (where polymeric excipients are used, for instance) the differences can become significant. Care must be taken when constructing and interpreting an experimental series based on percentage concentrations that differences observed between solutes do not arise simply as a result of different numbers of solute molecules per unit volume.
Molar concentrations avoid this problem and so molar is the standard unit of concentration used in the SI1 (le Système International d’Unités) nomenclature. If Z is the molecular weight of a solute, then Z grams of that solute contains 1 mole (6.022 × 10²³) of molecules.
The difference between molar (M) and molal (m) is the same as the difference between % w/v and % w/w (i.e. 1 M is 1 mole per litre while 1 m is 1 mole per kilogram).
In pharmaceutics the molarities of typical solutions may be very low and hence the most frequently encountered units are those based on weight or volume fractions. Many dosage forms are solids and thus are more amenable to percentage concentration expressions. Also, if the molecular weight of a new drug substance is not known, then it is not possible to calculate molar or molal concentrations.
Example 1.2 What do the following concentration terms mean?
In the case of (a) the concentration term (w/v) implies a solid solute has been dissolved in a liquid solvent; 0.1% implies that the ratio of solute to solvent is 0.1:100. So 0.1% w/v means 0.1 g of solute in 100 mL of solvent.
In the case of (b) the concentration term (w/w) implies a solid solute has been dissolved in a solid solvent; 2% implies that the ratio of solute to solvent is 2:100. So 2% w/w means 2 g of solute in 100 g of solvent.
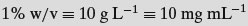
Another point to remember is that percentage terms are expressed per 100 mL of solvent while molar terms are expressed per litre of solvent. Although weight percentage terms are common in pharmaceutics, again the low concentrations often used make the numbers small. Also, many medicines are defined as weight of drug per unit dose (50 mg per tablet for instance), so weights per unit volume concentrations are very often used:
- 2 mg mL−1
- 50 mg L−1
- 10 g L−1
Example 1.3 Do the following solutions contain equal numbers of molecules?
Not in the case of (a) as the molecular weights of the drug substances are different. The only concentration terms that normalise for numbers of molecules are molarity or molality. In the special case (b) the drug substances have the same molecular weight and so the numbers of molecules are equal.
The term ppm is less commonly encountered in pharmaceutics, being more associated with gases or very dilute contaminants in solution; 1 ppm means 1 part of solute to a million parts of solvent (easily remembered as 1 mg per litre).
There is one further way of expressing concentration: mole fraction (x). The mole fraction of a component is defined as the number of moles of that component divided by the total number of moles of all of the components in the system:
(1.3)
Mole fractions are dimensionless and must always have a value between 0 and 1. The sum of the mole fractions of all the components in a system must equal 1. Mole fraction units are useful if there are two or more solutes in the same solvent.
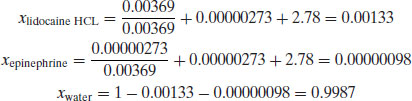
Example 1.4 A solution for intravenous injection is prepared at 25 °C with the following constituents: water (50 g, RMM 18), lidocaine hydrochloride (1 g, RMM 270.8) and epinephrine (0.5 mg, RMM 183.2). Calculate:
- The mole fraction of lidocaine hydrochloride
- The mole fraction of epinephrine
- The mole fraction of water
Firstly, the number of moles of each component must be calculated:
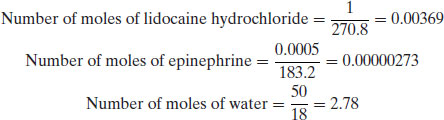
and so
- Concentrations define the amount of solute per unit volume or mass of solvent.
- Molar or molal concentrations can be compared in terms of numbers of solute molecules.
- Percent or weight/volume terms are more common in pharmaceutics and can be converted to molar/molal concentrations if the molecular weight of the solute is known.

1.4 UV spectrophotometry
Unless there is a good reason not to, the primary assay developed during preformulation will be based on UV spectrophotometry. Many factors contribute to the popularity of the technique, including familiarity, cost, amount of solution used and the fact that the majority of drug substances contain at least one functional group that absorbs in the ultraviolet (UV) region (190–390 nm). Table 1.5 lists the UV absorbance maxima for a series of common functional groups (called chromophores).
Table 1.5 UV absorbance maxima for a range of common functional groups (data from Wells (1988)).
| Chromophore | λmax (nm) | Molar absorption ( ) ) |
| Benzene | 184 | 46 700 |
| Naphthalene | 220 | 112 000 |
| Anthracene | 252 | 199 000 |
| Pyridine | 174 | 80 000 |
| Quinoline | 227 | 37 000 |
| Ethlyene | 190 | 8000 |
| Acetylide | 175–180 | 6000 |
| Ketone | 195 | 1000 |
| Thioketone | 205 | Strong |
| Nitrite | 160 | – |
| Nitroso | 302 | 100 |
| Nitro | 210 | Strong |
| Amino | 195 | 2800 |
| Thiol | 195 | 1400 |
| Halide | 208 | 300 |
Since a chromophore is a functional group with absorption in the UV range, excitation of the solute with the appropriate wavelength of light will reduce the amount of light passing through the solution. If the original light intensity is I0 and the amount of light passing through the sample (the transmitted light) is I, then the amount of light absorbed will be a function of the concentration of the solute (C) and the depth of the solution through which the light is passing (the path length, l), usually expressed as the Beer–Lambert equation:
(1.4)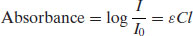
where  is a constant of proportionality called the molar absorption coefficient. Higher values of
  mean greater absorbance by the solute. Values of
  for a range of functional groups are given in Table 1.5; it can be seen that groups containing large numbers of delocalised electrons, such as those containing benzene rings, have much greater
  values than groups containing simple carbon–carbon double bonds. Many drug substances contain aromatic moieties of carbon–carbon double bonds, which is why UV spectroscopy is a good first choice assay.
The absorbance of a chromophore can be affected by the presence of an adjacent functional group if that group has unshared electrons (an auxochrome). A list of common auxochromes and their effects on the molar absorption coefficients of their parent benzene ring is given in Table 1.6.
Table 1.6 The effect of auxochromes on the UV absorbance of the parent compound C6H5–R (data from Wells (1988)).
| Substituent | λmax (nm) | Molar absorption ( ) ) |
| –H | 203.5 | 7400 |
| –CH3 | 206.5 | 7000 |
| –Cl | 209.5 | 7400 |
| –OH | 210.5 | 6200 |
| –OCH3 | 217 | 6400 |
| –CN | 224 | 13 000 |
| –COO− | 224 | 8700 |
| –CO2H | 230 | 11 600 |
| –NH2 | 230 | 8600 |
| –NHCOCH3 | 238 | 10 500 |
| –COCH3 | 245.5 | 9800 |
| –NO2 | 268.5 | 7800 |
Use of the molar absorption coefficient is fine when concentrations are expressed in molar terms. However, as noted above, in pharmaceutics it is more common to express concentrations in percentage terms, in which case an alternative constant of proportionality must be defined. This is usually of the form of a specific absorption coefficient (A). Although any such constant may be defined, usually the reference value is the absorbance of a 1% w/v solution in a 1 cm path length UV cuvette:

The Beer–Lambert equation therefore becomes
(1.6)
Assuming a 1 cm path length cuvette is used then

Knowledge of the value of A1%1 cm allows determination of the concentration of a solution by measurement of its absorbance (and will yield an answer in % w/v). Values of A1%1 cm are often quoted in pharmacopoeial monographs.
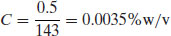
Example 1.5 What is the concentration of a solution of buflomedil hydrochloride that gives an absorbance reading of 0.5 at 275 nm (A1%1 cm = 143 at 275 nm)?
From Equation (1.5),
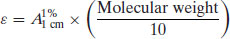
As might be expected, the molar absorption coefficient and the specific absorption coefficient are related through the molecular mass of the solute.
Study question 1.1 Show that the molar absorption coefficient ( ) and the specific absorption coefficient (A1%1 cm) are related according to the following relationship:
The A1%1 cm value for most drug substances lies in the range 200–1000 with a mean of ca. 500. A 10 μg mL−1 solution of a drug with A1%1 cm = 500 would give an absorbance of 0.5, well within the range of UV spectrophotometers. Compounds with A1%1 cm < 50 are generally too poorly absorbing for successful UV analysis.
1.4.1 Method development for UV assays
If the compound has good aqueous solubility then water is the most appropriate solvent. Frequently, however, a drug substance will have poor aqueous solubility, in which case an alternative strategy is required. Methanol is a good solvent as a first attempt, as it is a good solvent for both polar and nonpolar drugs, it does not have significant UV absorbance and solubility is often nearer to ideal (see Chapter 4). An additional benefit is that it is miscible with water, so the drug substance can initially be dissolved in a small volume of methanol and then diluted with water. Dilution is best achieved with 0.1 M HCl or NaOH (as appropriate, depending upon whether the drug substance is a weak acid or base) since this will maximise ionisation, and hence solubility, and neither solute absorbs in the UV region.
Other solvents may be used in UV spectroscopy but their UV cut-off (the wavelength below which they absorb significantly) may differ from water (Table 1.7). In the worst case a solubilising agent can be added, but care must be taken to ensure it does not absorb in the UV range or, if it does, to correct for the absorbance with a suitable blank.
Table 1.7 Suitable solvents for UV analysis.
| Solvent | UV cut-off wavelength (nm) |
| Water | 200 |
| Methanol | 200 |
| Ethanol (96%) | 200 |
| Propanol | 200 |
| Isopropanol | 210 |
| Butanol | 210 |
| Pentanol | 210 |
| n-Hexane | 210 |
| n-Heptane | 210 |
| Glycerol | 200 |
| Acetonitrile | 200 |
| Cyclohexane | 210 |
| iso-Octane | 210 |
| Dioxane | 220 |
| Ethyl ether | 220 |
| Chloroform | 245 |
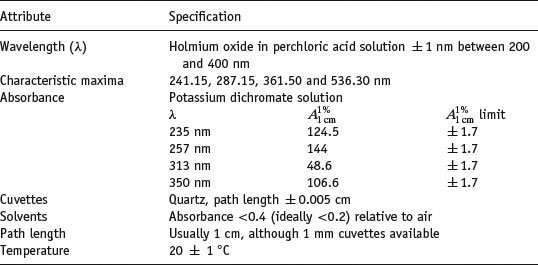
The performance of the instrument should be checked prior to use with reference standards. (This is true for all analytical instruments. Institutions such as the National Institute for Standards and Technology, NIST, or the Laboratory of the Government Chemist, LGC, can advise on and supply certified reference materials, CRMs). A solution of holmium oxide in perchloric acid solution can be used for wavelength calibration (Weidner et al., 1985) and is specified in the Ph Eur, while a solution of potassium dichromate can be used to check absorbance (Burke and Mavrodineanu, 1976, 1977). The properties of these solutions, as well as typical specifications for a well-performing instrument are given in Table 1.8.
Table 1.8 Specifications for a UV spectrometer (data from Wells (1988)).
A full spectrum scan of the solution will allow assessment of the most appropriate wavelength (λ) for analysis. Ideally, this would be the wavelength at which maximum absorption is seen (λmax), corresponding to the tip of an absorbance peak. Failing that, alternative options (in order of preference) are an absorbance valley, a shoulder or a slope. The full spectrum should be checked at low and high concentrations to ensure that the λ chosen is not concentration-dependent (for instance, if the peak of an absorbance maximum is chosen, a small shift in the peak with concentration may lead to a significant fall in absorbance). If the value of λmax is close to that of a suspected impurity, or that of a solubilising agent if used, then an alternate wavelength can be chosen.
Preparation of a 10 μg mL−1 solution should allow rapid determination of the A1%1 cm value. If it is not possible to prepare a solution of exactly 10 μg mL−1 then any alternative concentration may be used, since A1%1 cm is proportional to concentration. Rearranging Equation (1.7),
(1.8)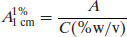
If solutions are prepared in mg mL−1 units then
(1.9)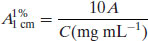
If the solute absorbs very strongly that the stock solution must be diluted, then the dilution factor (F) can also be accounted for in determining the value of A1%1 cm:
(1.10)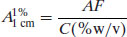
(1.11)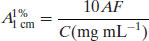
Alternatively, a full calibration plot can be prepared from a series of stock solutions of known concentrations. Although this takes more time and uses more material, the benefits are that linearity of response is demonstrated as a function of concentration and errors are reduced. Care must be taken that, if the solute degrades, solutions are prepared and analysed as quickly as possible.


