Basic principles of instrumentation and signal-processing

3


Basic principles of instrumentation and signal-processing


INTRODUCTION


The practising clinician does not need to know exactly how an evoked-potential (EP) system works, but he or she does need to know when it is not working. With familiar equipment such as an operating microscope, the same principle holds, but in this case it is easy to tell when the equipment is not working. If the image cannot be clearly focused, there is obviously a problem: if, however, the microscope should give a perfectly clear image but one showing abnormal anatomy when the patient being examined is normal, then such a fault could not easily be detected. It is a principle of basic optics that such a problem cannot occur with a microscope, but exactly that problem can happen with an evoked-potential system.


When being tested with auditory-evoked potentials, the patient is connected to the system, stimulated with sound, and produces a response. Diagnostic inferences are then made, based upon that response. If the equipment is not set up correctly, it is possible that the response will be determined more by the physics of sampling and filtering than by the physiology of the patient. Once the response has been obtained, there may be no way of knowing whether equipment errors have been responsible for the final waveform. The clinician is left with a response which will be interpreted in the light of other clinical data in order to make a diagnosis. It is, therefore, important to know the basic principles of an EP system, to be aware of the important factors in setting up the equipment so that valid diagnoses can be made, and to know how such systems can be checked and calibrated.


The basic task of the recording system is to extract small amplitude EPs from other electrical signals recorded from the same site. As the EP is the signal of interest, all other electrical waveforms may be regarded as interference and contamination of the record. In some instances, an EP of 1 μV will be contained within a recording which has 50 μV of electrical activity as a result of physiologic signals or electrode-contact potentials, and it is important to maximize the signal-to-noise ratio (S/N) of the EP. All the elements in an EP recording system play a part in improving the signal-to-noise ratio.


BASIC RECORDING TECHNIQUES


Electrodes


In this section, only surface electrodes will be considered. Although needle and other electrodes are used for recording some EPs, these will be detailed when the appropriate response is considered.


It is at the surface of the scalp that the S/N ratio is worst for a surface-recorded EP. Therefore, some care should be taken in the choice of electrodes, in their placement, and in the technique used for attaching them to the scalp. Poor electrode technique can worsen the S/N ratio still further, and, clearly, such an effect must be minimized.


An electrode in contact with the skin generates a contact potential which substantially adds to the noise from which the EP must be extracted. The electrical impedance of the electrode/skin junction not only plays a part in determining the value of the contact potential, but also determines the noise generated by the electrode and the magnitude of induced electromagnetic artefacts. Clearly, the contact impedance of the electrode must be kept low in order to minimize these effects.


Prior to attaching the electrode, one should prepare the skin surface by vigorous rubbing with spirit or acetone. This removes grease and layers of dead skin, and reduces the electrode/skin contact impedance.


The electrode material is the major factor determining the contact potential. Silver has a low contact potential, and further improvements can be made by using a fluid-column electrode in which the electrode itself does not touch the skin, the connection being made by a saline solution or electrode jelly. The noise generated by the electrode is predominantly low-frequency, and this noise may be reduced by using a reversible electrode, such as silver coated with silver chloride.


Again at low frequencies, the electrode may cause distortion because of the capacitance that its contact with the skin produces. The distortion caused by this electrode capacitance is very small for silver/silver chloride electrodes.


The electrode contact with the skin should be tested with an alternating-current impedance meter. This measure is one that varies with the frequency at which it is taken, and so a ‘good contact’ can be represented by an impedance of 2000 Ω measured at 1000 Hz, or by an impedance of 4000 Ω measured at 20 Hz. Both of these figures can represent the same degree of contact between the electrode and the skin. It is important, therefore, to be aware of the frequency at which the impedance meter tests the electrodes. Many commercial systems have built-in impedance meters, and, in general, these use a frequency of around 50 Hz. For reasons that will be given in the next section, it is important that the impedances of each electrode pair should be as similar as possible. It is better to achieve balanced impedances than to have only one electrode with a very low impedance. Direct-current test meters should never be used to measure electrode contact. This can polarize the electrodes, adding to the noise they produce, and, more significantly, currents in excess of the present safety limits could be passed through the patient.


It is common practice to place the recording electrodes in the standard position defined by the international 10–20 system for electroencephalography (Jasper 1958). Currently, there is no generally accepted form for presenting the waveform recorded from an electrode pair. For many of the auditory-evoked potentials, both electrodes are ‘active’ and will register some of the response. The choice of which electrode represents the positive input to the amplifier is therefore an arbitrary one, and examples of both the possible waveform polarities may be found in the literature. It should be recognized that changes in electrode position can result in changes in waveform morphology, latency, and amplitude.


Differential amplification


As its name implies, a differential amplifier is one whose output is equal to the difference between two input voltages. Thus, for two input voltages A and B, the output of the amplifier is G(A–B) where G is the gain of the amplifier. Such an amplifier can improve the S/N ratio in the following way. The unwanted background noise, predominantly the EEG, is very nearly the same signal at many places on the scalp. If a pair of electrodes are positioned such that much of the noise is the same at both electrodes but the EP presents predominantly to only one of the positions, then when the signals from the pair of electrodes are fed into a differential amplifier, the noise that is common to the two electrodes will be cancelled, whilst the EP will be largely unchanged. Assuming, for the sake of simplicity, that the EP presents only to electrode A with a voltage Ea, then the two signals at A and B are, respectively, (A) = Ea + Nc + Na and (B) = Nc + Nb, where Na and Nb are the lesser amounts of noise that differ between position A and position B, and Nc is the greater amount of noise that is common to the two electrodes. The output of the differential amplifier is Ea with the two noise components Na and Nb, and so the S/N ratio has been improved by the elimination of the common noise Nc. The degree to which a differential amplifier can cancel common noise is called its common-mode rejection ratio (CMRR). This should be of the order of 100 dB, meaning that voltages which are identical at the input will be attenuated by 100 dB at the output.


If the impedance of one electrode is very much less than that of the other, the differential amplifier is no longer balanced and its CMRR will be decreased. Thus, for good noise reduction, it is important to keep the contact impedances of the electrodes as similar as possible.


The electrode/skin junction provides a capacitive connection between the signal generated on the scalp and that passed to the differential amplifier. This capacitance, combined with the input impedance of the differential amplifier, can create a filter which will distort the recorded waveform. To ensure that any such distortion occurs only at a frequency that is outside the frequency range of the response, the input impedance of the amplifier should be very high; generally, of the order of 10 MΩ.


Wires that are terminated in a high impedance are prone to pick up electromagnetic signals from external sources. Thus, the electrode leads should be kept as short as possible, and the differential amplifier placed close to the patient. The main amplifier may then be placed at some distance from the patient, provided that the output impedance of the differential amplifier is low enough that the wires leading from the differential amplifier to the main amplifier do not pick up significant amounts of interference.


Thus, the pre-amplifier of an EP system must be a differential amplifier to reduce common noise, have a high input impedance to minimize distortion, have a low output impedance so that the leads to the main amplifier do not pick up electromagnetic interference, and be placed close to the patient so that the electrode leads can be short. There is no requirement for a large gain at this stage, and the gain of the pre-amplifier is generally less than 10. Most of the actual amplification is carried out in the main amplifier.


Band-pass filtering


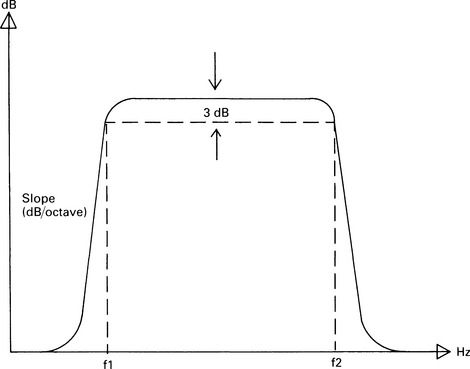
A filter, as its name implies, is a device which permits some frequencies to pass through unattenuated while filtering out others. A band-pass filter is one that will allow through frequencies lying within a certain range. The high and low cut-off frequencies of the band are described by the frequency at which the attenuation of the filter has reached 3 dB. Figure 3.1 shows a typical band-pass filter characteristic. The lower cut-off frequency is marked as f1, and the higher as f2. For frequencies lower than f1 or higher than f2, an increasing amount of attenuation is created by the filter. The steepness of the filter characteristic in these regions is known as the filter slope and is expressed in dB/octave.


The spectrum of a signal describes the amplitude of the different frequency components contained within that signal. A pure sine wave has only one component at the frequency of the wave. However, signals such as evoked responses have many components of different amplitudes and frequencies.


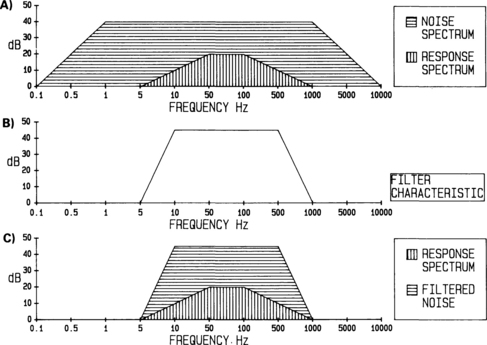
In general, the spectrum of the background noise is wider than that of the response. This is illustrated in Figure 3.2(A), in which the signal-to-noise ratio is represented by the ratio of the area delineated by the vertical lines to that delineated by the horizontal lines. Thus, there are frequency regions which contain only noise and no significant response-components. If the signal is passed through a band-pass filter whose characteristics are set such that the spectrum of the response is not modified, then those frequency regions containing only noise can be eliminated and the S/N ratio improved. Figure 3.2(B) shows a filter characteristic, and the resultant spectra which appear at the output of the filter are shown in Figure 3.2(C). The ratio of the areas of the response spectrum to the noise spectrum has now been significantly increased.


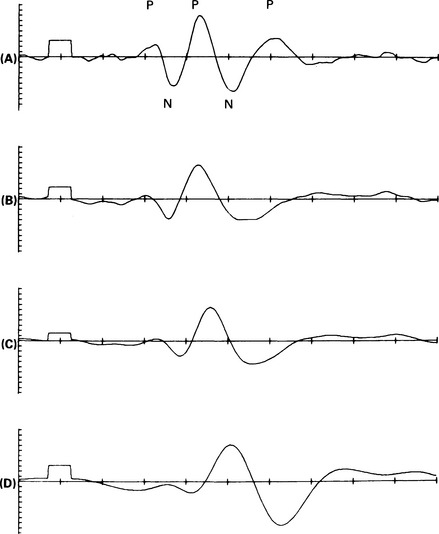
As the filter bandwidth is narrowed, the S/N ratio for the response improves. However, at some frequency, the band limits begin to filter out the response spectrum, eliminate components of the response, and hence distort the waveform and reduce response amplitude. Figure 3.3 shows the effects of different recording bandwidths on the post-auricular muscle (PAM) response, and it can be seen that the response is markedly altered. Clearly, the band limits have to be chosen with considerable care.


Physicists are often concerned with setting filter limits to preserve waveform fidelity. However, clinically, one does not have to be unduly concerned with this idea. In clinical practice, maximum waveform fidelity is an arbitrary concept involving considerations of what is the ‘true’ response and whether the eliminated frequency components are a clinically significant part of the response. If the response is to be used for threshold estimation, then maximum response detectability is required, and waveform distortion is not important. Thus, for this application, filter limits should be chosen to maximize response detectability rather than for any other reason. Only if there is diagnostic information to be obtained from the waveform of the response should the filter limits be set such that the waveform is not distorted.


The filter will also introduce a propagation delay which increases as the bandwidth becomes narrower. If no allowance is made for this delay, then the response latencies may be in error by the amount of the propagation delay. This may be easily checked by using a click stimulus and connecting the electrical signal at the headphones via an attenuator to the input pre-amplifiers. The latency of the stimulus should, of course, be 0 and any discrepancy from this value is most probably an indication that the equipment has not allowed for filter-propagation delays. Such discrepancies have been seen in commercially produced equipment.

Stay updated, free articles. Join our Telegram channel

Apr 10, 2017 | Posted by in PATHOLOGY & LABORATORY MEDICINE | Comments Off on Basic principles of instrumentation and signal-processing

Full access? Get Clinical Tree

Get Clinical Tree app for offline access