Chapter 1 Basic Principles and Pharmacodynamics
Drug Nomenclature
Trade, Brand, or Proprietary Name
 Clinical Connection: Drugs can have many different names. For example, a prototypical calcium channel blocker of the dihydropyridine class has the chemical name 3,5-dimethyl 2,6-dimethyl-4-(2-nitrophenyl)-1,4-dihydropyridine-3,5-dicarboxylate, the generic name nifedipine, and is available in the United States under several trade names including Adalat, Nifedical, and Procardia. Although marketing emphasizes trade names, the use of generic drug names is encouraged in practice to reduce prescribing errors and offers the opportunity for substitutions if appropriate.
Drug-Receptor Interactions
Although some notable exceptions exist, a fundamental principle of pharmacology is that drugs must interact with a molecular target to exert an effect. Drug interaction with molecular targets is the initiating event in a multistep process that ultimately alters tissue function. For the purposes of current discussion, the target will be referred to as a receptor. An in-depth discussion of molecular targets and a description of these processes will be presented later in this chapter (see the discussion of molecular mechanisms of drug action). Let us first consider the relationship between drug binding to its target receptors and the ultimate response of the tissue.


Law of Mass Action Applied to Drugs

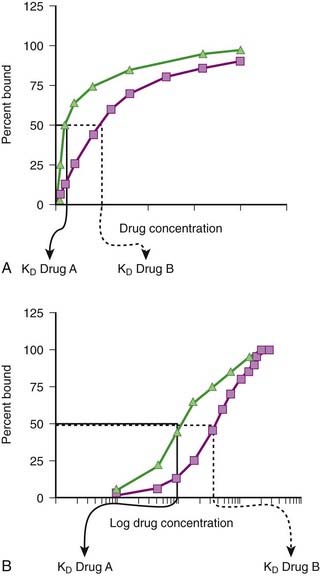
Although the amount of drug receptor-complex formed is proportional to the concentrations of drug and receptor, this relationship is not linear but is in fact parabolic (Figure 1-1, A). Accordingly, this relationship is most often diagrammed on a semilogarithmic graph to linearize the relationship and encompass the large range of concentrations typical of the drug-receptor relationship (Figure 1-1, B).
Factors Affecting Drug-Target Interactions
Drug Binding


It is important to recognize that, in most cases, binding of drug to target molecules involves weaker bonds. Accordingly, the drug-receptor complex is not static, but rather there is continuous association and dissociation of the drug with the receptor as long as drug is present. A measure of the relative ease with which the association and dissociation reactions occur is the equilibrium dissociation constant (KD). Each drug-receptor combination will have a characteristic KD value. Drugs with high affinity for a given receptor display a small value for KD, and vice versa. In Figure 1-1, A and B, Drug A has a higher affinity for the receptor than Drug B. KD also represents the concentration of drug needed to bind 50% of the total receptor population. These concepts are important in the study of basic pharmacologic data regarding different compounds with affinity for the same receptor. In general, drugs with lower KD values will require lower concentrations to achieve sufficient receptor occupancy to exert an effect.
Selectivity of Drug Responses
 The cell will respond only to the spectrum of drugs that exhibit affinity for the receptors expressed by the cell.

 Clinical Connection: β-Adrenergic receptor antagonists are effective drugs for a number of cardiovascular disorders. Some β-adrenergic receptor antagonists are selective for β1-adrenergic receptors to limit the potential for bronchoconstriction caused by blocking β2-adrenergic receptors. However, even β1-selective antagonists must be used cautiously in asthmatic patients, particularly at higher doses, to avoid further impairment of airway function in these patients.


Quantifying Drug-Target Interactions: Dose-Response Relationships
Graded Dose-Response Curves
 Measure an effect that is continuous such that, in theory, any value is possible in a given range (0% through 100%).
 Have a sigmoidal shape similar to the drug receptor occupancy curves shown in Figure 1-2, because the biologic response to a drug is determined by the interaction of a drug with a receptor or molecular target.


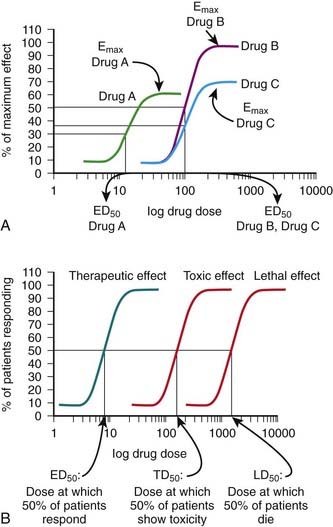
The ED50 and Emax are useful parameters to assess drugs. In Figure 1-2, A, Drug A is more potent than Drug B or Drug C, whereas Drugs B and C have equal potency. Potency is sometimes used incorrectly as a measure of therapeutic effectiveness. In fact, in most cases potency is secondary to Emax in drug selection. However, in situations in which the absorption of drug is very poor, such that only small quantities of the drug reach the target, potency can be a critical consideration. Drugs with higher Emax values have higher pharmacologic efficacy.
In Figure 1-2, A, Drug B has the greatest efficacy, followed by Drug C, whereas Drug A, despite being the most potent, has the least efficacy. Drug C is equipotent with Drug B but has less efficacy. Thus, potency and efficacy can vary independently. It is important not to confuse the pharmacologic usage of efficacy with the more general usage. Pharmacologic efficacy is a measure of the strength of effect produced by the maximum dose of drug. By definition, antagonists do not activate their receptors after binding and therefore have an intrinsic activity and efficacy of 0. Nevertheless, an antagonist may be very clinically “efficacious” or beneficial because it blocks activation of the receptor by endogenous agonist.
Quantal Dose-Response Curves
Quantal dose-response curves do the following:

 Describe the relationship between drug dosage and the frequency with which a biologic effect occurs. For example, in individuals administered an anticonvulsant medication, the percentage of individuals not experiencing a convulsive episode at any given dose is plotted in cumulative fashion (Figure 1-2, B).
 Represent a cumulative frequency distribution for a given response.
 Provide an ED50 value that reflects the dose of drug that produces a response in 50% of the population (also called the median effective dose).


 Can be plotted for therapeutic, toxic, and lethal effects to obtain:


