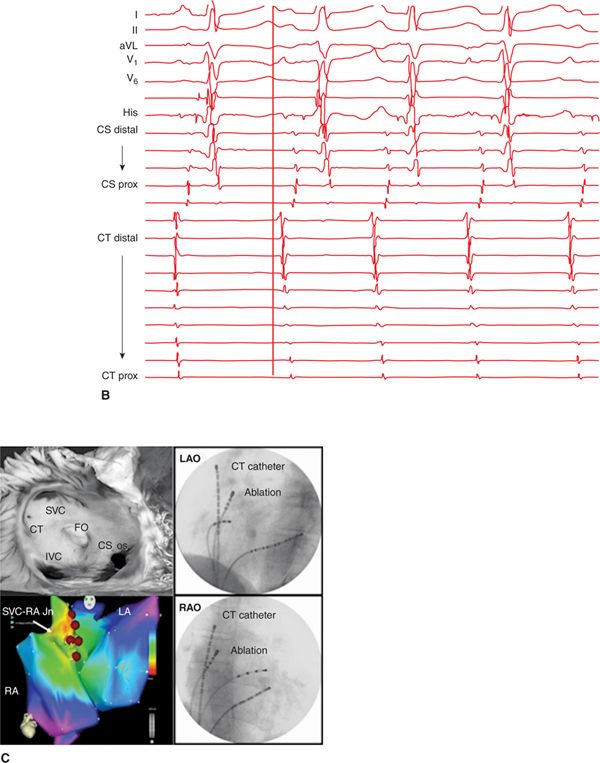
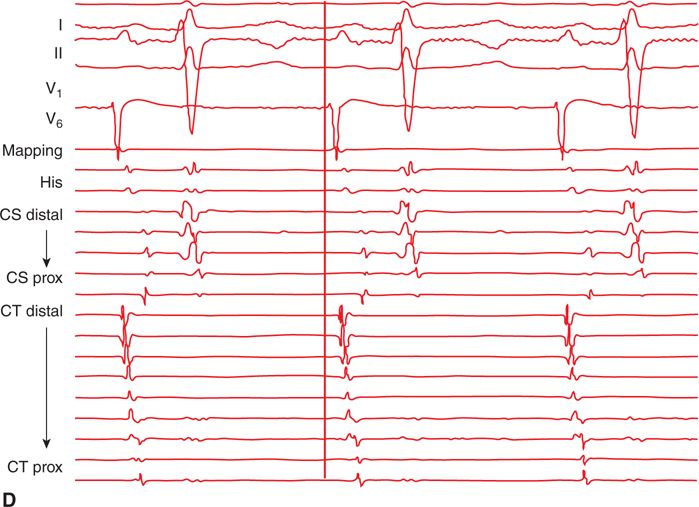
FIGURE 6-1 Patient TM. (A) Twelve-lead ECG showing recurrent bursts of FAT. Tachycardia P-wave morphology is similar to the sinus P-wave morphology. Biphasic (+/−) in V1, positive in lead I and negative in aVL indicates a CT origin. Positive morphology in the inferior leads indicates a position high on the CT. (B) Intracardiac electrograms EGMs. The earliest atrial signal is from the distal bipole of a catheter laid along the CT. (C) The upper left panel shows a coronal view of an anatomic specimen of the RA, with the CT running anterior to the SVC os and down the posterolateral right atrial wall before terminating anterior to the IVC. The lower left panel shows the electroanatomic map localizing the earliest site of activation during tachycardia to the superior CT, anteromedial to the SVC-RA junction. The panels on the right show LAO and RAO images of the catheter laid along the CT and of the ablation catheter at the time of successful termination of the tachycardia. (CT = crista terminalis; SVC = superior vena cava; IVC = inferior vena cava; FO = foramen ovale; CS os = coronary sinus os; RA = right atrium.) (D) The mapping catheter records an EGM 20 ms ahead of the P wave. Ablation at this location successfully terminated the tachycardia.
EPIDEMIOLOGY
Focal atrial tachycardia (FAT) is a relatively uncommon form of supraventricular tachycardia (SVT) encountered in the electrophysiology laboratory in adults, accounting for no more than 15% of studies performed for management of SVT.1 While reports differ, FAT appears to be equally present in men and women and to be overrepresented in younger patients.2,3 The single most common location for FAT is the crista terminalis. Tachycardias arising from the CT show a particular preponderance in women and are relatively more likely to arise in older patients.
Patients may present with specific symptoms of variable severity that include palpitations, chest discomfort, dyspnea, fatigue, dizziness and syncope, with a first symptomatic event between the ages of 10 and 39 years in the majority.1 In a subset, the mode of presentation relates to the development of a tachycardia-mediated cardiomyopathy (TCM), reported in 10% in a single-center series of 345 patients with no preexisting structural heart disease.4
PATHOPHYSIOLOGY
FAT is characterized by an identifiable focal origin with subsequent centrifugal atrial activation, with a mechanism based in any of abnormal automaticity, triggered activity, or microreentry.2,5 Precise definition of the electrophysiological mechanism of a given FAT may be difficult because of overlapping features and is of less relevance in the ablation era.
FAT has been thought to arise in structurally normal atria. There is, however, evidence from surgical specimens of myocardial inflammation, infiltration, or fibrosis in almost 50% of cases,6 which may be reflected in areas of low voltage and electrogram fractionation on electroanatomic maps.
FAT in the absence of significant structural heart disease is recognized to cluster in particular anatomic locations (Figure 6-2). Characteristic locations in the right atrium include the tricuspid annulus, the right perinodal region, the ostium of the coronary sinus, and the trabeculated right atrial appendage, with the most common site of origin along the long axis of the CT.7,8 In the largest published series, 73% were found to have their origin in the right atrium, with 43% clustered along the CT. Of these 47% were located in the superior portion, 47% in the mid portion, and 6% in the inferior portion.
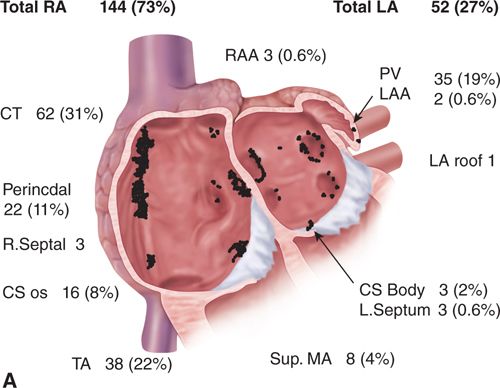
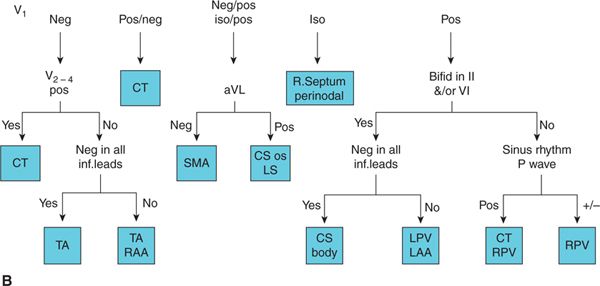
FIGURE 6-2 (A) Clustering of 196 FATs in 186 consecutive patients undergoing catheter ablation. A coronal section through the heart at the atrioventricular junction, with the atrioventricular valves removed. (CS = coronary sinus; CT = crista terminalis; LA = left atrium; LAA = left atrial appendage; MA = mitral annulus; PV = pulmonary vein; RA = right atrium; RAA = right atrial appendage; TA = tricuspid annulus.). (B) A P-wave algorithm using the anterior precordial leads, lead aVL, the inferior leads, and any change in the V1 P wave between tachycardia and sinus rhythm. When tested prospectively, this algorithm correctly located the focus in 93% of cases.
DIAGNOSIS
Stay updated, free articles. Join our Telegram channel

Full access? Get Clinical Tree


