Assessment of Tests

CHAPTER 21 Assessment of Tests


We use measures of accuracy to determine the reliability of a test result. This information comes from studying a sample from a population of individuals defined by inclusion and exclusion criteria. For instance, people often present to the health care system with symptoms of chest pain. If we excluded those younger than age 18 and studied a sample of these folks by giving each of them two tests—the definitive Reference Standard and the test under consideration—we would know how accurate the test is by comparing it to the results of the Reference Standard.


Either the individual has the Disease (D) or is Normal (N). Only the Reference Standard can precisely tell us that. This test is the most reliable in distinguishing D from N, but is often invasive and expensive. Because of this, it is not the first test to perform. When we see patients, we do not know whether they are D or N. Sometimes we can rely solely on symptoms and signs to arrive at a diagnosis; for example, a patient with symptoms and signs of uncomplicated gastritis can often be treated medically without exposure to further testing. In other cases, however, we want to be more assured of the diagnosis, especially if the treatment is expensive, extended, or has significant side effects.


The tests we use will either be positive (+) or negative (−). Not all subjects who test + will have D, and not all those who test − will be Normal. There will be false positives and false negatives, but an accurate test will have minimal false results. The following 2 × 2 table shows how subjects with D and N could be distributed among those being tested.


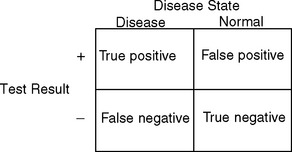
SENSITIVITY AND SPECIFICITY


Sensitivity is the probability that someone with D will test positive. It is the number of true positives divided by all those with D, which includes not only those who are D and test positive (the true positives) but also those who are D and test negative (the false negatives). Notice that sensitivity is only concerned with those in the D column of the above table.


The formula for sensitivity is:


image


Specificity, on the other hand, is the probability that someone who is N will test negative. It is the number of true negatives divided by all those who are N, which includes both true negatives and false positives. Specificity is concerned with only those in the N column.


The formula for specificity is:


image


One way to understand sensitivity and specificity is to split the columns, as in the following table, because those with the disease do not overlap with the normal individuals.


The concepts of sensitivity and specificity are counterintuitive because patients do not present with a sign that identifies them as either D or N, but they can undergo testing that places them in either the positive or negative row. As we will see, positive and negative predictive values may be more useful when deciding whether or not a patient has a disease based on the test results.


It is interesting that these tests rule disease in or out through a circuitous process. A highly sensitive test will approach 100% sensitivity. This means the value of the numerator will be very close to that of the denominator. This, in turn, means the number of false negatives will be very low. Compared to all the negative results, then, a negative test will be believable. A negative result will reliably indicate someone who is N. For a test with a high sensitivity, a negative result rules the disease out.


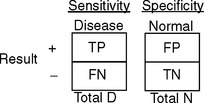
SnNOut: high Sensitivity, Negative test rules it Out.


2


On the other hand, a highly specific test will not have many false positives, and those who do test positive are likely to be true positives, or Ds. For a highly specific test with a positive result, the individual is likely to have the disease.


SpPIn: high Specificity, Positive test rules it In.


2


If you remember SnNOut and SpPIn, you will be able to apply these tests in the appropriate settings. When considering the sensitivity and specificity of a test, always ask yourself “What is the Reference Standard that the test was compared to?” (keeping in mind that some Reference Standard tests may not be 100% accurate). Also note the population that was studied when the sensitivity and specificity of the test were being determined. Individuals were found to be either N or D by the Reference Standard, but they all had to meet the same inclusion and exclusion criteria to be considered in the comparison. Certain populations with risk factors for the disease will have an increased proportion of D, which can result in an exaggerated ability of the test to pick up those cases.


BOX 21-1


The Shepherd Story


Sensitivity and specificity are easier to understand if we use a metaphor. Think of two types of shepherds, each caring over a flock of Domestic animals (D) such as sheep. Each wants to build a fence around his flock to ensure that they are fed. The problem is that there are some Native animals (N), such as mice, rabbits, foxes, raccoons, etc., that are mixed in with the sheep (D). For this metaphor, consider anything inside the fence to be a + result. Anything outside the fence is aresult. The true positives will be sheep (Ds) inside the fence and true negatives will be native animals (Ns) outside the fence. A false positive will be an N inside the fence and a false negative will be represented by a D outside the fence.


A highly SENSITIVE shepherd is gENerous. He wants to be sure each of his flock D is well fed. He knows that he can build an enclosure to include each D, but he will include a few Ns as well since these are mixed in with the Ds. He also knows that anything outside the fence will definitely be an N. Connect the dashed lines to draw a fence around this flock, including all the Ds and excluding some of the Ns.


Stay updated, free articles. Join our Telegram channel

Jun 18, 2016 | Posted by in BIOCHEMISTRY | Comments Off on Assessment of Tests

Full access? Get Clinical Tree

Get Clinical Tree app for offline access