Nearly all carbonic acid in the body exists as carbon dioxide gas. Therefore, carbon dioxide is the acid form of the carbonic acid/bicarbonate buffer system. When hydrogen ions are released, the concentration of bicarbonate falls, and the concentration of carbon dioxide gas rises as the acid is buffered.
The Henderson-Hasselbalch equation for the carbonic acid/bicarbonate buffer system describes the mathematical relationship among pH, bicarbonate concentration in milliequivalents per liter, and partial pressure of carbon dioxide (pCO2), a measure of the concentration of carbon dioxide gas in fluid) in millimeters of mercury:
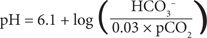
This equation demonstrates an important point: the ratio of the bicarbonate and carbon dioxide concentrations, not the absolute values, determines pH. The concentration of bicarbonate or carbon dioxide can change dramatically, but if the other value changes proportionately in the same direction, pH remains unchanged.
For arterial blood, the most commonly sampled medium, the normal ratio of bicarbonate (in milliequivalents per liter) to PaCO2 (in millimeters of mercury) is 0.6:1. This ratio results in a pH of 7.40 when the bicarbonate concentration is normal (24 mEq/L or 24 mmol/L) and the PaCO2 is normal (40 mm Hg or 5.3 kPa). It is impossible to predict the pH accurately or to assess a patient’s acid–base status from either the bicarbonate concentration or PaCO2 alone. If both are known, however, the pH can be calculated from this equation. In fact, when clinical laboratories evaluate ABGs, only the pH and PaCO2 are measured. The bicarbonate concentration is then calculated from this equation.
Role of Kidneys and Lungs
The kidneys regulate the concentration of bicarbonate in extracellular fluid, and the lungs regulate the PaCO2. An understanding of the functions of these organs is necessary to evaluate ABGs and acid–base status.
Kidneys
The principal role of the kidneys in maintaining acid–base homeostasis is to regulate the concentration of bicarbonate in the blood. Since bicarbonate is readily filtered at the glomerulus, the kidneys reabsorb filtered bicarbonate to prevent depletion. Approximately 90% of this reabsorption takes place in the proximal tubule and is catalyzed by carbonic anhydrase (Figure 9-1). Filtered bicarbonate combines with hydrogen ions secreted by the tubule cell to form carbonic acid. The enzyme carbonic anhydrase, located in the brush border of the tubule, catalyzes conversion of carbonic acid to carbon dioxide. The uncharged CO2 readily crosses the cell membrane and passively diffuses into the renal tubule cell. Inside the cell, carbonic acid and bicarbonate are reformed, also catalyzed by carbonic anhydrase. The bicarbonate is reabsorbed into capillary blood. The net result of this process is reabsorption of sodium and bicarbonate. Drugs that inhibit carbonic anhydrase (e.g., acetazolamide) can cause metabolic acidosis by inhibiting this process, causing excessive quantities of bicarbonate to be lost in the urine.
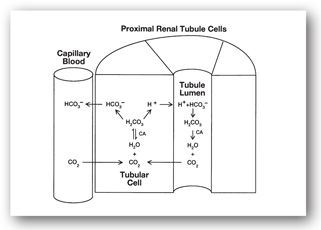
FIGURE 9-1. Reabsorption of bicarbonate from the proximal renal tubule cell.
The other major role of the kidneys, as discussed previously, is to excrete the 50–100 mEq/day of nonvolatile acids that are produced by the body. This process occurs primarily in the distal tubule and also requires carbonic anhydrase. The hydrogen ions that are secreted into the tubule lumen are buffered by phosphates and ammonia, so the urine pH is usually acidic but typically not less than 4.50.
Lungs
The principal role of the lungs in maintaining acid–base balance is to regulate the PaCO2. After blood returns from the tissues to the right side of the heart, it is pumped through the pulmonary artery to the lungs. In the capillaries, carbon dioxide readily diffuses from the blood into the alveoli of the lungs and is excreted in exhaled air.
The rate of carbon dioxide excretion is directly proportional to the rate of air passing into and out of the lungs. Under resting conditions, normal individuals take 14–18 breaths/min. The amount of air in each breath, known as the tidal volume, is about 500 mL. Ventilation can be increased by increasing either the rate of respiration or the tidal volume.
Chemoreceptors in the arteries and the medulla in the brain are capable of rapidly increasing or decreasing ventilation in response to changes in pH and the arterial partial pressures of oxygen (PaO2) and carbon dioxide (PaCO2). This ability allows rapid response to changes in acid–base status and is one reason that the carbonic acid/bicarbonate buffer system is physiologically important. An elevated PaCO2 is usually associated with hypoventilation, and a low PaCO2 is usually associated with hyperventilation.
The other major function of the lungs is to oxygenate the blood. Inspired oxygen diffuses from the alveoli into capillary blood and is bound to Hgb in red blood cells. The oxygen is carried throughout the body via the arterial system and is released to tissues for utilization. Oxygen in arterial blood is present in three forms:
- Oxygen gas (measured as PaO2)
- Dissolved oxygen
- Oxygen bound to Hgb (oxy-Hgb)
Over 90% of the total arterial oxygen content is as oxy-Hgb. As the oxygenated blood passes through the capillaries, dissolved and gaseous oxygen are taken up by tissues, and additional oxygen rapidly dissociates from Hgb and becomes available for tissue uptake.
Arterial Blood Gases
Arterial blood gas evaluations include measurements of the arterial pH, PaO2, and PaCO2. The bicarbonate concentration is calculated from the pH and PaCO2 using the equations listed previously. Proper evaluation of ABG results requires specific knowledge about each test.
Arterial pH
Normal range: 7.38–7.44
The pH of arterial blood is the first value to consider when using the ABGs to assess a patient’s acid–base status. As stated previously, pH values of 7.37 and lower represent acidemia, and pH values of 7.45 and higher represent alkalemia. When a patient’s acid–base status is evaluated, the patient must first be classified as having normal pH, acidemia, or alkalemia. It is important to recognize that a normal pH does not exclude the possibility of an acid–base disorder. Mixed acid–base disorders may result in a normal pH.
Critical values of pH are difficult to specify. More frequently, other manifestations of the underlying disorder producing the acid–base disturbance will dictate the urgency with which treatment must be initiated. For example, in sepsis syndrome with metabolic acidosis, the negative effects of infection and organ failure are typically more deleterious than the effect of low pH. Severe acidemia causes myocardial depression, hypotension, and impairs central nervous system (CNS) activity. Severe alkalemia impairs cerebral and coronary blood flow and causes respiratory depression. In general, pH values <7.20 or >7.60 represent levels that may require therapy to reverse these specific detrimental effects of the pH value.4
Spurious values of pH are most commonly due to inadvertent sampling of venous, rather than arterial blood. The pH of venous blood is slightly more acidic than arterial blood.
Arterial Partial Pressure of Carbon Dioxide
Normal range: 35–40 mm Hg or 4.7–5.3 kPa
Evaluation of the PaCO2 (commonly seen on lab reports as pCO2) provides information about the adequacy of lung function in excreting carbon dioxide, the acid form of the carbonic acid/bicarbonate buffer system. Because carbon dioxide is a small, uncharged molecule, it diffuses readily from pulmonary capillary blood into the alveoli in normal lungs. Therefore, an elevated PaCO2 usually implies inadequate ventilation.
It is the pH, not the absolute value of PaCO2 that determines the criticality of the patient’s situation. Like the pH, spurious values for PaCO2 are usually due to inadvertent venous sampling, which has a higher carbon dioxide content.
Arterial Partial Pressure of Oxygen
Normal range: 95–100 mm Hg or 12.7–13.3 kPa
Evaluation of the PaO2 (commonly seen on lab reports as pO2) provides information about the level of oxygenation of arterial blood. If effective circulation is achieved, a normal PaO2 generally means that oxygen delivery to tissues is adequate. PaO2 is commonly reduced in conjunction with an elevated PaCO2 in states associated with hypoventilation. In fact, the PaO2 is more likely to be diminished because carbon dioxide is much more freely diffusible across the pulmonary capillary and alveolar membranes. Therefore, diseases that impair gas exchange in the lungs can produce hypoxemia, which stimulates increased ventilation. Hyperventilation may fail to correct the hypoxemia but may produce a normal or low PaCO2.
Figure 9-2 shows the sigmoid relationship between the percentage of available oxygen-binding sites on Hgb that are occupied and the PaO2. The Hgb saturation remains above 90% as long as the PaO2 is above 60 mm Hg (8 kPa). Since most oxygen in arterial blood is present as oxy-Hgb, oxygen delivery to tissues generally remains adequate even though the PaO2 drops to as low as 60 mm Hg. However, PaO2 values less than 60 mm Hg are associated with rapid falls in Hgb saturation and dramatic decreases in oxygen delivery to tissues.
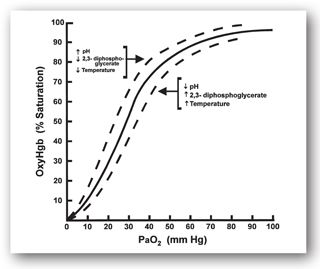
FIGURE 9-2. Oxygen–Hgb dissociation curve.
This relationship is important to remember because ABGs measure PaO2. Even though PaO2 values between 60 mm Hg (8 kPa) and normal (95–100 mm Hg or 12.7–13.3 kPa) indicate that a disease process is present, oxygen therapy may not be urgently needed since Hgb saturation is still above 90%. However, PaO2 values less than 60 mm Hg indicate a more significant reduction in Hgb saturation and impaired tissue oxygen delivery. This impairment may require rapid supplemental oxygen therapy. The atmosphere contains 21% oxygen, and increasing this concentration with supplemental oxygen therapy frequently reverses hypoxemia. Oxygen is administered by increasing the fraction of inspired oxygen (FiO2) from 24% to 100%.
Spuriously low values of PaO2 are seen with inadvertent venous blood samples or when the arterial blood sample is not stored in ice before the test is run. If kept at room temperature, cellular metabolism results in significant oxygen consumption, lowering the PaO2 value. Conversely, air bubbles in the syringe may result in oxygen diffusion into the sample, spuriously raising the PaO2 value.
Several conditions can alter oxygen–Hgb dissociation. Acidosis, fever, and increased concentrations of 2,3-diphosphoglycerate (2,3-DPG) shift the curve in Figure 9-2 to the right, making oxygen more readily available for delivery to tissues. Alkalosis and decreased 2,3-DPG concentrations shift the curve to the left, increasing oxygen binding to Hgb and potentially reducing oxygen delivery to tissues.
Arterial Serum Bicarbonate
Normal range: 19–24 mEq/L or 19–24 mmol/L
Once the PaCO2 and pH are measured, the bicarbonate concentration is calculated and reported with the ABG results. Either the bicarbonate from the ABG determination or the total carbon dioxide content of serum (discussed below) can be used to assess acid–base disorders.
Other Tests to Assess Acid–base Balance and Oxygenation
Venous Total Carbon Dioxide (Serum Bicarbonate)
Normal range: 24–30 mEq/L or 24–30 mmol/L
The total carbon dioxide concentration is frequently determined by acidifying serum to convert all of the bicarbonate present in the sample to carbon dioxide. However, since 95% of total serum carbon dioxide consists of converted bicarbonate, this value is actually a measure of the bicarbonate concentration. The total carbon dioxide content typically can be expected to be 0–2 mEq/L higher than the bicarbonate concentration. Therefore, the term serum bicarbonate is used interchangeably with total carbon dioxide, even though clinical laboratories may report the test with the more precise term total carbon dioxide. Although the name total carbon dioxide implies that it is a measure of acid, it is important to recognize that this test represents bicarbonate, the base form of the carbonic acid/bicarbonate buffer system. Like the PaCO2 test, the urgency of need for response to abnormal total carbon dioxide values is determined by the pH.
Anion Gap
Normal range: 3–16 mEq/L or 3–16 mmol/L
The anion gap is a calculated value that is helpful in categorizing and evaluating possible causes of metabolic acidosis.5,6 For the body to remain electrically neutral, the numbers of all positively and negatively charged ions must be equal. However, clinical laboratories do not routinely measure all ions. Many positively charged ions (e.g., sodium, potassium, calcium, and magnesium) are measured. Sodium (Na+) typically accounts for the majority of cations in extracellular fluids. Some anions (e.g., chloride, bicarbonate, and phosphate) are routinely measured, but others (e.g., sulfate, lactate, and pyruvate) are not. Serum proteins are also sources of negative charges that are difficult to quantify.
The number of unmeasured anions normally exceeds the number of unmeasured cations. When this difference is increased above the upper limit of normal, it often reflects an increase in negatively charged, weak acids. The presence of an increased anion gap in conjunction with metabolic acidosis provides the clinician with useful information about possible causes of acidosis. By convention, the anion gap is calculated using sodium to approximate the measured cations, and chloride (Cl–) and bicarbonate to approximate the measured anions:
anion gap = Na+ – (Cl– + HCO3–)
In conditions that cause metabolic acidosis either by production of hydrochloric acid (HCl) or by excessive loss of bicarbonate, which the kidneys primarily replace with chloride, the anion gap remains normal. The normal anion gap exists in these disorders because chloride anions replace bicarbonate, and both values are included in the calculation of the anion gap. These conditions are termed hyperchloremic or normal anion gap metabolic acidosis.
In other conditions, organic acids are formed that dissociate into unmeasured anions. In diabetic ketoacidosis, lipid catabolism produces the ketone bodies beta-hydroxybutyrate and acetoacetate. In methanol intoxication, methanol is metabolized to formic acid, which dissociates to produce formate and hydrogen ions. The anions beta-hydroxybutyrate, acetoacetate, and formate are not measured in routine electrolyte panels and are not included in the calculation of the anion gap. They produce acidemia, a decrease in serum bicarbonate as this buffer is consumed, and an increase in the calculated anion gap. These conditions are examples of elevated anion gap metabolic acidosis. The presence of an elevated anion gap in any patient is highly suggestive of a metabolic acidosis.
The normal value for the anion gap can vary based on the clinical chemistry methodologies for measuring chloride ions. The normal value at most institutions will be in the range of 3–16 mEq/L (3–16 mmol/L). However, this range may vary due to the variability in normal ranges of the values used to calculate anion gap. Clinicians should verify the normal range for anion gap at their institutions.
Various factors can alter the anion gap, making interpretation more difficult.6,7 In particular, hypoalbuminemia, hyperlipidemia, lithium intoxication, and multiple myeloma decrease the anion gap. Albumin is one principal source of unmeasured anions, so hypoalbuminemia decreases unmeasured anions and the anion gap. Hyperlipidemia reduces the anion gap both by occupying space in the plasma volume and by interfering with the laboratory assay for chloride. Lithium is a positively charged ion not included in the anion gap calculation. In cases of intoxication, it can decrease the anion gap. Multiple myeloma produces positively charged proteins and reduces the anion gap by increasing unmeasured cations.
The anion gap can also be altered by many electrolyte abnormalities. In particular, abnormalities involving ions not included in the calculation of the anion gap (e.g., potassium and calcium) can affect the anion gap. Therefore, the anion gap must always be interpreted cautiously.
Serum Lactate
Normal ranges: 0.6–2.2 mEq/L or 0.6–2.2 mmol/L (venous) and 0.3–0.8 mEq/L or 0.3–0.8 mmol/L (arterial)
Lactate is a byproduct of the anaerobic metabolism of glucose as an energy source.8 Metabolism of glucose yields pyruvate, which can be converted to lactate in a reaction catalyzed by lactate dehydrogenase (LDH) (Figure 9-3). Lactate is transported to the liver and converted back to pyruvate.
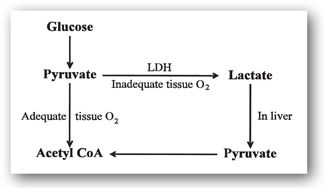
FIGURE 9-3. Lactate metabolism.
When tissues are normally oxygenated, pyruvate is converted to acetyl coenzyme A (acetyl CoA) and is utilized as an energy source via aerobic metabolism. In patients with inadequate tissue perfusion (e.g., septic shock) or increased tissue metabolic rates (e.g., status epilepticus), anaerobic metabolism predominates. Anaerobic metabolism increases the conversion of pyruvate to lactate, increasing lactate concentrations. When inadequate tissue perfusion is present, lactate is not transported to the liver, further increasing lactate concentrations. If these processes are severe or not reversed, lactic acidosis (a type of metabolic acidosis) can occur. Drugs or other conditions that impair lactate or pyruvate metabolism can also produce elevated lactate concentrations. Lactate levels above 4 mEq/L are usually associated with critical illness and require urgent treatment.
Venous Partial Pressure of Oxygen
Normal range: 70 mm Hg or 9.3 kPa
It has been recognized for many years that in critically ill patients or during cardiopulmonary resuscitation, venous blood gases may provide a more accurate measure of the adequacy of tissue oxygenation than ABGs. In particular, the venous partial pressure of oxygen has been suggested as a test that better reflects tissue oxygenation. This is because the amount of oxygen remaining in venous blood after passing through the tissues reflects both oxygen delivery (DO2) and oxygen consumption (VO2). When venous partial pressure of oxygen is measured in pulmonary arterial blood, which reflects mixed venous blood from all tissues in the body, it is termed mixed venous oxygen (SvO2). The normal value for SvO2 is 70 mm Hg. Values below this indicate that tissues are extracting an unusually large fraction of the delivered oxygen, and that increasing oxygen delivery or reducing tissue metabolic activity may be indicated. In particular, treatment of low SvO2 values early in the management of patients with severe sepsis has been shown to improve mortality, and has been accepted as a standard of care for this patient population.9
Oxygen Saturation by Pulse Oximetry
Normal range: >94%
As an alternative to PaO2 values obtained with ABGs, measuring the oxygen-Hgb saturation with pulse oximetry can also assess the level of oxygenation.10 Pulse oximetry is based on the principle that oxy-Hgb molecules absorb different amounts of light than nonoxygenated Hgb. In pulse oximetry a probe is placed on the finger or earlobe. Light of specific wavelength is transmitted through the tissues, and the light intensity is measured on the opposite side of the tissue. The amount of light absorption is proportional to the relative amounts of oxy-Hgb and Hgb present in arterial blood. The instrument calculates oxygen saturation from this ratio. This method is commonly used when frequent, noninvasive monitoring of oxygenation is needed (e.g., for patients receiving intravenous midazolam or opiates to provide moderate sedation for invasive procedures). Pulse oximetry provides a continuous estimate of oxygen saturation without the need for frequent arterial blood sampling. It is important to remember that the PaO2 can fall dramatically, and the oxygen saturation will stay above 90%. Significant impairment of oxygenation may occur with minimal change in oxygen saturation. The results of pulse oximetry must be interpreted with this understanding.
Several factors can interfere with the accuracy of pulse oximetry. Presence of large amounts of carboxyhemoglobin (CO-Hgb), seen in heavy smokers and in carbon monoxide poisoning, falsely increases the estimated oxygen saturation. Hyperbilirubinemia also produces CO-Hgb and can falsely increase the oxygen saturation measured by pulse oximetry. Methemoglobinemia, often produced due to exposure to oxidizing substances, can produce false elevations or decreases in pulse oximetry measurements. Methylene blue produces significant decreases in the estimated oxygen saturation as measured by pulse oximetry. Physical factors such as excessive motion, skin pigmentation, and nail polish can affect the pulse oximetry measurement. Finally, hypoperfusion or use of potent vasoconstrictors can interfere with the pulse oximetry reading.
BASIC PRINCIPLES IN ACID–BASE ASSESSMENT
Table 9-1 summarizes the expected laboratory results in the four simple acid–base disorders. For each disorder, the primary laboratory abnormality is accompanied by a compensatory change. For example, the primary abnormality in metabolic acidosis is a fall in serum bicarbonate, and the compensatory change is a fall in PaCO2. These compensatory changes reflect the body’s attempts to return the bicarbonate/carbon dioxide ratio and pH closer to the normal range.
aArrows signify direction and relative magnitude of change from normal values of PaCO2 (40 mm Hg) and venous HCO3– (24 mEq/L). Total carbon dioxide may be used in place of bicarbonate using a value of 24 as normal.
bNormal compensation can vary by approximately ±10% from calculated values.
An important principle in interpreting these laboratory tests is to recognize that the body never overcompensates and rarely completely compensates for an acid–base disorder. The only exception is chronic respiratory alkalosis in which the kidneys can completely compensate. Therefore, the pH and direction of change from normal of the PaCO2 and serum bicarbonate generally can be used to classify simple acid–base disorders.
Although respiratory compensation for metabolic acid–base disorders occurs within minutes to hours because the lungs can alter carbon dioxide excretion rapidly, renal compensation for respiratory disorders is slower. Acute respiratory acidosis and alkalosis are associated with minimal compensation (Table 9-1). Tissue buffers (e.g., protein and Hgb) are responsible for this compensation. Renal compensation, accomplished by altering the bicarbonate excretion, requires 6–12 hours to be initiated and is not complete for 3–5 days.
Pharmacists should use a standard, stepwise method to assess patients’ acid–base status. Table 9-1 can be used as a guide to acid–base evaluation.
- Evaluate the pH from the ABGs. As noted earlier, a pH of 7.35 or lower is acidemia and 7.45 or higher is alkalemia. In acidemia, at least one simple acidosis must be present and in alkalemia at least one alkalosis must be present. A normal pH does not mean that acid–base status is normal; complete evaluation is still required.
- Evaluate the total carbon dioxide (serum bicarbonate) and PaCO2 values. In patients with acidemia, a low bicarbonate suggests metabolic acidosis, and an elevated PaCO2 suggests respiratory acidosis. Evaluation of Table 9-1 will demonstrate that all four simple acid–base disorders are associated with a unique pattern of alteration of total carbon dioxide and PaCO2. In patients with normal pH, bicarbonate or PaCO2 levels outside the normal range suggest that an acid–base disorder may be present. In particular, this situation suggests that an acidosis and alkalosis may both be present.
- Evaluate the degree of compensation. Normal levels of compensation are within 10% of the estimates noted in Table 9-1. For example, in an alkalemic patient with an elevated serum bicarbonate of 32 mEq/L (consistent with metabolic alkalosis), the bicarbonate is 8 mEq/L above normal. Normal compensation is for the PaCO2 to rise by 4–6 mmHg, to a value of 44–46 mmHg (0.6 × 8 plus/minus 10%, rounded to the nearest mmHg).
- Assess causes of abnormal levels of compensation. A level of compensation outside of the expected range suggests that a mixed acid–base disorder may be present. Compensatory changes less than expected for a simple acid–base disorder suggests a mixed acid–base disorder of the same type; either combined metabolic and respiratory acidosis or combined metabolic and respiratory alkalosis. A level of compensation greater than expected suggests that a form of acidosis and alkalosis may both be present.
The formulas listed in Table 9-1 for normal levels of compensation are estimates only; variability exists in the normal response. In addition, use of total carbon dioxide to estimate serum bicarbonate may slightly alter the expected value. In patients with metabolic acidosis, comparing the decrease in serum bicarbonate with the increase in the anion gap is useful. If the anion gap is elevated but not to the same degree that the bicarbonate has fallen, a combination of anion gap and hyperchloremic metabolic acidosis, caused by two underlying disorders, may be present.
In the case of renal compensation for respiratory acid–base disorders, values intermediate between acute and chronic compensation may indicate either that a mixed disorder is present or that adequate time for compensation has not elapsed. Information from the patient’s history and physical examination, including temporal relationships, must be assessed to help evaluate the laboratory data. The minicases and discussions that follow build on this overview to demonstrate evaluation of patients with acid–base disorders.
Metabolic Acidosis
Patients with metabolic acidosis display an arterial pH less than 7.36 (acidemia) and a low serum bicarbonate concentration, determined either with ABGs or as the total carbon dioxide concentration on the serum chemistry panel. Under most circumstances, the body compensates by hyperventilating to increase carbon dioxide excretion, resulting in a low PaCO2 value (Table 9-1).
Common causes of metabolic acidosis are listed in Table 9-2. Once metabolic acidosis is diagnosed, the next step in patient assessment is calculation of the anion gap. This step helps to determine the cause of the acidosis. As shown in Table 9-2, some causes of metabolic acidosis typically produce an increased anion gap, while others produce a normal gap. With a normal anion gap, the serum chloride is elevated, producing a hyperchloremic metabolic acidosis.
Several drugs can cause metabolic acidosis and are listed in Table 9-2. Several of the nucleoside reverse-transcriptase inhibitors used to treat human immunodeficiency virus (HIV) infection have been reported to cause lactic acidosis.11,20 Propofol has been reported to cause metabolic acidosis as a component of what has been described as propofol infusion syndrome. This syndrome was initially reported primarily in critically ill pediatric patients, but has now been reported in critically ill adults. The syndrome typically appears with higher doses of propofol when used for ICU sedation for a prolonged period of time.12,13,20 Prolonged, high dose infusion of intravenous lorazepam, which contains propylene glycol, has also been reported to cause lactic acidosis in critically ill patients.14 Many other drugs have also been reported to cause metabolic acidosis, although the frequency and strength of association are lower. In addition, metabolic acidosis may appear as one complication of drug-induced acute tubular necrosis or acute renal failure. A complete review of the patient’s medication list is required to rule out potential drug-induced causes.
A Patient With Diarrhea
ROBERT W., A 66-YEAR-OLD MALE, has been hospitalized for the past 2 weeks following a triple coronary artery bypass graft surgery. His hospital stay was complicated by the development of ventilator associated pneumonia 7 days ago, which required broad spectrum antibiotics. For the past 48 hours, he has been having high temperatures and a significant amount of stool output. His most recent stool sample has tested positive for C. difficile toxin. Current laboratory data include sodium 137 mEq/L (136–142 mEq/L), potassium 3.6 mEq/L (3.8–5.0 mEq/L), chloride 115 mEq/L (95–103 mEq/L), SCr 1.5 mg/dL (0.6–1.2 mg/dL), total carbon dioxide 14 mEq/L (24–30 mEq/L) and white blood cell count 15,000 cells/mm3 (4400–11,000 cells/mm3). Arterial blood gases were pH 7.30 (7.38–7.44), PaCO2 28 mm Hg (35–40 mm Hg), PaO2 100 mm Hg (95–100 mm Hg), and serum bicarbonate 14 mEq/L (24–30 mEq/L).
Question: What acid–base disorder does Robert W. exhibit? What is his anion gap? What is the cause of his acid–base disorder?
Discussion: Robert W.’s pH of 7.30 is clearly in the acidemic range. Further evaluation of the ABGs reveals a low bicarbonate value, suggesting metabolic acidosis. The low PaCO2 value, representing respiratory compensation, confirms this assessment. The level of respiratory compensation is consistent with the expected degree of compensation described in Table 9-1. The bicarbonate value has fallen by approximately 10 mEq/L from a normal value of 24 mEq/L, and the PaCO2 has been reduced by 12 (1.2 × 10 mEq/L, as predicted in Table 9-1) to 28 mm Hg from the normal of 40 mm Hg. These values suggest that Robert W. has only metabolic acidosis and not a mixed acid–base disorder.
The importance of compensation for acid–base disorders can be appreciated by calculating the expected pH in Robert W. if respiratory compensation had not occurred. If the PaCO2 had stayed at 40 mm Hg with a serum bicarbonate of 14 mEq/L, the pH would be 7.16 (Henderson-Hasselbalch equation).
Robert W.’s anion gap of 8 mEq/L (137 – [115 + 14]) is normal, allowing classification of the disorder as a metabolic acidosis with normal anion gap. The most likely cause is diarrhea (Table 9-2), as suggested by his recent development of C. difficile-induced diarrhea.
Stay updated, free articles. Join our Telegram channel

Full access? Get Clinical Tree


