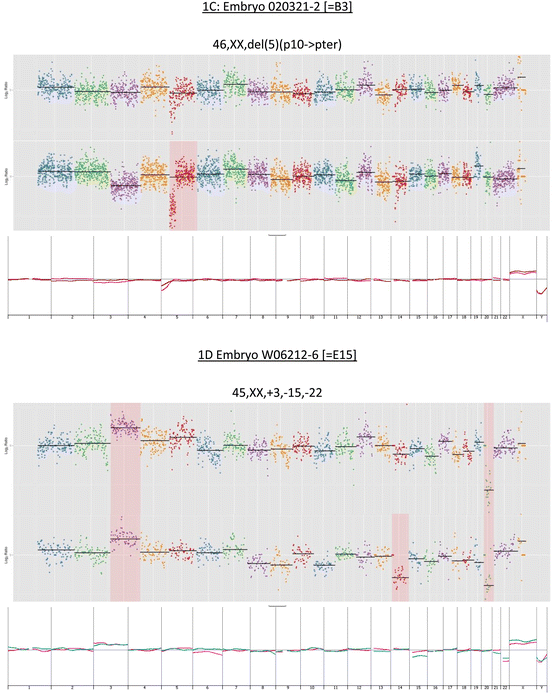
Fig. 12.1
(a–d) Upper panel in each section shows chromosome profiles determined by partial genome sequencing. The lower panel in each section shows overlaid array CGH profile
Partial Genome Sequencing: Low Depth Sequencing
A second aliquot of WGA product from 50 of the initial samples (two samples from each embryo) was used for sequencing using the Ion Torrent Personal Genome Machine (PGM) system (Life Technologies, Melbourne, Australia). WGA from each biopsy piece produced a range of long amplicon products that were then fragmented (Ion Xpress Plus Fragment Library Kit, Life Technologies) to yield blunt-ended DNA fragments of c. 250 base pairs. Fragments were then ‘library prepared’ (Ion Plus Fragment Library Kit, Life Technologies) and indexed using Ion Torrent barcodes (Ion Xpress Barcodes 1-48, Life Technologies). Template preparation was carried out using the OneTouch System (Ion OneTouch 200 Template Kit, Life Technologies) and sequenced using the 200 base read kit (Ion Xpress 200 Sequencing Kit, Life Technologies).
We analysed the initial data using the standard software supplied with the Ion Torrent Suite 3.2 PGM sequencer. The cumulative sequence reads for individual chromosomes were plotted (Fig. 12.2). Each autosome chromosome cumulative score was obtained from the Ion Torrent Suite output and characterised as a simple fraction of the total autosome read from that biopsy piece. Mean reads and standard deviations (SDs) for each chromosome from each run were calculated (with the previous array-identified abnormal chromosomes being excluded from individual chromosome normal range calculations) and a Z-score table was generated. The Ion Torrent sequencing data and the reads obtained are presented in Table 12.1. These preliminary analyses on their own were found to be adequate for simple chromosome aneuploidy assessment for clinical diagnostic purposes but were insufficient for some segmental losses (and presumably gains). Therefore, we devised and applied further algorithms.
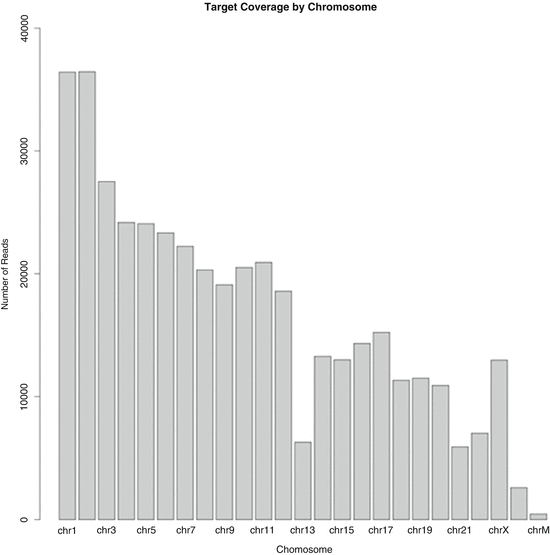
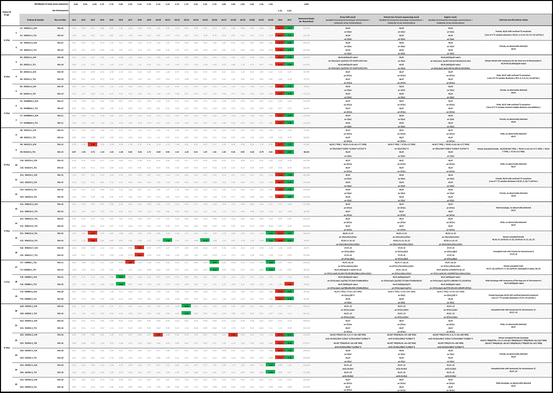

Fig. 12.2
Preliminary chromosome coverage output (Ion Torrent Suite 3.2) for the inner cell mass of embryo G20. Partial sequencing reads are arranged in conventional order of chromosome number (1–22), followed by the sex chromosomes (X and Y) and mitochondrial chromosome (chrM). There is monosomy of chromosome 13
Table 12.1
Partial genome sequencing Z-score table. Significant deviations from the population means derived from normal chromosomes shown in red (>3 STD above the mean) and green (>3 STD above the mean) boxes. Karyotypes and array outputs accord with 2013 International Standing Committee on Human Cytogenetic Nomenclature recommendations [44].

SeqVar Algorithm
Our SeqVar algorithm set was adapted from an open-sourced algorithm [34] that calculates the Poisson probability of difference between two samples of a number of mapped reads in small windows that tile each chromosome. SeqVar thus detects significant over- and under-representation of mapped reads of the sample under test compared to the control sample and adjusts for global variation between the test and control samples across all chromosomes using Poisson distribution. The software output includes visual plots of segmental gains and losses respectively above and below a threshold value on any chromosome and marks the chromosome when the difference is significant (Fig. 12.3).
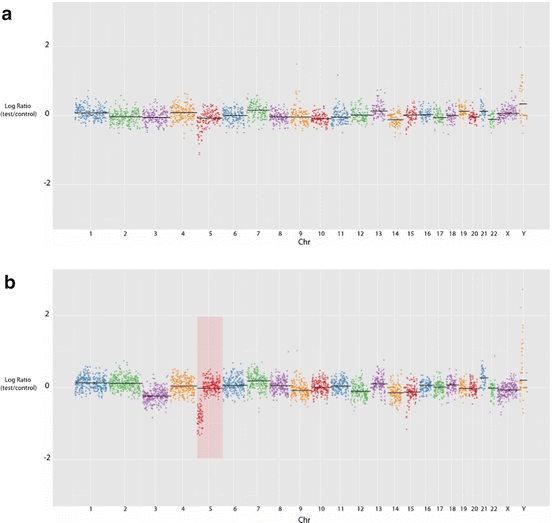

Fig. 12.3
SeqVar output indicating a segmental deletion at 5p in two samples from embryo B3. (a) At a total genome coverage of c. 245,000 reads, (b) at c. 400,000 reads. PGS methodology readily permits increasing the resolution in additional examinations of remaining extant sample to clarify areas of ambiguity or concern
Detection and Display of Segmental Variations
The procedure for detecting segmental variations involves two steps:
1.
Aligning the reads to the February 2009 human genome reference sequence GRCh37/hg19. A higher number of reads mapped to the genome increases the statistical power of variation calls and enables the detection of smaller deletions. The 3-stage Ion Torrent Mapping Alignment Program was used to align the sequence and to filter putative sequencing errors. This was able to align an average of 91–193 % of sequencing reads that passed the Torrent Quality Control step.
2.
Detecting segmental variations from the mapped reads. Our approach employs a sliding window (of varying size depending on the total number of mapped reads) across the entire genome using the Poisson distribution for subsequent calculation. In each window, the number of reads counted that mapped to the input sample and a normal reference sample were used to calculate the probability that any difference between the input and reference samples is statistically significant. Because the Y-chromosome (chrY) is small, the number of reads that map to it can vary materially between samples. Within each sample, however, the ratio between the number of reads that map to chrY and the total number of mapped reads is reasonably consistent: for male samples, median ratio Y/Total = 5.7 × 10⁻³, ±SD = 4 × 10⁻⁴; for female samples, median = 1.6 × 10⁻³, ±SD = 3 × 10⁻⁴. To further reduce false-positive chrY calls, the SeqVar detection algorithm checks this ratio before calling a copy number variation on chromosomes X and Y.
In the absence of an accepted nomenclature for sequence-derived karyotyping, comparable results for aCGH and PGS are given here principally in the familiar banded-chromosome nomenclature of classical cytogenetics. Chromosome-mapping outputs obtained from sampling across the genome are based on relative imbalances in DNA copy number for both CGH and PGS, however, and produce visibly comparable chromosome-based displays. The current international nomenclature for reporting virtual karyotypes from arrays can therefore be provided in addition to the banded-chromosome-based terminology.
Results
Among the 25 available embryos from the seven patients (average age = 34.4, range = 29–40 year), we observed an effective euploidy rate of 15/25 (60 %), a prevalence comparable to that reported for blastocysts from similar age cohorts by other authors [31, 32, 34, 35]. Control normal and abnormal karyotypes obtained by array CGH are illustrated in Fig. 12.1a–d. The median number of embryos per patient was 3 (range = 2–6). Of the 25 embryos, 11 were uniformly normal. Seven embryos were uniformly aneuploid and three embryos that displayed mosaicism across TE and ICM were also considered abnormal.
Four embryos revealed one or more mosaic aneuploidies confined to TE, a phenomenon that (a) generally indicates isolated mitotic aneuploidy generally arising from anaphase lag during rapid cleavage [15, 36]; (b) is usually overlooked clinically when, at the earlier, 8-cell-or-earlier stage, only one cell is sampled for preimplantation testing; or (c) through divisional disadvantage is ordinarily followed by cell-line dilution and extinction [37], or lingering low-level placental mosaicism of uncommon clinical importance [38]. Alternatively, discrete cell analysis of a multicellular TE biopsy (as occurs with FISH), by revealing occasional aneuploid cells, can be over-responded to if it is elected not to transfer the blastocyst on this basis [14].
Initial sequence data were obtained using software supplied with the Ion Torrent Suite 3.2 (Fig. 12.2). Individual partial genome sequence results for each sample were de-convoluted for each chromosome and scored. Total sequence reads per chromosome for each embryo were converted to a fraction of the total sequence reads for the autosomes from that embryo and a Z-score table was constructed (Table 12.1). Most analyses were performed with c. 40,000–c. 250,000 such hits per sample. The fractional reads per chromosome were then used to calculate a fraction mean and the standard deviation of the fraction mean. A score greater than 3 standard deviations (SDs) above or below the population mean for the particular chromosome was considered a necessary and sufficient deviation to indicate highly probable aneuploidy (trisomy or monosomy, respectively). In cases of doubt (Fig. 12.3), the already amplified DNA was tested again at resolutions up to c. 800,000 hits. All aneuploidies identified on array CGH were confirmed by NGS, with typical individual array-based aneuploid ascertained chromosome fraction scores appearing 4–8 SDs away from the fraction mean.
The log2 ratio between the human genome reference sequence and the ‘test’ sequence in the SeqVar methodology led to identification of every loss and gain detected by aCGH. On aCGH, two blastocysts (8 %) showed an intrachromosomal segmental aneuploidy with a uniform loss of a substantial part of one chromosome: one case of loss of 5p and one case of loss of 6q14-tel; a similar segmental aneuploidy prevalence among blastocysts has been reported by others [32]. Mean hit analysis using SeqVar readily detected the significant proportional deviation for the 6q deletion analysis, but the 5p loss was equivocal at c. 245,000 reads; testing at increased resolution rendered this segmental aneuploidy obvious. As is the case with aCGH, NGS output plots were visually inspected for anomalies, paying particular attention to focal or segmental within-chromosome losses or gains that reach log2 ratios outside the range of −1.0 to +0.58 or −1.0. The Agilent CGH array employs a software-based centralization algorithm that balances overall gains and losses and renders the sample’s most common ploidy the new zero point—a step acknowledged to lead to erroneous calls for highly aberrant genomes (Agilent Genomic Workbench 7.0 handbook: CGH Interactive Analysis, p. 476). This step is not required with the Ion Torrent/SeqVar direct sequencing strategy, where limits are precisely predefined numerically prior to analysis.
Discussion
From a simple biological perspective, the unsuitability for transfer of any embryo that has significant chromosomal imbalance(s) is unquestioned. What has caught the attention of clinics throughout the world, however, is the relatively high level of aneuploidy amongst otherwise clinically suitable embryos as well the diverse nature of the chromosomes involved. The use of whole chromosome analysis methods is having a significant impact on the ability to identify and transfer genetically suitable embryos with subsequent implantation rates compared to their standard IVF patients nearly doubling in some clinics. The application and benefits of CGH are now receiving worldwide acknowledgement. The use of commercial microarrays has simplified the approach to total ploidy analysis and has permitted many laboratories to offer this service. However, the cost of array CGH can be prohibitive and potentially excludes an even wider uptake, at least in some countries around the world. New technologies such as NGS are now offering a different approach to the same solution of total chromosome analysis. Currently, we show the process timing for arrays and NGS is similar (see Fig. 12.4).
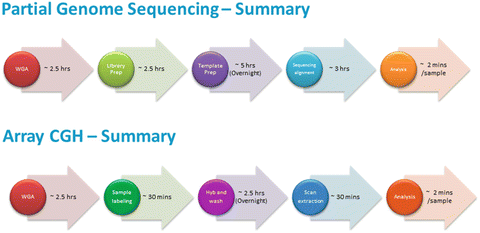

Fig. 12.4
Workflow schedule for partial genome sequencing and for aCGH sequencing and alignment timing is for low hit analysis. As resolution need is increased, then sequencing and alignment times increase to approximately 8 h
Employing massive parallel sequencing with an average of 8–12 million reads per sample of embryo trophectoderm, Yin and coworkers showed that next generation sequencing technologies can reveal aneuploidies and unbalanced chromosomal rearrangements; their methodology, however, required 10–17 days of lab time [33]—a time frame that while suitable for IVF/cryocycle transfer is not appropriate for fresh transfer. We report the similar use of NGS technology but using a reduced-representation (‘partial’) approach (see Simpson et al. [39] for a methodological review) to comprehensively study morphologically normal human IVF embryos with a sample of trophoblast and to disclose chromosomal aneuploidies utilising economically low numbers of reads across the genome. The methods employ commercially available NGS chips and equipment available to most IVF laboratories experienced with molecular genetic testing for preimplantation genetic diagnosis. Using different modes of analysis, NGS is also able to identify segmental chromosome losses as well as quantify, in an objective way, the relative abundance of individual chromosomes and so disclose mosaicism to various levels.
We show that complete karyotypes via NGS for biopsied blastocysts can also be available overnight, as is the case with microarrays based on CGH, the present standard [25], while potentially providing some useful advantages.
First, by electively increasing the number of hits per genome or chromosome, we can flexibly increase intrachromosomal resolution. For clinically infertile couples undergoing IVF, as few as 40,000 reads per whole genome enable reliable counting of whole chromosomes to avoid transferring grossly aneuploid embryos. A clinical need for higher levels of within-chromosomal resolution can become apparent during low-resolution screening sequencing (Fig. 12.3) or can be planned in advance for preimplantation genetic diagnosis in families with a known intrachromosomal segmental CNV or small segment reciprocal translocations. We show that 400,000 or more reads detect relatively small segmental losses within chromosomes and also may enable greater discernment of blastocyst mosaicism.
Stay updated, free articles. Join our Telegram channel

Full access? Get Clinical Tree


