Fig. 7.1
Far-UV (a) and near-UV (b) CD spectra of pilot-scale and full-scale drug substance lots in clinical and commercial formulations, respectively. Lots 1 and 2 are pilot-scale lots; Lots 3–10 are full-scale lots. Lots 10 and 10* are the reference material in full-scale/commercial and pilot-scale/clinical formulation, respectively (see Table 7.1)
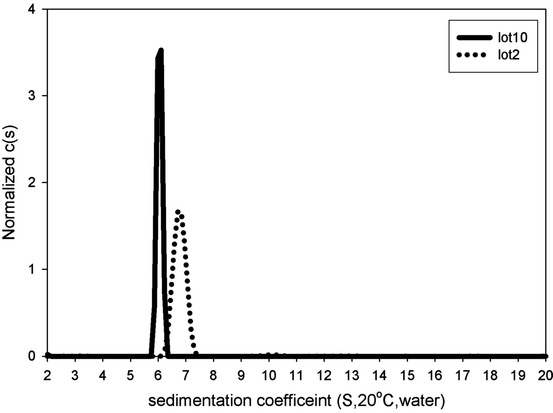
Fig. 7.3
AUC-SV profiles of a pilot-scale/clinical formulation lot (Lot 2) and a full-scale/commercial formulation lot (Lot 10)
To quantitatively evaluate the similarity between the CD spectra, the Similarity Match analysis implemented in TQ Analyst™ software (Thermo Scientific) was applied to both far-UV and near-UV CD spectra using the spectra of the reference material as the standards. The algorithm uses Gram–Schmidt orthogonalism to extract the spectral information from the standard spectra and subtracts that from the test spectra. The residual spectra are then evaluated for any spectral information for comparison. This application provides a single number for spectral comparison and supplements the qualitative visual assessment. The use of this commercial algorithm also eliminates tedious and error-prone spreadsheet calculations presented previously (Zou and Luo 2010). The calculated match values for the ten different lots versus the reference standard (Lot 10) are listed in Table 7.1; the difference between pilot-scale and full-scale lots is in agreement with the visual inspection. To establish a possible cut-off value for the spectral difference between “similar” and “dissimilar,” comparison among a series of spectra generated by heat denaturation was conducted (Fig. 7.4a, b). The spectra at the temperatures lower than the onset denaturation temperature (60°C) as determined by DSC (Fig. 7.5) are compared pair-wise using the similarity analysis. The resulting similarity match values are subject to the t-test at 95% confidence level to deduce the lower limit of the similarity match value used as the spectral similarity cut-off values (87.27% and 96.50% for far- and near-UV CD spectra, respectively). As shown in Table 7.1, only one lot (Lot 6) in the full-scale material is not similar to the reference standard in the far-UV CD analysis. However, there is no difference in its near-UV CD spectrum. Careful examination of the far-UV CD spectrum of this lot reveals a high level of noise in this data, and therefore, the spectrum does not have as good a signal to noise ratio, confounding the comparison to the other samples. However, the similarity analysis is sensitive enough to pick up small differences in the spectra and should serve as a good tool for comparability studies. Other type of data analyses such as data deconvolution for far-UV CD spectra can provide the estimate of relative abundance of different secondary structures (Sreerama and Woody 2000). However, it is judged to be not sufficiently sensitive to be used in comparability studies (Zou and Luo 2010).
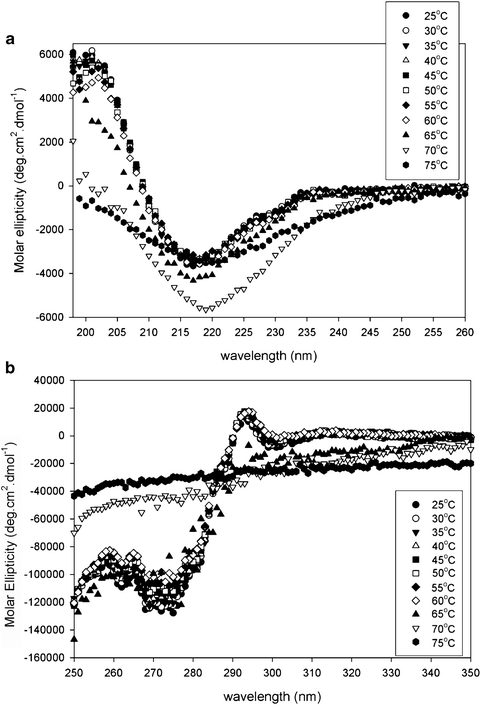
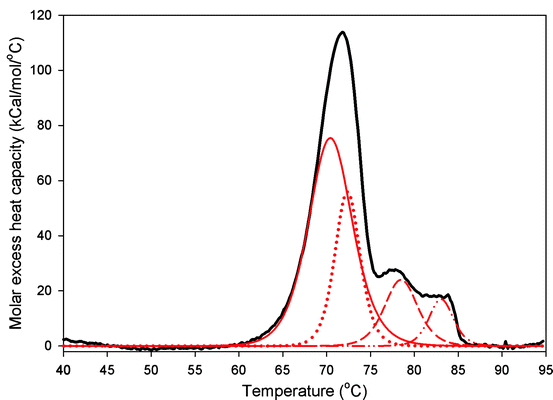
Table 7.1
Quantitative similarity analysis for pilot-scale and full-scale drug substance lots in clinical and commercial formulations, respectively
Lot # | Drug substance/formulation | Similarity match value for far UV CD (%) | Similarity match value for near UV CD (%) |
|---|---|---|---|
10 (reference standard) | Full-scale/commercial | 100 | 100 |
1 | Pilot-scale/clinical | 64.16 | 86.12 |
2 | Pilot-scale/clinical | 61.51 | 86.31 |
3 | Full-scale/commercial | 93.06 | 99.47 |
4 | Full-scale/commercial | 90.80 | 99.60 |
5 | Full-scale/commercial | 90.06 | 99.57 |
6 | Full-scale/commercial | 85.98a | 99.60 |
7 | Full-scale/commercial | 94.78 | 99.41 |
8 | Full-scale/commercial | 89.71 | 99.45 |
9 | Full-scale/commercial | 92.52 | 99.58 |
10* (reference standard in clinical formulation) | Pilot-scale/clinical | 58.88 | 87.30 |

Fig. 7.4
Far- (a) and near-UV (b) CD spectra of the IgG2 antibody at different temperatures

Fig. 7.5
The DSC thermogram of the reference standard (Lot 10). The traces are the fits from the non-two-state model are shown
A change in the higher-order structure of a biotherapeutic has potential to impact activity and stability. However, the structural perturbation could be reversible, in which case the risk to potency and safety would be greatly reduced. The reversibility of higher-order structural changes was demonstrated by transferring the full-scale reference material to pilot-scale formulation (Lot 10*) and comparing the far- and near-UV CD spectra to the original full-scale formulation (Fig. 7.1a, b). It is evident that changes in both secondary and tertiary structures are reversible, both by spectral overlay and similarity match analysis. The similarity values of Lot 10* are very different from Lot 10. However, a direct comparison between Lot 1 and Lot 10* showed a higher similarity value for far-UV CD spectra (92.22%) in contrast to the much lower similarity value between Lot 10 and Lot 10* (58.88%) (Table 7.1). For near-UV CD spectra, the similarity between Lot 1 and Lot 10* is 99.00% while that between Lot 10 and Lot 10* is 87.30%, much lower than the similarity limit (96.50%) obtained from the heat denaturation study. This formulation-related structural reversibility was consistent with the observation that the activity is not affected by the formulation change (data not shown).
7.2.3 Conclusions
An in-depth biophysical characterization with quantitative criteria enhances the utility of the comparability exercise. This not only provides information needed for product comparability but also helps to assess the impact of differences should they be observed during the comparability exercise.
7.3 Case Study 2: Self-Association and Aggregation of an Fc-Fusion Protein
Comprehensive characterization of a biotherapeutic before it goes into clinical trials and later for commercialization is an expectation from both the industry and regulatory bodies (Kozlowski and Swann 2006). The characterization of biotherapeutics can be generally divided into three areas: (1) biochemical characterization for primary sequence, chemical composition, and post-translational modification; (2) biophysical characterization for higher-order structure, association state in solution, and ligand-binding mechanism; and (3) biological characterization for in vitro activity, ex vivo potency, and mode of action. A thorough characterization effort provides essential knowledge needed for the development of analytical methods that are used to evaluate the critical quality attributes during manufacture. One of the critical quality attributes for biotherapeutics is the level and type of aggregates, which arise from intermolecular interactions and are potentially linked to immunogenicity. Size-exclusion chromatography (SEC) is the most common method to quantify aggregates, but the upper limit of size range is limited to approximately 50 nm. Thus, this technique can assess oligomers but misses the larger aggregates in the submicron and micron range (den Engelsman et al. 2011). Limitations of SEC in terms of accuracy and specificity, when evaluating aggregates, have been discussed elsewhere (Philo 2009; Carpenter et al. 2010). Orthogonal methods such as AUC and AFFFF are therefore recommended to supplement the SEC results.
The second case study presented in this chapter involves an Fc-fusion protein which showed significant aggregation during storage at accelerated and stressed conditions as measured by SEC. Application of AUC in two modes (sedimentation velocity and gravitational sweep) provided some interesting insights into the self-association behavior and impact of salt in the mobile phase for SEC.
7.3.1 Methods
The SEC analysis was performed using a TSKgel G3000SW column (Tosoh Bioscience) with a mobile phase buffer of 200 mM sodium phosphate, 450 mM NaCl, and pH 6.5. The elution profile was monitored at 214 nm. A sample volume of 20 μL at 0.5 mg/mL was injected. AUC sedimentation velocity was run at 20,000 rpm and absorbance data at 280 nm was collected. The data were analyzed using Sedfit (Schuck 2000). For the concentration-dependent study, samples at three different concentrations were analyzed at 50,000 rpm, and the data were fitted using Sedphat for reversible association (Schuck 2003). Gravitational sweep AUC (AUC-gs) was performed between 3,000 rpm and 50,000 rpm, and the absorbance data at 280 nm was analyzed using SedAnal (Stafford and Braswell 2004). For more detailed discussion of the techniques, please see Chap. 3.
7.3.2 Results
Representative SEC chromatograms from the stability samples are shown in Fig. 7.6. AUC-SV was used to verify the SEC results. AUC-SV was run at relativly low speeds (20,000 rpm) on the same stability samples in an effort to capture the larger aggregates (Fig. 7.7) that would otherwise sediment too quickly. AUC-SV was performed in a matching formulation buffer that has a lower salt content (compared to the SEC mobile phase). Comparison between AUC-SV and SEC results showed significant differences in relative abundance and size profiles of the aggregates (Tables 7.2 and 7.3). The SEC method underestimated the level of aggregates, especially for the samples stressed at 35°C. The peak area recovery in SEC was assessed to be reasonable and would not account for the loss of aggregates (data not shown). The possibility that some of the aggregates are salt dependent and could dissociate at high salt concentrations in the mobile phase was considered. The discrepancy prompted further development of a more suitable SEC method. To further characterize the aggregates profile, gravitational sweep AUC (AUC-gs) with speeds between 3,000 and 45,000 rpm was employed. This technique expands the dynamic range and allows detection of even larger aggregates if present, although quantitation is difficult (Stafford and Braswell 2004). The resultant profile shown in Fig. 7.8 demonstrates that some very large aggregates are present in the stressed sample. Comparison of the size distribution from the single speed at 20,000 rpm to that from the variable speeds showed some interesting similarities as well as differences. Both methods captured the large aggregate at the apparent sedimentation coefficient of 55 S (78 S in standard condition, Fig. 7.8), but the gravitational sweep method detected even larger aggregates at 1,800 S. Due to the changing speed during the sedimentation, it is not possible to determine the true size and mass of aggregates in Fig. 7.8. However, if treated as compact spheres, the minimal size and molar masses of the aggregates in an AUC-gs run can be estimated, and this data is provided in Table 7.4. The results show that a broad size range of aggregates are formed in this biotherapeutic after being subject to stress conditions.
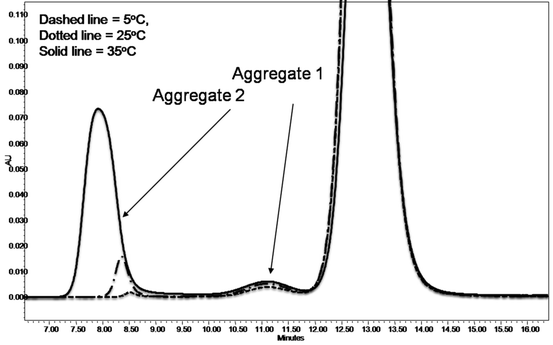
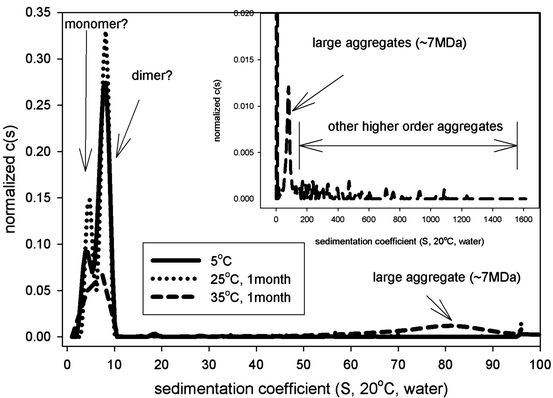
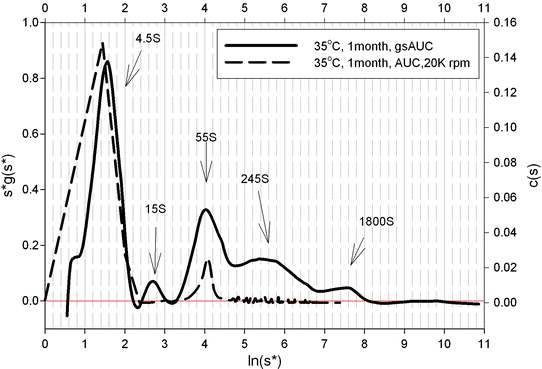

Fig. 7.6
SEC chromatogram of representative stability samples of an Fc-fusion protein

Fig. 7.7
AUC-SV sedimentation coefficient distribution for the stability samples of an Fc-fusion protein

Fig. 7.8
Gravitational sweep AUC analysis of the 35 °C 1-month stability sample of an Fc-fusion protein showing the wide range of aggregate sizes present
Table 7.2
Relative abundance of aggregates by SEC analysis for the Fc-fusion protein stability samples
Sample treatment (1 month) | Total aggregates | Aggregate 1 | Aggregate 2 |
|---|---|---|---|
5 °C | 1.6% | 1.4% | 0.2% |
25 °C | 3.7% | 1.8% | 1.8% |
35 °C | 20.9% | 2.4% | 18.5% |
Table 7.3
AUC-SV results of the stability samples for the Fc-fusion protein
Sample treatment (1 month) | Monomer | Dimer | Large aggregates | Other higher order aggregates | ||||||
|---|---|---|---|---|---|---|---|---|---|---|
Mol. wt. (kDa) | Sed. coeff. (S20 o C,w) | Fraction % | Mol. wt. (kDa) | Sed. Coeff. (S20 o C,w) | Fraction % | Mol. wt. (kDa) | Sed. coeff. (S20 o C,w) | Fraction % | Fraction % | |
5 °C | 85 | 4.1 | 21.5 | 222 | 7.7 | 78.0 | 1.2a | |||
25 °C | 86 | 4.7 | 28.5 | 202 | 8.0 | 68.7 | 3.0a | |||
35 °C | 7 | 78.2 | 33.9 | 27.8b |
Table 7.4
Size and molar mass of the hypothetical compact spheres for the species in the gravitational sweep AUC (also see Fig. 7.8)
Species | Minimum molecular weight (MDa) for compact spheres | Minimum hydrodynamic radius (nm) for compact spheres |
|---|---|---|
1800 S | 565.6 | 54.7 |
245 S | 28.4 | 20.2 |
55 S | 3.0 | 9.6 |
15 S | 0.4 | 5 |
4.5 S | 0.1 | 2.7 |
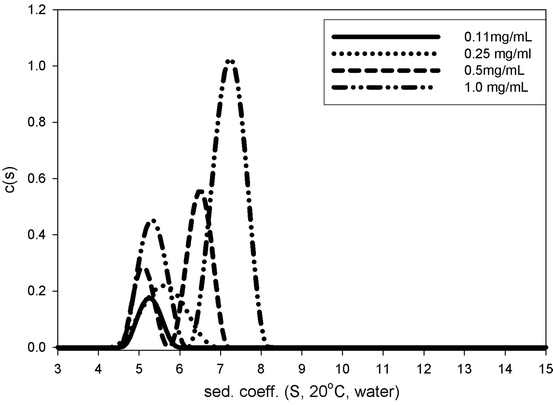
In addition to the broad distribution of aggregates, the AUC profile at 20,000 rpm shows two overlapping main peaks (Fig. 7.7). This suggests the existence of a dynamic equilibrium during the sedimentation process. To further understand the potential for reversible self-association, a concentration-dependent AUC-SV analysis was applied to the sample at 5°C. Figure 7.9 shows the size distributions at three different concentrations. The concentration-dependent shift in sedimentation coefficient of the second peak suggests that there is rapid association/dissociation equilibrium at the timescale of the sedimentation experiment (Schuck 2003). Global data fitting to the Gilbert–Jenkins theory implemented in Sedphat gives a dimer dissociation constant of 40 μM and the free energy of the association as −5.9 kcal/mol, suggesting a moderate strength protein–protein interaction (Horton and Lewis 1992). It is likely that this association is dependent on salt concentration so that this equilibrium does not occur in the SEC mobile phase, and the SEC analysis therefore does not detect the presence of protein self-association. It may be possible that the non-Fc part of the fusion protein has pH- and salt-dependent self-association behavior too.

