Learning Objectives
- Develop an overview of the demography and societal effects of global aging and its relationship to noncommunicable diseases (NCDs)
- Understand the increasing contribution of NCDs to the global burden of disease, especially in less developed countries
- Develop a perspective on the rank order of chronic diseases, risk factors, and causes of death when disability effects are included
- Recognize the increasing contributions of development-related risk factors to the expansion of NCDs
- Become aware of institutional and governmental responses to the challenges of managing increasing numbers of older persons and chronically ill patients
Introduction
As countries become more developed, changes occur in their populations that alter the types of problems faced by their health care systems and providers. Successful reduction of deaths at younger and adult ages eventually shifts the age distributions so that older persons become an increasingly larger portion of populations. Reductions in deaths related to childbirth, undernutrition, infectious diseases, and injuries allow people to live longer and become more vulnerable to chronic diseases. Although these diseases, as classified in the Global Burden of Disease framework1 may be secondary to group 1 (infectious diseases, perinatal, and nutrition related) conditions or group 3 (injuries), this chapter focuses on the increasingly prevalent group 2 conditions (noncommunicable diseases [NCDs]).
Developing as a nation increases access to the products of global markets. As consumers, people often respond to convenience and marketing influences by changing their lifestyle. Generally, as an economy develops, its citizens utilize less exertion to meet the demands of life, at the same time that they experience increased access to food calories from nontraditional sources. The resulting increase in overweight and obesity with associated comorbidities, combined with the adverse effects of increased tobacco and substance abuse, contribute to increased incidence and the younger onset of many chronic diseases. Although the less developed countries often find it difficult to respond to the double burden of communicable and noncommunicable disease, the more developed countries meet the challenges of chronic NCDs by devoting more resources, including labor. Skilled health care workers are recruited from less developed parts of the world to meet these needs. Initially chronic diseases can be managed medically utilizing these expensive resources, but with time even these resources are unable to prevent functional decline and death.
Chronic diseases have recently become the predominant worldwide causes of death and disability in most countries, and that burden is being carried more and more by the developing areas of the world. Institutions and governments are increasingly focusing on the challenges that this transition in the global burden of disease will present to efforts to improve world health. Age is widely acknowledged to strongly influence the pattern and extent of ill health at both the individual and population level. This makes it important to consider demographic and epidemiologic change in populations, as well as their health systems’ responses to both individual and population aging.
Global Aging through Demographic Change
Whereas individual aging refers to the aging process in a person, population aging, in simplistic terms, refers to the process by which older persons, here defined as persons 60 years and older, become a proportionally larger part of a country’s or region’s total population.2 This process, also referred to as demographic aging, leads to changes in the age structure of a population and a higher median age.
Over the last century, changes in three principal population factors (fertility, mortality, and migration) contributed to global population aging. It was primarily declining fertility and longer life expectancy that reshaped age structures in most countries of the world by shifting relative weight from younger to older segments of a population while international migration played a much less important role.3 Although one intuitively thinks of changes in longevity when considering why populations age, falling levels of fertility have been the most prominent historical determinant in global population aging.2,4,5
Although declining fertility is the most prominent driver of population aging, fertility-related factors play a multipart role in the aging process. For example, persistently lowered fertility brings about a decline in the proportion of children, which accordingly increases the proportion of older persons. This effect is referred to as aging from the base of the population structure.6 However, past fertility decline, such as the lowered fertility experienced in some countries during the Great Depression and World War II, has also led to a fall in the growth rate of the older population as the smaller birth cohorts over time reach older ages. However, past fertility increase as experienced in some countries after World War II, has contributed to an increase in the growth rate of the older population. From around 2008 until about 2018, these postwar baby boom cohorts will have been augmenting the numbers of older persons significantly.4
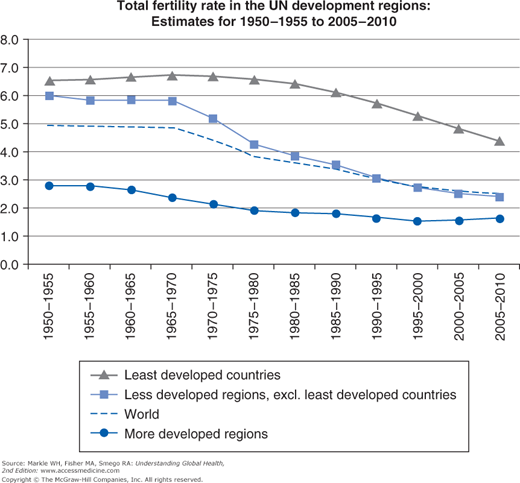
Although global fertility is estimated to have been persistently high during the 1700s and 1800s at a total fertility rate (TFR) of around 6.0 children per woman, the second half of the 1900s saw a dramatic decline in global TFR levels, declining from 5.0 for the period 1950–1955 to 2.5 for 2005–2010. As a result of the sustained fertility decline during the 1900s, all 45 developed countries were at or below the replacement level of 2.1 for 2005–2010 with the median 1.5. Highest TFRs for developed countries in 2005–2010 were found in New Zealand, Iceland, Ireland, and the United States at 2.1, and lowest in Bosnia and Herzegovina, Slovakia, Poland, and Japan at 1.2 to 1.3.7 Fertility decline in the developing countries commenced later but has proceeded at a faster pace. Total fertility fell from 5.4 for 1970–1975 to 2.7 for 2005–2010 with a median TFR of 2.7 children per woman. The TFR for the least developed countries has fallen more slowly, with many of these countries still having TFRs above 5.0. Figure 16-1 illustrates the difference among the development regions. Large disparities also exist among nations within development regions. For example, Hong Kong SAR, China, has the lowest rate among the less developed nations at 0.99 and Niger the highest at 7.2. For the world’s two most populous nations, China had an estimated TFR of 1.64 in 2010 and India’s was 2.73.7
Although there continue to be numerous developing nations with high levels of fertility and relatively low proportions of older persons, it is important to acknowledge that fertility decline in the less developed regions generally has been much more rapid than experienced in the more developed regions, that the decline is expected to continue, and that a particularly sharp reduction is expected for the least developed countries.7 These countries are therefore expected to age at a more rapid pace than has happened in the developed nations, leaving them with a much shorter time to prepare the policies, infrastructure, health, and other resources to meet the needs associated with rapidly changing demographic and epidemiologic profiles.4
It is intuitive to think that, once mortality is reduced in a population, it will automatically lead to aging of that population. However, mortality reduction influences population dynamics in particular ways according to whether such mortality reductions happen in younger or older ages. Infant and child mortality rates usually are reduced in a population before reduction of adult mortality rates. This means that more infants and children survive in that population; therefore it is common to argue that mortality declines in a population usually first lead to a rejuvenation of that population. In general, countries’ demographic histories have shown that such improvements in infant and child mortality, preceded by fertility declines, improved chances of survival for adults to older ages and became a more important factor in population aging.2–5 It is therefore usually at a later stage that declines in adult mortality contribute to population aging.
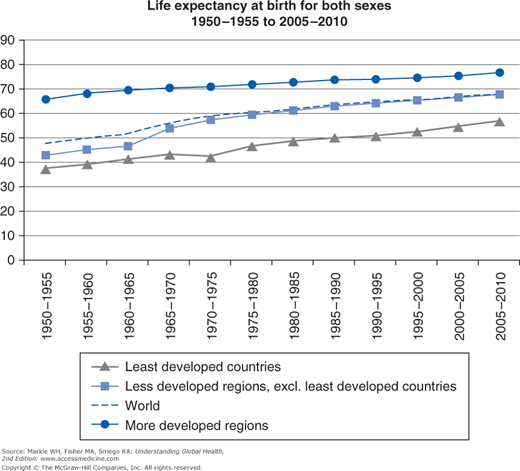
Since the middle of the previous century, life expectancy at birth increased globally by 20 years, from 47.7 to 67.9 years.7 Great variations exist between more and less developed regions as shown in Figure 16-2. For example, life expectancy reached 70 years for more developed countries during the late 1960s, whereas this mark has not yet been reached by the populations in less developed countries. Even greater variations exist among nations within the less developed regions, but differences are expected to decrease and more people to survive to older ages. Given current mortality levels, almost 75% of newborns in the world will survive to age 60, and about 33% to age 80. These proportions, respectively, are projected to increase to about 88% and over 50% by the middle of this century. Moreover, gains in life expectancy are expected to be higher at older than younger ages. This means that, not only are more persons surviving to old age, but also that once they reach old age, they tend to live longer2 (Figure 16-2).
In many of the more developed countries, the numbers of persons of extreme old age are of growing importance. Despite the problems with obtaining accurate age data on oldest old persons, researchers in Europe estimated that the number of persons over age 100 in Europe and Japan increased by 7% annually.5 The UN Department of Economic and Social Affairs in 2007 estimated that the population of centenarians was about 270,000 as of 2005 and will reach 2.3 million by 2040.4
According to UN projections, increases in life expectancy at birth began in the mid-1800s, continued during the 1900s, and will continue to increase in all regions of the world to 2050.2 Despite global gains in life expectancy at birth being the norm, changes in the sociopolitical and epidemiologic status quo of some countries have been shown to challenge this historical pattern with particular consequences for the process of population aging. In Eastern Europe and the former Soviet Union, for example, the rate of increase in life expectancy had decelerated sharply by the mid-1960s, and male life expectancy declined during the 1970s and 1980s. In some countries, the decline continued into the 1990s. Although causal mechanisms are not clearly understood, the increases in adult male mortality are attributed to a combination of factors, including poor diet, increased accident and homicide rates, environmental and workplace degradation, but are predominantly due to excessive alcohol consumption.8
In other countries, particularly in sub-Saharan Africa, the HIV/AIDS epidemic has had a devastating effect on life expectancy. Because mortality from AIDS usually is concentrated in infant, childhood, and early and middle adult ages, the impact on life expectancy at birth has been shown to be substantial in countries such as Botswana, South Africa, Swaziland, Uganda, and Zimbabwe. Careful analyses of South African mortality data of the 1990s, for example, show marked increases in age-specific death rates in infants and children with a severe increase in young adult mortality. The year 2000 Burden of Disease analysis for South Africa estimated that HIV/AIDS was the cause of almost 40% of premature mortality measured as years of life lost in that year, and would account for as much as 75% of premature mortality by 2010 depending on the efficacy of interventions.9 The nadir of South African life expectancy was estimated to have occurred in 2005 with life expectancy at birth of 49.6 years for men and 53.8 years for women.10
International migration’s role in changing the age distribution of national populations has been far less important compared with fertility and mortality.2,4 A UN-facilitated assessment of the likely impact of migration as a counterbalance to aging led to the conclusion that, unless the migration flows are of a very large magnitude, inflows of migrants will not be able to rejuvenate national populations. However, there is some evidence that population aging can be influenced in smaller nations, as has been the case in certain Caribbean populations. There the emigration of working-age adults, immigration of foreign retirees, and return-migration of former worker-emigrants contribute to the aging of these populations.4
Internal migration also affects the distribution of a country’s older population. By 2005, half of the world’s older people were living in urban areas, as was half of the total world population by 2007. The delay in urbanization of the total world population reflects the larger, younger, and more rural populations in the developing world. Whereas Latin America has joined North America, Europe, and Oceania in this urbanization, Africa and Asia remain largely rural populations. Even though the people moving to urban areas tend to be in the young adult ages, available data show that population aging is occurring in all urban and rural populations, except in rural Africa. Due to the lower fertility and mortality characteristics that commonly occur in cities, this population shift is expected to accelerate the transition to an older world population.11,12
In spite of the increasing urbanization of today’s older populations, most nations continue to have higher percentages of older persons in their rural areas. This is largely the result of rural-to-urban migration of younger people in search of employment with a small contribution by return migration of older persons from urban to rural areas. Regional differences exist, and although older persons in Africa are more likely to live in rural areas than are older persons of other regions, the proportion of urbanized older persons in Latin America and the Caribbean is very similar to the average proportions found in the more developed countries. A marked exception is the Oceania region, which is dominated by the populations of Australia and New Zealand, where the elderly predominantly live in cities.3 In fact, there is great variability in the percentage of urban people over age 65 compared with the percentage of aged in the total population of the country when cities around the world are compared.4 Increasing attention is being turned to promoting healthy environments for older urban residents.5
Most, if not all nations, at some time in their history had a youthful age structure, but nearly all nations are now experiencing growth in the numbers of their older populations.4 In 1950–1955, the average annual growth rate of the number of persons older than 60 years at 1.7% was similar to that of the total global population at 1.8%. For 2005–2010, the 60-plus growth rate at 2.6% was more than twice that of the total population at 1.2%. By 2045–2050, the growth rate of the 60-plus population is expected to decline to 1.8%; however, it will still be more than five times that of the total population at 0.3%.3 In 1950, older persons made up 8% (200 million) of the world population, in 2000, 10% (600 million), and by 2050, the proportion is projected to increase to 22% (2 billion).13 These numbers indicate a tripling of the population 60-plus over each of the two consecutive 50-year periods,13 implying that the global older population is projected to increase by an average of 28 million persons per year, or approximately 78,000 per day between 2000 and 2050. Increasing numbers hold both opportunities and challenges for countries, in particular for those five countries projected to have more than 50 million people older than 60 years by 2050: China (440 million), India (316 million), United States (111 million), Indonesia (72 million), and Brazil (64 million).3
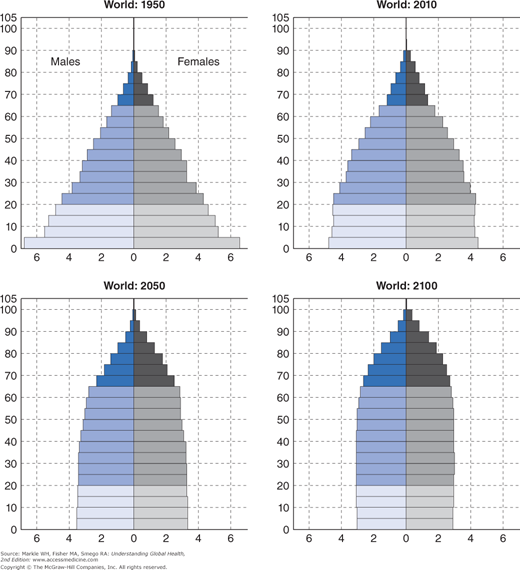
These demographic changes lead to changes in the balance between age groups. The population pyramid is a frequently used way to graphically represent the age and sex distributions of a population. Historically the shape has been pyramidal due to the preponderance of people in younger age groups, with smaller proportions in the older age groups. As the adult age group becomes proportionally larger, the pyramid shape commonly changes to a dome shape, after which it rectangularizes, as shown in Figure 16-3.7
In general, the more developed countries are in a more advanced stage of their demographic transitions to lower fertility and mortality, and already by 1950, developed countries as a group had a higher proportion of population ages 60 and older (12%) compared with developing countries (6%). Developed countries continue having a larger proportion at 21% compared with 8% in developing countries.3 Among the world’s major regions, Europe has had the highest proportion of older persons for many decades, and it is projected to remain as such for the next five decades. Except for Japan, the world’s 25 demographically oldest countries were all in Europe. Among the oldest in 2012 by percentage of population 60 years and older, were Japan (32%), Italy (27%), Germany (27%), Finland (26%), Greece (25%), Sweden (25%), and Belgium (24%). The North America and Oceania regions have somewhat lower, but still relatively high percentages, with Canada and the United States, respectively, at 21% and 19%, and Australia and New Zealand, respectively, at 20% and 19%, in 2012. Altogether, 22% of persons living in the more developed regions were 60 years and older in the year 2012. This number is expected to grow to 32% by 2050.5 Before the middle of the current century, some of these countries may have more grandparents than children under age 18.4
In contrast, 9% of the population of developing countries was 60 years and older in 2012. Of the UN-classified major areas, Africa (6%) housed the smallest proportions of older persons globally. Some less developed countries were further advanced in demographic change and had higher proportions in 2012, including Tunisia (10%), Singapore (15%), Israel (15%), Argentina (15%), Cuba (18%), and Uruguay (19%). These were still below the average 22% of the more developed countries.5 By 2050 it is projected that, although Japan will still lead with 42% of its population over age 60, Bosnia and Herzegovina (40%), Cuba (39%), and the Republic of Korea (39%) will have entered the top 10 list.14
Proportions by themselves, however, do not give a real sense of the aging momentum in the world’s countries. Of larger public health concern is the total number of older persons and the annual growth rate of the older population. Compared with the relatively slow process of population aging experienced so far by most developed countries, population aging in most developing countries is occurring at a faster pace and, as such, over a shorter period. Furthermore, many developing countries have large populations, and large numbers of older persons live in those countries despite comprising relatively low proportions of the total population.3 In contrast to 1950–1955 when the number of persons 60+ was growing slightly more rapidly in the more developed (1.9% per year) than less developed regions (1.6% per year), the current average annual growth rate is 1.9% in the more developed regions and 3.0% in the less developed regions. By the middle of this century, the growth rate of the 60+ population in the less developed regions (2.1%) is projected to be over five times that in the more developed regions (0.4%), and the growth rate of the 60+ population in the least developed countries (3.5%), about nine times that in the more developed regions.3
With such growth rates, the concentration of persons 60+ in the less developed world will intensify, and many individual developing countries can expect large increases in their numbers of older persons. Over half (54%) of the world’s older persons lived in less developed regions in 1950. This proportion rose to 64% in 2009 and is projected to rise to nearly 80% by 2050. Drastic increases in the older population are expected in several developing countries, spanning a wide range of development levels. For the period 2011–2050, particularly large percentage increases are expected for the United Arab Emirates (35%), Bahrain (29%), Iran (26%), and Oman (25%).5
Socioeconomic Effects of Aging on Populations
Dependency ratios, a commonly used measure of potential social support needs, are a way of describing how the gradual rectangularization of age group distributions will produce socioeconomic effects. These ratios compare the part of the population expected to be in some sense dependent to that part that is likely to be economically productive. This likelihood is estimated using age groupings because aggregate data about individual productivity is not available. Those under age 15 and over age 64 are considered to be unproductive in economic terms, and those aged 15 to 64 are presumed to provide direct or indirect support to those in the dependent ages. It can be argued that these assumptions are not accurate for many populations. For example, in developed countries educational requirements can defer productivity until age 20+, and many adults are economically active until 70 or longer. Additionally, in some developing countries with high unemployment levels, productivity in the working age population is not optimal, and large proportions do not provide direct or indirect support. Also disability in people ages 15 to 64 may remove them and often a caregiver from the working population. In the future, more accurate measures of the number of workers and dependents will be needed for economic projections, but this measure will be used as an approximation of the burden of dependency for the purposes of this chapter (Figure 16-4a and 16-4b).
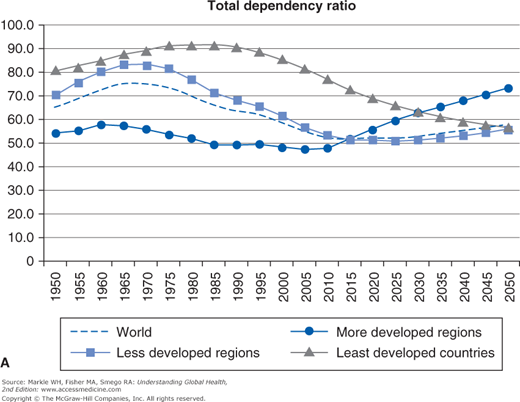
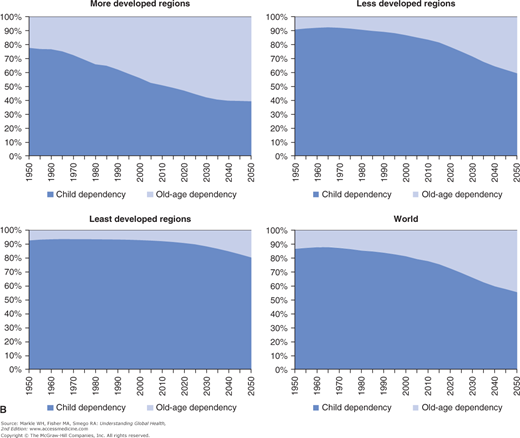
Child, old-age, and total dependency ratios for the world population, and for the more, less, and least developed nations are shown in Figure 16-4a, and the composition of the total dependency ratio for the development regions and the world population are illustrated in Figure 16-4b.
Due to the large size of their populations, the less developed regions have ratios that are much closer to the world’s ratios compared with those of the more developed regions. The total dependency ratio of the world population decreased from the 1970s and is projected to continue declining to around 2015 as those born in years of high birth rates have aged into the productive age groups and as fewer children were produced in succeeding generations. Around 2020 the total dependency ratio is projected to begin to increase due to the rapidly growing older age groups. In the more developed regions, the old-age share of the total dependency ratio was already large by 2010 (49%) and is projected to increase to over 60% by 2050. Figure 16-4b illustrates very small increases in the old-age component in less developed nations until about 2015 after which the increase is projected to become larger. Less than half of their dependents are projected to be older persons by 2050 (41%); however, this is a large increase from the approximate 10% that older persons accounted for in 1950. In the least developed countries, the old-age share has increased very slowly since 1950, is expected to increase more rapidly around 2025, and will constitute about 20% of the total dependency by 2050.7
Almost all of the increase (from 2.8 to 4.1 billion people) in the world population’s working age group will occur in the less developed regions. In contrast, this age group in the developed regions began declining in 2005 and will be 15% smaller in 2050. These demographic trends have been said to present an opportunity for the less developed regions to utilize their higher proportion of productive workers to improve economic conditions in their countries. It is, however, important to note that the benefits associated herewith are not automatic but depend on sound macroeconomic policies that increase employment opportunity, promote productive investment, and ensure a stable socioeconomic environment.11
A 2005 UN study found that one of seven older persons live alone, and most of these are women. In developing regions, 7% of the older persons live alone, whereas 25% of those in developed regions do so. The trend in many developed countries for older people to more often live alone has started to decline in some countries, perhaps due to factors such as an increase in the age when children leave home, and possibly also due to greater survival to oldest-old ages where a greater need exists for live-in assistance or institutionalization. As people become very old, they have increasing functional disability and eventually need assistance with basic activities of daily living. In some societies, these needs can be managed as three- and even four-generation households become more common. In some developing countries this happens more in families with higher socioeconomic status (SES). In a number of countries, labor migration of adult children has been known as a reason for skipped-generation households, but recent research has found that such households are becoming more common in countries where children live with grandparents due to loss of their parents to HIV infection. Older women are more likely than older men to live in such living arrangements. In more developed economies, the perceived demand for family income is pushing more family members into the workforce, leaving fewer caregivers in the home. Ultimately, greater demands are placed on institutions to assist family caregivers. In poor economies, analogous situations of greater labor force participation and fewer caregivers in the home exist, but little is known about how older persons cope where no institutions, formal homecare, or assisted-living options exist to help care for dependent older persons.12
Challenges of Population Aging
The shifts in age structures associated with population aging hold important implications for a broad range of economic, political, and social conditions. The older population is growing faster than the total population in both more and less developed nations, and huge increases continue to be experienced in the numbers of older persons. More persons are surviving to older age, and once they reach older age, they tend to live longer. As more persons live longer, retirement, retirement funds, social grants, and other social benefits tend to extend over longer periods of time, necessitating changes in social security systems.5 Having more people who live longer, results in rising demands for health services and increasing medical costs. In general, health conditions decline and frailty and disability increase with advancing age, so the growth in the numbers of this oldest-old age group is of particular concern. The increase in this group suggests an increase in the demand for chronic care, rehabilitative care, palliative care, and other types of long-term care.5,15 These, in turn, promote growing institutional populations and an increased demand for appropriately trained health care staff where institutions are affordable, as well as an increased demand for informal caregivers where institutions are not an option.
An outcome of persistent fertility decline, likely to be of more importance in the less developed nations, relates to the progressive decline in the availability of kin on whom future cohorts of older persons can rely for support.2 Fewer family members are available to provide assistance with activities of daily living and disability, life management, financial and subsistence support, and informal long-term care in frailty and severe illness.
As more people live longer through changes in mortality in most of the world’s nations, various socioeconomic challenges are posed at the societal level. In affected nations, AIDS-specific mortality diminishes a crucial support base (income-generating and/or care giving children), producing thereby socioeconomic challenges at societal, community, and individual levels. Older persons are commonly involved with the living and care giving arrangements of AIDS-sick persons and their dependents in many affected countries. Although it is a common phenomenon in some of these countries that many older persons, in particular those in multigenerational households, assist in raising their grandchildren, the AIDS epidemic has brought added responsibilities, concerns, and stressors to many affected older persons. These include care giving for a relatively unknown disease; a greater burden of housework tasks; dealing with the stigmatization of the disease and those living with the disease; the risk of HIV infection through care giving activities; extra demands on older caregivers’ financial resources to cover health care costs related to AIDS-ill children, costs related to raising and nurturing the dependents of AIDS-ill children, and funeral costs; as well as the loss of current and future financial support from the ill child.16,17
Although international migration usually does not play a major role in population aging, internal migration may pose challenges to the aging of local populations within country boundaries. At the familial or household level, internal migration in the form of rural-to-urban movement in some countries may be disadvantageous to older persons who lose their traditional care giving base (in some communities the only local support base) as children emigrate. At the community and local level, older persons may be negatively affected through a weakened local workforce resulting in a diminished pooling of taxpayers’ resources, in turn effectuating lesser access to health, welfare, or recreation infrastructure and resources in the form of health centers, health personnel, social welfare centers, social workers, and social and cultural events.18 Lack of amenities, services and infrastructure, and harsh living conditions in many rural areas pose difficulties for older persons. The provision of health, social welfare, and other support services to ill, disabled, and frail older persons in rural areas continue to present particular challenges to many governments around the world.4 Also, the provision of services to older persons is likely to present challenges in both urban and rural areas where youthful age structures stimulate an emphasis on infant/child and reproductive health. These challenges related to fertility, mortality, and migration will be more of a concern in less developed countries with limited resources and less preparedness for an aging population than is the case in more developed countries.
Due to their greater life expectancy, women constitute a large majority of the 60+ population in most countries. The female share increases with age, and women’s survival advantages are anticipated to continue so that by 2050 only 38% of the 80+ population will be men. This increasing female share is relevant to public policy because older women are more likely to be widowed; dependent on social support; and to have less education. They also usually have less work experience and access to income-generating opportunities, assets, and private income sources. The latter socioeconomic characteristics may stem from lifelong gender disadvantages in formal market opportunities, and women’s greater burden of providing care for the sick, frail, and disabled. These issues have implications for social support and public planning.2–5
It is clear that the world is facing unprecedented magnitudes and speed of population aging. The timing and rapidity of population aging are being experienced differently in developed and developing nations, and as the relative size of the youth, working-age, and older-age components of populations change, the shifting weights of these broad age groups are likely to increase social, economic, and political pressures on societies. Population aging has become a well-publicized phenomenon and public concern in most developed nations, but there is much less awareness and public concern in developing nations. This is despite the fact that many developing countries are aging at a much faster rate than countries in the developed world, and that the numbers of older persons in developing countries exceed those in developed nations. The rapidity and compressed time frame within which these changes are happening in the developing world, and the fact that it is occurring on relatively larger population bases than in the developed world, pose particular challenges to social and economic institutions in nations with scarce resources.15
As individual longevity increases, frailty, chronic disease, and disability rise while physical, mental, and cognitive capacities decline.5 At the societal level, the demographic aging of populations is directly related to fundamental changes in the health and disease patterns within a population as epidemiologic change progresses from the predominance of infectious, parasitic, and nutritional disease to the predominance of NCDs.18
The Epidemiologic Transition to Noncommunicable Diseases
Historically, the health status and disease profile of human societies were linked to their level of social and economic development. With industrialization, the major causes of death and disability in more developed societies shifted from a predominance of nutritional deficiency related and infectious (group 1) diseases to diseases classified as NCDs (group 2), such as cardiovascular disease, cancer, and diabetes. This epidemiologic transition can occur within organ-specific diseases as well as between different disease categories, with childhood infections and malnutrition being substituted by adult chronic diseases and rheumatic heart disease by coronary heart disease.15,19,20
Whereas communicable diseases were previously the main cause of death, improvement in living conditions, the management of infections, and the advent of vaccinations caused NCDs to proliferate, especially in Western countries. NCDs (cardiovascular disease, diabetes, cancer, chronic pulmonary disease, and mental illness) have increased the demand for health care in these countries. By the turn of the 21st century, NCDs were present across the globe and showed an increase even in developing countries. However, developing countries must still deal with the challenges of the double burden of NCDs and communicable diseases because the latter have not been eliminated.15 In the latter part of the 20th century, the leading causes of the disease burden were communicable diseases and perinatal conditions resulting from malnutrition, poor sanitation and hygiene, and unsafe water (Table 16-1).
Non-communicable Disease | Communicable Disease + Maternal + Perinatal + Nutritional | Injuries | Total | |
|---|---|---|---|---|
1990 | 18.7 (47%) | 16.6 (42%) | 4.2 (11%) | 39.5 (100%) |
2000 |


