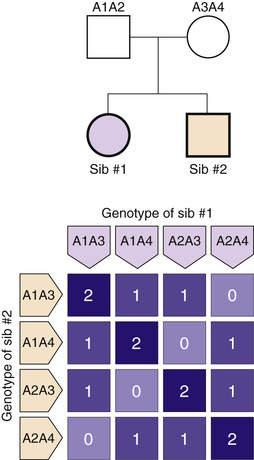
The more distantly related two members of a family are, the fewer alleles they will have in common, inherited from a common ancestor.
Familial Aggregation in Qualitative Traits
If certain alleles increase the chance of developing a disease, one would expect an affected individual to have a greater-than-expected number of affected relatives compared to what would be predicted from the frequency of the disease in the general population (familial aggregation of disease). This is because the more closely related the family members are to the affected relative, the more they will share the relevant alleles and the greater their chance of also being affected. Here, we will present two approaches to measuring familial aggregation: relative risk ratios and family history case-control studies.
Relative Risk Ratio
One way to measure familial aggregation of a disease is by comparing the frequency of the disease in the relatives of an affected proband with its frequency (prevalence) in the general population. The relative risk ratio λr (where the subscript “r” refers to relatives) is defined as:
λr=Prevalence of the disease in therelatives of an affected personPrevalence of the disease inthe general population
The value of λr as a measure of familial aggregation depends both on how frequently a disease is found to have recurred in a relative of an affected individual (the numerator) and on the population prevalence (the denominator); the larger λr is, the greater is the familial aggregation. The population prevalence enters into the calculation because the more common a disease is, the greater is the likelihood that aggregation may be just a coincidence based on drawing alleles from the overall gene pool rather than a result of sharing the alleles that predispose to disease because of familial inheritance. A value of λr = 1 indicates that a relative is no more likely to develop the disease than is any individual in the population, whereas a value greater than 1 indicates that a relative is more likely to develop the disease. In practice, one measures λ for a particular class of relatives (e.g., r = s for sibs or r = p for parents). Examples of relative risk ratios determined for various diseases in samples of siblings (thus, λs) are shown in Table 8-2.
TABLE 8-2
Risk Ratios λs for Siblings of Probands with Diseases with Familial Aggregation and Complex Inheritance
| Disease | Relationship | λs |
| Schizophrenia | Siblings | 12 |
| Autism | Siblings | 150 |
| Manic-depressive (bipolar) disorder | Siblings | 7 |
| Type 1 diabetes mellitus | Siblings | 35 |
| Crohn disease | Siblings | 25 |
| Multiple sclerosis | Siblings | 24 |
Stay updated, free articles. Join our Telegram channel

Full access? Get Clinical Tree


