Age, Weight, and Gender
OBJECTIVES
The reader will be able to:
- Define what is meant by a typical patient and a usual adult dosage regimen of a given drug.
- Define adolescent, adult, body mass index, body surface area, creatinine clearance, elder, ideal body weight, infant, lean body mass, and neonate.
- Determine those drugs for which loading dose, normalized for body weight, is likely to be independent of age, given the volume of distribution and fraction unbound.
- Describe the likely changes in the pharmacokinetics of a drug predominantly excreted unchanged, from neonate to elderly patients.
- Explain the general trend of metabolic clearance of drugs with age, from neonate to elderly patients.
- Discuss the general gender differences observed in pharmacokinetics and pharmacodynamics.
- Given the usual adult dosage regimen of a drug in a typical patient, estimate the dosage to be given to patients from 1 to 100 years of age (without considering other sources of variability).
 ging, characterized by periods of growth, development, and senescence, is an additional source of variability in drug response and, as a result, the usual adult dosage regimen may need to be modified, particularly in the young and the old, if optimal therapy is to be achieved. Furthermore, it is the very young and the aged, in particular, who often are in most critical need of drugs. It is against this background in which an attempt is made in this chapter to develop a framework for making dosage adjustments for age. Body weight and gender are also examined.
The life of a human is commonly divided into various stages. In this book, the various stages are defined as follows: neonate, up to 1 month post utero; infant, between the ages of 1 month and 2 years; child, between 2 and 12 years of age; adolescent, between the ages of 13 and 19 years; adult, between 20 and 75 years; and elder, older than 75 years of age. It is recognized, however, that this stratification of human life is arbitrary. Life is a continuous process with the distinction between one period and the next often ill defined. Furthermore, society’s view of who is “elderly” is changing as the general health of the population improves with new therapies and as the baby boom generation ages. It is also recognized that chronologic age does not necessarily define functional age, and accordingly, statements made in this chapter pertain to the average person within the age bracket rather than to the individual.
Expediency and practicality dictate against the wide use of longitudinal studies in individuals to examine the influence of age on pharmacokinetics or pharmacodynamics. Rather, single observations are made in individuals of differing ages. The information obtained therefore pertains to the population sampled at the time of the observations and does not necessarily reflect how an individual may change with age.
THE TYPICAL PATIENT AND USUAL DOSAGE REGIMEN
WHO IS “THE TYPICAL PATIENT”?
The typical patient is the individual who usually receives a drug of interest for a given indication. The age of the typical patient may therefore vary with the drug and the indication of its use. Figures 14-1 to 14-3 show different age trends for selected diseases in the United Kingdom. Some diseases (e.g., congestive cardiac failure, hypertension, diabetes, arthritis or rheumatism [Fig. 14-1], and cancer) tend to be much more common in the elderly. The incidence of others, such as asthma, back problems, epilepsy, and migraine (see Fig. 14-2), tend to be spread across the entire lifespan. Still others primarily occur in childhood or early adulthood, like hay fever (see Fig. 14-3), Duchenne muscular dystrophy, and cystic fibrosis. For a few diseases, there is a decided gender difference, as seen with migraine in Fig. 14-2D. Some, of course, are decidedly gender specific, such as benign prostatic hyperplasia, breast cancer, prostate cancer, and testicular cancer.
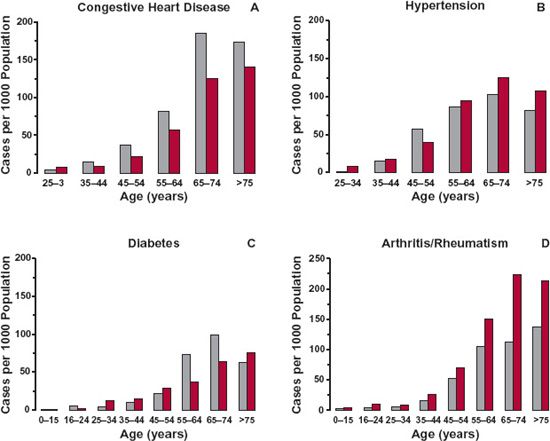
FIGURE 14-1. The incidences of congestive heart disease (A), hypertension (B), diabetes (C), and arthritis/rheumatism (D) in 2003 are much greater in the elderly population (up to 200 cases per 1000 people) than in children or young adults in the United Kingdom. Males, (gray bars); Females, (colored bars). (From: General Household Survey & Key Health Statistics from General Practice, U.K. Office for National Statistics.)
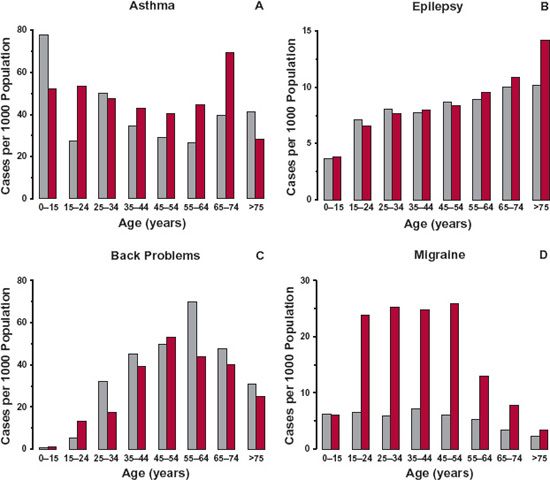
FIGURE 14-2. The incidences of asthma (A), epilepsy (B), back problems (C), and migraine (D) are relatively evenly spread across the population in the United Kingdom in 2003, except for epilepsy for which the data are for 1998. Note the incidences are all lower than in those listed in Fig. 14-1, and that the incidence of migraine is higher in females than males. Males, gray bars; Females, colored bars. (From: General Household Survey & Key Health Statistics from General Practice, U.K. Office for National Statistics.)
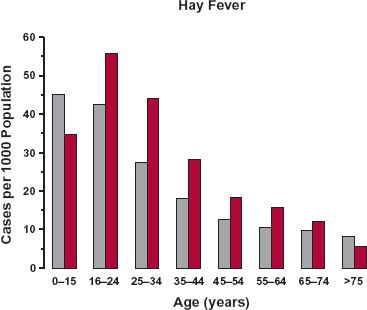
FIGURE 14-3. The incidence of hay fever is much greater in children and young adults than in the elderly population in the United Kingdom in 2003. Males, gray bars; Females, colored bars. (From: General Household Survey & Key Health Statistics from General Practice, U.K. Office for National Statistics.)
Most drugs tend to be, on average, given to either older adults or the elderly. This is evidenced by the number of prescriptions written for various age groups as shown in Fig. 14-4, which summarizes data from the Third National Health and Nutrition Examination Survey (1988–1994). Overall, a majority of 62% of the U.S. population took no prescription drugs, but it is evident that the percentage drops off with advancing years (Fig. 14-4A). Also apparent is the increase in the number of prescribed drugs concurrently taken by the elderly (Fig. 14-4B), giving rise to a much greater use of drugs in this age group.
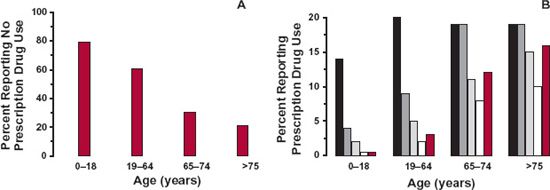
FIGURE 14-4. Patterns of prescription drug use in the United States, 1988 to 1994. A. Sixty two percent of the general population took no prescribed drug, but when broken down into four age groups, the percent receiving no drug greatly decreased with advancing years. B. Also apparent is a large increase in the number of drugs concurrently taken in those 65 years of age and older. Key: On one drug (black); on two drugs (dark gray); on three drugs (gray); on four drugs (white); on five or more drugs (colored). (From: National Health and Nutrition Examination Survey, Department of Health and Human Services, Center for Disease Control and Prevention, National Center for Health Statistics. Retrieved from http://www.cdc.gov/nchs/data/nhanes/databriefs/preuse.pdf. Accessed September 3, 2009.)
There are exceptions (Figs. 14-2 and 14-3) to greater drug use in the elderly, particularly for those drugs given to treat diseases more common to children or young adults. However, because drug utilization is, in general, more frequent in the older adult, a typical patient will subsequently be considered to be 60 years of age and to weigh 70 kg. For many frequently prescribed drugs, this may be an underestimate of the average age of the “typical” patient, particularly for the drugs used in diseases such as benign prostatic hyperplasia, heart disease, incontinence, Parkinson’s disease, and prostate cancer. These patients may, on average, be even older (e.g., 70–80 years).
WHAT IS “THE USUAL DOSAGE REGIMEN”?
Throughout this chapter, reference is made to the usual adult dosage regimen. Before proceeding, this phrase needs to be defined. The word adult refers here to the typical adult patient with the disease or condition requiring the drug. For drugs primarily used in children, such as hay fever, or for a condition common to young adults (e.g., rheumatoid arthritis), the typical patient is younger, and the usual regimen is for this age group. The “usual” adult dosage regimen is defined as the regimen that when given to the typical patient, on average, has the best chance of achieving therapeutic success.
The data in Table 14-1 illustrate a point about age and disease. Listed are estimates of the population pharmacokinetics of digoxin in a group of young, healthy adults and in a group of inpatients receiving digoxin for treatment of severe congestive cardiac failure. Notice the differences in the values of the estimates, particularly for renal clearance, between the two groups. Evidently, estimates obtained in the young, healthy group have limited application to therapy in patients.
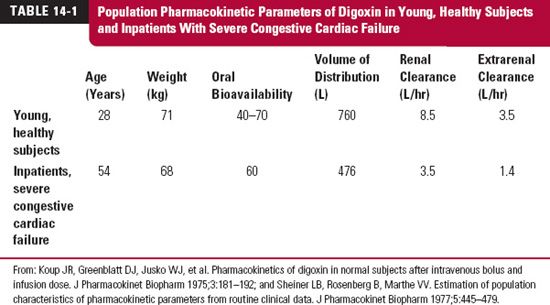
Part of the difference in renal clearance of digoxin between the two groups is accounted for by the disease. Part, however, is accounted for by age. One objective of this chapter is to suggest means of correcting values of pharmacokinetic parameters for age. The intent, thereby, is to permit a better estimate to be made of the initial dosage required to treat a disease in an individual patient or in a patient population whose age differs substantially from the mean age of the patient population in which the usual adult dosage regimen was established. For didactic purposes, the influence of all other factors—such as disease being treated, concurrent diseases, and other drugs—on pharmacokinetics or pharmacodynamics are assumed to be accounted for independently. In practice, these factors are often highly correlated.
PHARMACODYNAMICS
Throughout this chapter, the range of unbound plasma drug concentrations associated with successful therapy is assumed to be independent of age. This is the case for anti-infective agents. For antiepileptic drugs and digoxin, effective plasma drug concentrations also appear to be the same in both children and adults, although children appear to tolerate higher unbound concentrations of these drugs before any toxic manifestations become apparent. Differences in response with age are likely to exist for certain drugs. For example, the observed increased sensitivity of elderly patients to the central nervous effects of benzodiazepines cannot be explained on the basis of differences in pharmacokinetics of this group of drugs. Also, the elderly show reduced response to β-adrenergic drugs, such as propranolol, and are more sensitive to the adverse effects of neuroleptic drugs and anesthetic agents, as shown in Fig. 14-5 for the general inhalation anesthetic, desflurane (Suprane). The systemic exposure of desflurane required to give the same depth of anesthesia needs to be reduced in the elderly. The minimum alveolar concentration is used to measure systemic exposure to the drug in much the same way that a breath test is used to assess blood–alcohol levels.
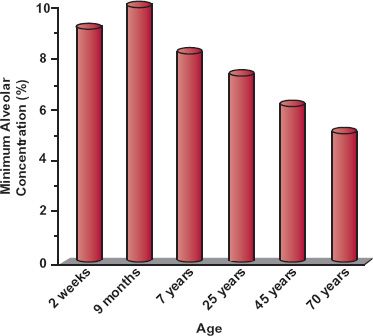
FIGURE 14-5. The minimum alveolar concentration (%) of desflurane required for general anesthesia varies with age. Elderly patients are clearly more sensitive to the anesthetic effect of the drug. (From: Physician’s Desk Reference, 2003;867.)
PHARMACOKINETICS
ABSORPTION
Drug absorption does not appear to change dramatically with age. Nonetheless, all the factors discussed in Chapter 7, Absorption, that affect drug absorption, including gastric pH, gastric emptying, intestinal motility, and blood flow, do change with age. Thus, in the neonate, a condition of relative achlorhydria persists for the first week of life, and only after 3 years of age does gastric acid secretion approach the adult value. Gastric emptying is also prolonged, and peristalsis is irregular during the early months of life. The diet of the neonate (restricted to milk) is also unique. Skeletal–muscle mass is much reduced, and muscle contractions, which tend to promote both blood flow and spreading of an intramuscularly administered drug, are relatively feeble.
A delay in gastric emptying and both diminished intestinal motility and blood flow are seen in the elderly. Although generally still acidic, a more elevated gastric pH and a slower return to acidic gastric conditions on ingestion of meals, because of a decrease of acid-secreting parietal cells, are observed in the elderly. Differences in oral drug absorption among adults, the very young, and the elderly are therefore expected. Generally, changes in rate rather than in extent of absorption are observed. Children often appear to absorb drugs completely and, if anything, more rapidly than adults. Accordingly, in subsequent calculations of dosage, extent of absorption is assumed not to change with age.
DISPOSITION
Body Weight and Composition. One aspect of aging is body weight. Weight, 3.5 kg at birth, increases rapidly in childhood and adolescence and then declines slowly in the elderly (Fig. 14-6). Because body-water spaces, muscle mass, organ blood flow, and organ function are related to body weight, so too should volume of distribution, clearance, and hence, dosage regimens of drugs. Owing to large variability, however, a weight adjustment is generally considered only if the weight of an individual differs by more than 30% from that of the typical patient (70 kg). In practice, then, adjustments for weight are made only for neonates, infants, and children and for adults who are petite, emaciated, or have a very large frame. For individuals who are obese, adjustment in dosage for body weight may be inappropriate as renal and hepatic functions do not increase with the extra fat-related weight.
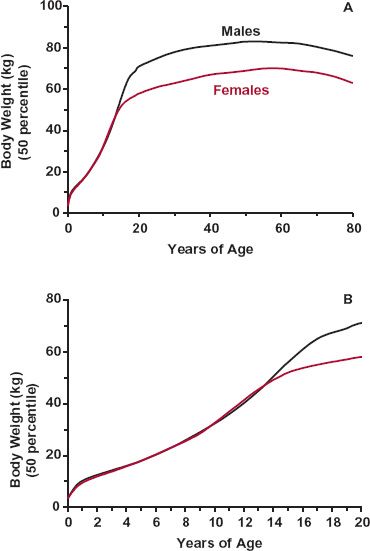
FIGURE 14-6. A. Variation in average weight with age in males (black) and females (colored), from the neonate to the elder. Weight increases rapidly in the young, particularly during the first year of life, and during puberty. It declines slowly after 50 years of age. B. Same data as in A for the age range 0 to 20 years. (From: National Center for Health Statistics in collaboration with the National Center for Chronic Disease Prevention and Health Promotion. Retrieved from http://www.cdc.gov/growthcharts. Accessed September 3, 2009.)
Loading Dose. Clinically, correcting the adult loading dose proportionally with body weight appears reasonable. The volume of distribution based on unbound drug, Vu, is frequently both directly proportional to body weight and independent of age, but not always so. Much depends on the physicochemical properties of the drug and on the reason for the difference in weight.
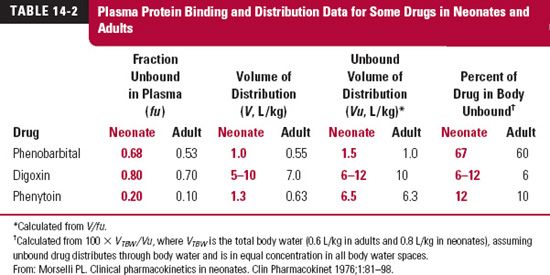
Shown in Table 14-2 are values for degree of plasma protein binding, volume of distribution (V), unbound volume of distribution (Vu), and percent of drug in the body unbound, for three drugs in neonates and adults. The last two parameters were calculated from fraction of drug from plasma unbound (fu) and V (see Chapter 4, Membranes and Distribution). As commonly found, plasma binding is lower in neonates than adults. Yet, for phenobarbital, Vu, corrected for body weight, is the same because most of the drug is unbound in the body. Clearly, for this drug, a weight-normalized initial dose is expected to produce a similar unbound peak drug concentration in both neonates and adults or in any other age group. Digoxin is extensively distributed to the tissues and is only weakly bound to plasma proteins, yet there appears to be little or no change in the unbound volume of distribution, implying no change in tissue binding with age. For phenytoin, there is a decrease in binding to plasma proteins (fu doubles) in the neonate, but most of the drug is located in the tissues as well, so that again no change in the weight-normalized dose is needed. For all three drugs then, a given amount in the body per kilogram gives the same unbound concentration in both groups. Consequently, the same weight-corrected loading dose, if required, should suffice.
A loading dose correction should also be considered for emaciated and obese adult patients. The difference in loading dose may not be as great as anticipated from body weight alone. However, as with age-related changes in distribution, much depends on the physicochemical properties of the drug. Digoxin and polar drugs, for example, do not partition well into fat. Accordingly, for these drugs, Vu correlates better with lean body mass (body weight minus fat content), which is similar in obese and average persons of the same height and frame, than with total body weight.
Maintenance Dosing Rate. Because renal and hepatic functions (and body weight) change dramatically with age, especially in early childhood, some adjustment in dosing rate is clearly needed. The primary question is how much the usual adult dosage regimen should be adjusted. To maintain the same systemic exposure, the rate of administration must be adjusted to match the change anticipated in elimination, the subject of the next section.
CHANGE IN PHYSIOLOGIC FUNCTIONS AND DRUG DISPOSITION WITH AGE
CREATININE CLEARANCE AND RENAL FUNCTION
Figure 14-7 shows changes with age in half-life and clearance of creatinine expressed per kilogram of body weight. Creatinine distributes into total body water spaces, is negligibly bound to tissue or plasma constituents, is eliminated almost entirely by renal excretion, and has a clearance essentially equal to the glomerular filtration rate (GFR). The example of creatinine is chosen because changes in total body water and glomerular filtration rate with age are well understood. To the extent that creatinine clearance mimics that of other drugs, the data displayed in Fig. 14-7 further our understanding of age-related changes in pharmacokinetics and suggest a means of individualizing dosage regimens for age. Let us consider the various parts of Fig. 14-7 in some detail.
Neonates and Infants. Clearance, if normalized for body weight, is depressed in the neonate, but increases rapidly to reach a maximum value at 6 months, when it is more than twice that in the typical 60-year-old adult patient. The change is particularly rapid in the first week after birth, as shown in Fig. 14-8 and is often referred to as postnatal maturation of renal function. Thus, creatinine clearance in this age range can be thought of as the product of an adjustment based on body size and a maturation component. After about 6 months of age, weight-normalized clearance begins to fall but still remains, throughout childhood, considerably above the adult value.
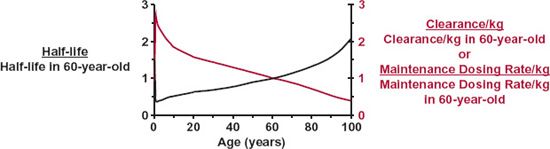
FIGURE 14-7. How half-life (left scale, black line) and both clearance and maintenance dosing rate (right scale, colored line) of a drug might vary with age. The values were calculated from data on creatinine. The drug, like creatinine, distributes into total body water, is not bound in plasma or tissues, and is eliminated entirely by renal excretion with a clearance equal to the glomerular filtration rate. Half-life is expressed as a fraction of the average value for a typical 60-year-old adult patient; the dosage regimen is calculated assuming that the desired average plateau unbound concentration remains constant throughout life. Notice that because of poor renal function, elimination is slow in the neonate, but improves rapidly such that, by 1 year, half-life is about one half the adult value. During childhood and adolescence, the half-life becomes longer because clearance, a function of surface area, increases more slowly with growth than does volume of distribution, a function of body weight. Although body weight, and therefore, volume of distribution change only slightly beyond 30 years, half-life is longer in the elderly, because renal function, and therefore, clearance progressively diminish. By 90 years, half-life is 1.6 times the typical adult value. These changes in clearance and weight with age explain why the maintenance dose per kilogram of body weight is higher in the child and lower in both the neonate and the aged than in the typical adult patient.
The data used in the calculations were obtained as follows: half-life—calculated from volume of distribution and clearance. Half-life in an average adult (60 years) is 5.9 hr. Volume of distribution: taken as 78% of body weight at birth, 67% of body weight at 6 months, and 60% of body weight thereafter (Friis-Hansen B. Changes in body water compartments during growth. Acta Paediatr 1956;110:1–68). Clearance: at birth, taken as inulin clearance, 3 mL/min (Weill WB. The evaluation of renal function in infancy and childhood. Am J Med Sci 1955;229:678–694); between 6 months and 20 years, calculated by multiplying creatinine clearance, 120 mL/min/per 1.8 m2 in an average, healthy, young adult of 21 to 29 years, by body surface area; between 30 and 99 years, taken from the data of Siersbaek-Nielsen (From: Siersbaek-Nielsen K, Hansen JM, Kampmann J, Kristensen M. Rapid evaluation of creatinine clearance. Lancet 1971;1:1133–1134). Surface area—calculated from body weight (kg) using the relationship: surface area (m2) 1.73 · (Weight/70)0.75.
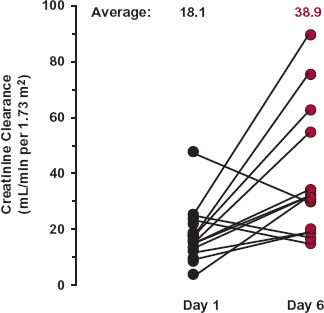
FIGURE 14-8. Creatinine clearances of neonates on Day 1 and Day 6 after birth. Although three of the neonates showed a decrease in creatinine clearance, the average was essentially doubled in this short postnatal period. (From: Sertel H, Scopes J. Rates of creatinine clearance in babies less than 1 week of age. Arch Dis Child 1973;48:717–720.)
Because total body water as a percent of body weight, and hence distribution, changes relatively little during life (78% in neonates to 60% in adults), the change in creatinine half-life inversely reflects the change in clearance. That is, the half-life is shortest around 1 year of age; it is longer in both newborn and elderly patients. Similar age-related trends in renal clearance of drugs are observed.
In the premature newborn, creatinine clearance is even more depressed per kilogram of body weight than in full-term neonates. Creatinine clearance appears to increase exponentially by a factor of 8 between weeks 28 and 40, as shown in Fig. 14-9. The data indicate that creatinine clearance during the first few weeks after birth is predicted by conceptional age (time since conception). Dosing requirements for a drug that is primarily excreted unchanged during this period may be approximated from knowledge of the conceptional age; however, the requirements, as reflected by creatinine clearance, are rapidly changing and must be continually updated.
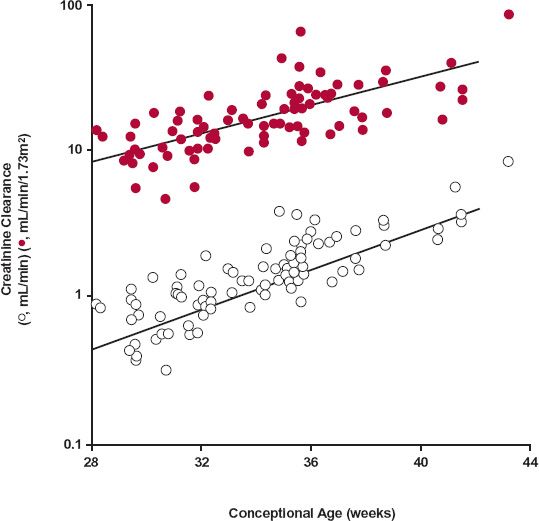
FIGURE 14-9. Creatinine clearance, corrected (colored circles) and uncorrected (open circles) for body surface area, plotted versus conceptional age. The normal full term is 40 weeks. The lines represent the best fit of an exponential equation to the data. For the upper and lower curves, the equations are CLcr (mL/min/1.73 m2
Stay updated, free articles. Join our Telegram channel

Full access? Get Clinical Tree


