Acid–base disorders: diagnosis and management

24


Acid–base disorders


diagnosis and management


Specimens for blood gas analysis


[H+] and PCO2 are measured directly in an arterial blood sample. This is usually taken from the brachial or radial arteries into a syringe that contains a small volume of heparin as an anticoagulant. It is important to exclude air from the syringe before and after the blood is collected. When the sample has been taken, any air bubbles in the sample should be expelled before the syringe is capped for immediate transport to the laboratory. Ideally, the syringe and its contents should be placed in ice during transit.


Acid–base problems may be discussed by referring to the three ‘components’ of the bicarbonate buffer system. In practice, blood gas analysers measure the [H+] of the sample and its PCO2. There is no need to measure the third variable, the bicarbonate. By the law of mass action:


image


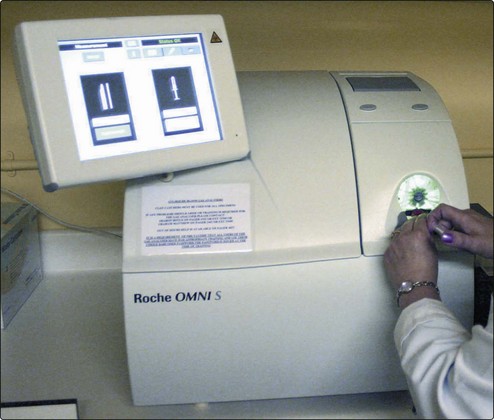
If the [H+] and the PCO2 are known, the bicarbonate can be calculated. Indeed, blood gas analysers (Fig 24.1) are programmed to provide this on all samples, as the ‘standard bicarbonate’ i.e. under standard conditions. Other parameters usually included are the PO2, and the base excess, another way of assessing the metabolic component.


In many laboratories, bicarbonate concentration is also determined directly as part of the electrolyte profile of tests on the laboratory’s main analyser, usually on a serum specimen obtained from a venous blood sample. These results (described as ‘total CO2’) are not identical to the printout from the blood gas analyser nor should this be expected since they include dissolved carbon dioxide, carbonic acid and other carbamino compounds. However, the results should not differ by more than 3 mmol/L. They may, therefore, be interpreted in the same way. A low bicarbonate in an electrolyte profile will usually indicate the presence of a metabolic acidosis.


Interpreting results


The most important information available for the interpretation and classification of an acid-base disorder is provided by the patient’s clinical history. The predicted compensatory responses in [HCO3] or PCO2 when [H+] changes as a result of primary acid–base disorders are shown in Table 24.1.


A practical approach to the interpretation of blood gas results is shown in Figure 24.2. The steps in classifying the acid–base disorder are:

Only gold members can continue reading. Log In or Register to continue

Stay updated, free articles. Join our Telegram channel

Jun 18, 2016 | Posted by in BIOCHEMISTRY | Comments Off on Acid–base disorders: diagnosis and management

Full access? Get Clinical Tree

Get Clinical Tree app for offline access