Transport of carbon dioxide
The CO2 produced in tissue cells diffuses freely down a concentration gradient across the cell membrane into the ECF and red cells. This gradient is maintained because red blood cell metabolism is anaerobic, so that no CO2 is produced there, and the concentration remains low. The following reactions then occur:
(3.1) 
(3.2) 
Reaction 3.1, the hydration of CO2 to form carbonic acid (H2CO3), is slow, except in the presence of the catalyst carbonate dehydratase (also known as carbonic anhydrase). This limits its site in the blood mainly to erythrocytes, where carbonate dehydratase is located. Reaction 3.2, the ionisation of carbonic acid, then occurs rapidly and spontaneously. The H+ ions are mainly buffered inside the red cell by haemoglobin (Hb). Hb is a more effective buffer when deoxygenated, so its buffering capacity increases as it passes through the capillary beds and gives up oxygen to the tissues. Bicarbonate ions, meanwhile, pass from the erythrocytes down their concentration gradient into plasma, in exchange for chloride ions to maintain electrical neutrality.
In the lungs, the PCO2 in the alveoli is maintained at a low level by ventilation. The PCO2 in the blood of the pulmonary capillaries is therefore higher than the PCO2 in the alveoli, so the PCO2 gradient is reversed. CO2 diffuses into the alveoli down its concentration gradient, and is excreted by the lungs. The above reaction sequence shifts to the left, carbonate dehydratase again catalysing reaction 3.1, but this time in the reverse direction.
Renal mechanisms for HCO3– reabsorption and H+ excretion
Glomerular filtrate contains the same concentration of HCO3– as plasma. At normal HCO3–, renal tubular mechanisms are responsible for reabsorbing virtually all this HCO3–. If this failed to occur, large amounts of HCO3– would be lost in the urine, resulting in an acidosis and reduction in the body’s buffering capacity. In addition, the renal tubules are responsible for excreting 40–80 mmol of acid per day under normal circumstances. This will increase when there is an acidosis.
The mechanism of reabsorption of HCO3– is shown in Figure 3.1. HCO3– is not able to cross the luminal membrane of the renal tubular cells. H+ is pumped from the tubular cell into the lumen, in exchange for Na+. The H+ combines with HCO3 to form H2CO3 in the lumen. This dissociates to give water and CO2, which readily diffuses into the cell. In the cell, CO2 recombines with water under the influence of carbonate dehydratase to give H2CO3. This dissociates to H+ and HCO3–. The HCO3– then passes across the basal membrane of the cell into the interstitial fluid. This mechanism results in the reabsorption of filtered HCO3–, but no net excretion of H+.
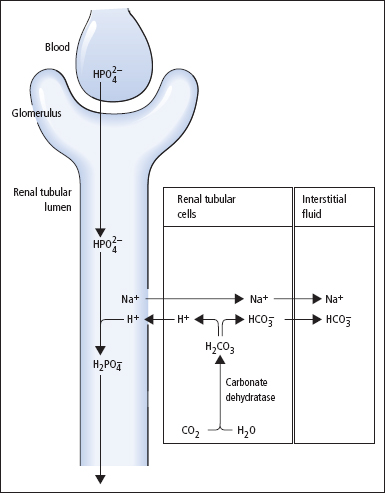
The net excretion of H+ relies on the same renal tubular cell reactions as HCO3– reabsorption, but occurs after luminal HCO3– has been reabsorbed, and depends on the presence of other suitable buffers in the urine (Figure 3.2). The main urinary buffer is phosphate, most of which is present as HPO4–, which can combine with H+ to form H2PO4–. Ammonia can also act as a urinary buffer, and is formed by the deamination of glutamine in renal tubular cells under the influence of the enzyme glutaminase. Ammonia readily diffuses across the cell membrane into the tubular lumen, where it combines with H+ to form NH+4. This does not pass across cell membranes, so passive reabsorption is prevented. Glutaminase is induced in chronic acidoses, stimulating increased ammonia production and therefore increased H+ excretion in the form of NH4+ ions.
Figure 3.1 Reabsorption of bicarbonate in the renal tubule.
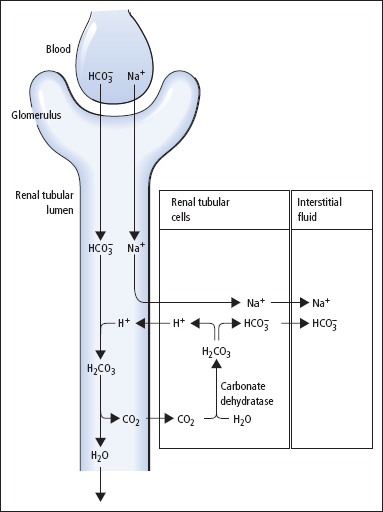
Figure 3.2 Renal hydrogen ion excretion.
Buffering of hydrogen ions
The lungs and the kidneys together maintain the overall acid–base balance. However, the ECF needs to be protected against rapid changes in [H+]. This is achieved by various buffer systems. A buffer system consists of a weak (incompletely dissociated) acid in equilibrium with its conjugate base and H+. The capacity of a buffer for H+ is related to its concentration and the position of its equilibrium, being most effective at the [H+] at which the acid and conjugate base are present in equal concentrations. Thus, Hb and plasma proteins act as efficient buffers in blood, since they are abundant, and at a physiological [H+] of approximately 40 nmol/L have side groups that exist in an appropriate equilibrium. At this [H+], the bicarbonate buffer system has an equilibrium that is far removed from the ideal, with  being about 20 times greater than [H2CO3]. However, the effectiveness of the bicarbonate system is greatly enhanced in vivo by the fact that H2CO3 is readily produced or disposed of by interconversion with CO2. Furthermore, physiological control mechanisms act on this buffer system to maintain both PCO2 and [
 ] within limits, and hence to control [H+].
Any physiological buffer system could be used to investigate and define acid–base status, but the H2CO3/ buffer system is the most appropriate for this purpose, due to its physiological importance.
The Henderson equation simply applies the law of mass action to this buffer system, to give
(3.3) 
The [H2CO3] term can be replaced by SPCO2 , where S is the solubility coefficient of CO2, since H2CO3 is in equilibrium with dissolved CO2. Substituting numerical values, at 37°C, this equation becomes
(3.4) 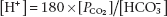
(where [H+] is measured in nmol/L, PCO2 in kilopascals (kPa) and  in mmol/L).
The changes discussed above are caused by changes in the equilibria of chemical reactions, and must be distinguished from the acid–base changes that occur as a result of respiratory or renal physiological mechanisms operating to return plasma [H+] towards normal. For example, if there is a rise in PCO2, this will be reflected immediately by a rise in both plasma [H+] and [ ] due to a shift to the right in reactions 3.1 and 3.2 above. The concentrations of H+ and
  are very different, [H+] being measured in nanomoles per litre while
  is measured in in millimoles per litre. The same rise in each may therefore result in a substantial relative increase in [H+], but a relatively imperceptible increase in
  . Only after several hours would the effect of physiological renal compensatory changes become evident.
Investigating acid–base balance
The acid–base status of a patient can be fully characterised by measuring [H+] and PCO2 in arterial or arterialised capillary blood specimens;  is then obtained by calculation (reaction 3.4). Although standard bicarbonate, and base excess or deficit are still sometimes reported, these derived values are not necessary for the understanding of acid–base disturbances.
Collection and transport of specimens
Arterial blood specimens are the most appropriate for assessing acid–base status. However, unless an arterial cannula is in situ, these specimens may be difficult to obtain for repeated assessment of patients whose clinical condition is changing rapidly. Arterialised capillary blood specimens are also widely used, especially in infants and children. It is essential for the capillary blood to flow freely, and collection of satisfactory samples may be impossible if there is peripheral vasoconstriction or the blood flow is sluggish.
Patients must be relaxed, and their breathing pattern should have settled after any temporary disturbance (e.g. due to insertion of an arterial cannula) before specimens are collected. Some patients may hyperventilate temporarily because they are apprehensive.
Blood is collected in syringes or capillary tubes that contain sufficient heparin to act as an anticoagulant; excess heparin, which is acidic, must be avoided. If ionised Ca2+ is to be measured on the same specimen, as is possible with some instruments, calcium-balanced heparin must be used. Specimens must be free of air bubbles, since these will equilibrate with the sample causing a rise in PO2 and a fall in PCO2.
Acid–base measurements should be performed immediately after the sample has been obtained, or the specimen should be chilled until analysis. Otherwise, glycolysis (with the production of lactic acid) occurs, and the acid–base composition of the blood alters rapidly. Specimens chilled in iced water can have their analysis delayed for as long as 4 h. However, the clinical reasons that gave rise to the need for full acid–base studies usually demand more rapid answers.
Temperature effects
Acid–base measurements are nearly always made at 37°C, but some patients may have body temperatures that are higher or lower than 37 °C. Equations are available to relate [H+], PCO2 and PO2 determined at 37 °C, to ‘equivalent’ values that correspond to the patient’s body temperature. However, reference ranges for acid–base data have only been established by most laboratories for measurements made at 37 °C. Analytical results adjusted to values that would have been obtained at the patient’s temperature, according to these equations, may therefore be difficult to interpret. If treatment aimed at reducing an acid–base disturbance (e.g. NaHCO3 infusion) is given to a severely hypothermic patient, the effects of the treatment should be monitored frequently by repeating the acid–base measurements (at 37 °C).
Disturbances of acid–base status
Acid–base disorders fall into two main categories, respiratory and metabolic.
- Respiratory disorders A primary defect in ventilation affects the PCO2.
- Metabolic disorders The primary defect may be the production of non-volatile acids, or ingestion of substances that give rise to them, in excess of the kidney’s ability to excrete these substances. Alternatively, the primary defect may be the loss of H+ from the body, or it may be the loss or retention of
 .
.
Acid–base status can be understood and described on the basis of the relationships represented by reactions 3.1 and 3.2, and consideration of the Henderson equation. The following discussion is restricted mainly to consideration of simple acid–base disturbances, in which there is a single primary disturbance, normally accompanied by compensatory physiological changes that usually tend to correct plasma [H+] towards normal. We shall not consider mixed disturbances, where two or more primary simple disturbances are present, in any detail. Sets of illustrative acid–base results for patients with the four categories of simple disorders of acid–base status are given in Table 3.1.
Respiratory acidosis
This is caused by CO2 retention due to hypoventilation (Table 3.2). It may accompany intrinsic lung disease, or defects in the control of ventilation, or diseases affecting the nerve supply or muscles of the chest wall or diaphragm, or disorders affecting the ribcage.
In acute respiratory acidosis, a rise in PCO2 causes the equilibria in reactions 3.1 and 3.2 to shift to the right, as a result of which plasma [H+] and [ ] both increase (although, as explained above, because of the large difference in their basal concentrations, the change in [
 ] will be relatively small or imperceptible). Equilibration of H+ with body buffer systems limits the potential rise in [H+], and a new steady state is achieved within a few minutes.
Unless the cause of the acute episode of acidosis is resolved, or is treated quickly and successfully, renal compensation causes  retention and H+ excretion, thereby returning plasma [H+] towards normal while
  increases. These compensatory changes can occur over a period of hours to days, by which time a new steady state is achieved and the daily renal H+ excretion and
  retention return to normal. The patient then has the pattern of acid–base abnormalities of chronic respiratory acidosis.
Table 3.1 Illustrative data for patients with simple disturbances of acid–base balance
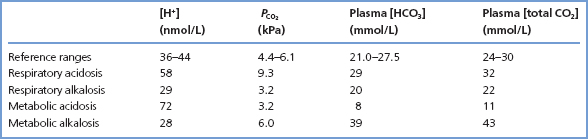
Table 3.2 Respiratory acidosis
| Mechanism | Examples of causes |
| Alveolar PCO2 increased due to defect in respiratory function | Pulmonary disease–chronic bronchitis, severe asthma, pulmonary oedema, fibrosis |
| Mechanical disorders– thoracic trauma, pneumothorax, myopathies | |
| Alveolar PCO2 increased | CNS disease–stroke, trauma |
| due to defect in respiratory control mechanisms | CNS depression – anaesthetics, opiates, severe hypoxiaxs |
| Neurological disease–motor neuron disease, spinal cord lesions, poliomyelitis |
Table 3.3 Respiratory alkalosis
| Mechanism | Examples of causes |
| Alveolar PCO2 lowered due to hyperventilation | Voluntary hyperventilation, mechanical ventilation |
| Reflex hyperventilation–chest wall disease, decreased pulmonary compliance | |
| Stimulation of respiratory centre-pain, fever, salicylate overdose, hepatic encephalopathy, hypoxia |
Respiratory alkalosis
This is due to hyperventilation (Table 3.3). The reduced PCO2 that results causes the equilibrium positions of reactions 3.1 and 3.2 to move to the left. As a result, plasma [H+] and  both fall, although the relative change in
  is small.
If conditions giving rise to a low PCO2 persist for more than a few hours, the kidneys increase  excretion and reduce H+ excretion. Plasma [H+] returns towards normal, whereas plasma
  falls further. A new steady state will be achieved in hours to days if the respiratory disorder persists. It is unusual for chronic respiratory alkalosis to be severe, and plasma
  rarely falls below 12 mmol/L.
Table 3.4 Metabolic acidosis
| Mechanism | Examples of causes |
| Increased H+ production in excess of body’s excretory capacity |


