, Eric J. Rees1 and Gabriele S. Kaminski Schierle1
(1)
Department of Chemical Engineering and Biotechnology, University of Cambridge, Cambridge, UK
Abstract
Förster resonance energy transfer (FRET) has become one of the most ubiquitous and powerful methods to quantify protein interactions in molecular biology. FRET refers to the sensitization of an acceptor molecule through transfer of energy from a nearby donor, and it can occur if the emission band of the donor exhibits spectral overlap with the absorption band of the acceptor molecule. Numerous methods exist to quantify FRET levels from interacting protein labels including fluorescence lifetime, acceptor photobleaching, and polarization-resolved imaging (Lakowicz, Principles of fluorescence spectroscopy, 2006; Jares-Erijman and Jovin, Curr Opin Chem Biol 10(5):409–416, 2006; van Munster and Gadella, Microscopy techniques, 2005). For live cell imaging, however, sensitized emission FRET (seFRET) is the most powerful and robust method of FRET signal quantification (Chakrabortee et al., Proc Natl Acad Sci USA 107(37):16084–16089, 2010). It is fast, can be applied using straight forward microscopy equipment, and offers information not only on strength of interaction but, uniquely, also on the relative changes between interacting and noninteracting moieties in the reaction, referred to as FRET stoichiometry. A rigorous and quantitative application of seFRET is far from trivial, however, and requires appropriate calibration experiments and constructs, control over hardware settings, and appropriate image processing steps.
This protocol presents a rigorous method to perform quantitative seFRET measurements in live cells, providing the maximum possible information content from the measurement. The theoretical development and validation of the method is described in detail in Elder et al. (J R Soc Interface 6:S59–S81, 2009) where it is also demonstrated in the kinetic (“time-lapse”) analysis of protein interactions governing mitosis. The present protocol gives a detailed recipe for application of seFRET. It is written specifically for use with CFP (cyan fluorescence protein) as donor fluorophore and YFP (yellow fluorescent protein) as acceptor fluorophore, a popular choice for many experiments. The protocol is however valid for any other FRET fluorophore pair, and we indicate how to adapt the protocol in such situations. We also provide a software program that automates the calibration tasks outlined in this protocol and which is available for free to download (http://wiki.laser.ceb.cam.ac.uk/wiki/index.php/Resources).
Key words
FluorescenceFRETFörster resonance energy transferLive cell imagingMicroscopySensitized emission1 Introduction to seFRET Methodology
Sensitized emission FRET (seFRET) is one of the key microscopy techniques for measuring FRET efficiency: it is particularly well suited to measurements in which both acceptor- and donor-normalised FRET efficiencies need to be determined, and in this role it can be superior to alternative FRET imaging methods such as fluorescence lifetime, acceptor photobleaching and polarisation resolved measurements [1–4].
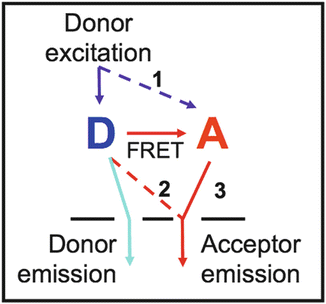
The principal features of seFRET measurements are shown in Fig. 1. Two fluorescence filter sets are required: one which is optimized to detect fluorescence from the donor (“donor emission channel,” here CFP) and similarly one optimized for emission from the acceptor (“acceptor emission channel,” here YFP).


Fig. 1
Principle of seFRET
Excitation of the donor molecule, D (solid blue arrow), leads to fluorescence emission into the donor emission channel (light blue). In the absence of acceptors and FRET, this is the only signal emitted. If FRET occurs (red arrow, labeled FRET), the acceptor molecule, A, becomes sensitized, and the seFRET signal emitted from A is detected in the acceptor channel. This is indicated as pathway 3 (solid red arrow). The efficiency of energy transfer from D to A is denoted by E, and the so-called Förster radius is defined to be the distance at which E = 50 %.
However, in practice the seFRET signal is contaminated by signal cross talk. There are two contributions to cross talk in seFRET based on the CFP/YFP—and most other fluorophore—pairings. Cross excitation refers to the direct excitation of the acceptor at the donor excitation wavelength (path 1, dashed blue arrow). For example, YFP has a finite probability of being excited at the CFP excitation wavelength. Contamination also arises from donor bleed through (path 2, red dashed red arrow), e.g., CFP fluorescence will leak into the YFP fluorescence band. Signal cross talk is indistinguishable from the true seFRET signals and, if unaccounted for, can generate false positives.
To correct for these effects, we calculate a corrected seFRET efficiency, which we refer to as cFRET [5], to yield


Here the first term on the right-hand side denotes the uncorrected signal, the second term accounts for the acceptor cross excitation, and the last term for the donor bleed through. Table 1 denotes the nomenclature in detail.
Table 1
Quantities required to correct for signal cross talk in seFRET
I DA | Uncorrected “FRET” signal: signal in acceptor channel upon donor excitation |
AER | Acceptor excitation ratio: corrects for direct excitation of acceptor (path 1 in Fig. 1) |
DER | Donor emission ratio: determines bleed through of donor fluorescence into the acceptor channel (path 2 in Fig. 1) |
I AA | Signal obtained in acceptor channel, upon excitation at acceptor excitation wavelength |
I DD | Signal obtained in donor channel, upon excitation at the donor excitation wavelength |
The AER and DER are dye-specific parameters that are ideally constant for a given sample and can be determined from control samples containing, respectively, donor (CFP)-only and acceptor-only (YFP).
A measureable value for cFRET signifies that FRET takes place between donor and acceptor; however, its value also depends on the stoichiometries of free donors and acceptors and interacting FRET pairs. To obtain information on the relative number of free and interacting fluorophores, we further normalize cFRET by either the acceptor or the donor concentration. This leads to the finally sought quantities:
 and
and


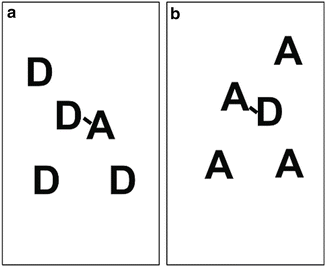
The nomenclatures for the terms in these equations are given in Table 2. dFRET is the true FRET efficiency E normalized by χ D which is the fraction of the donor molecules that undergo FRET. Similarly aFRET is the acceptor-normalized FRET efficiency. The two may be significantly different as Fig. 2a, b illustrate. For the situation depicted in Fig. 2a, we have aFRET >> dFRET signifying that the number of donor molecules participating in FRET interactions is much smaller than the number of acceptor molecules. Similarly in Fig. 2b, the opposite is true. The evolution of aFRET and dFRET and their interdependence thus offer important information in the stoichiometry of biological interactions, information that is usually hidden in other modalities of performing FRET (e.g., lifetime measurements). Examples of how this can be used to follow kinase activity in living cells are given in [5].

Table 2
Nomenclature of seFRET calibration constants
 | Donor-normalized FRET efficiency (i.e., fraction of interacting donor χ D times FRET efficiency E) |
 | Acceptor-normalized FRET efficiency (i.e., fraction of interacting acceptor χ A times FRET efficiency E) |
 | Relates to relative quantum yields and signal detection efficiencies between donor and acceptors |
 | Relates to line shapes and excitation efficiencies of donor and acceptor molecules |

Fig. 2
Illustration to exemplify the difference between donor-normalized and acceptor-normalized FRET values. In (a) there is an abundance of noninteracting donors, whereas all acceptors are interacting. Here dFRET is less than aFRET. In (b) there is an overabundance of acceptor, and the opposite holds true. A simultaneous determination of aFRET and dFRET thus establishes both whether energy transfer is taking place and also whether there is an overabundance of noninteracting donors/acceptors
In what follows we give a recipe on how to quantify aFRET and dFRET in biological samples. Example MATLAB scripts are provided together with example data as a guide to performing the image processing required for seFRET.
2 Materials
2.1 Biological Sample Preparation
In addition to the biological FRET sample of interest, three control samples are required to determine α, β, DER, and AER (see Note 1):
1.


Donor-only control sample (used as negative control and for determination of DER): Transfect cells (the protocol is verified for mammalian cells) using the CFP-tagged protein of interest (see Note 2).
Stay updated, free articles. Join our Telegram channel

Full access? Get Clinical Tree


