While Lean doesn’t require many tools other than a pad of Post-it Notes, Six Sigma thrives on charts, graphs, and diagrams of performance data. At the Institute for Healthcare Improvement (IHI) Conference in 2015, Don Berwick asked everyone to recommit to improvement science—control charts, Pareto charts, and histograms of performance. He sounded annoyed with the lack of use of Lean Six Sigma tools and methodologies. I understand his frustration. I was there in 2006 when he asked everyone to “pledge allegiance to science and evidence.” Over the years, I’ve done a stroke tally of the quality tools used in IHI poster presentations. I gave each poster one checkmark for each type of tool used (Figure 7.1).
FIGURE 7.1
IHI use of Six Sigma tools.
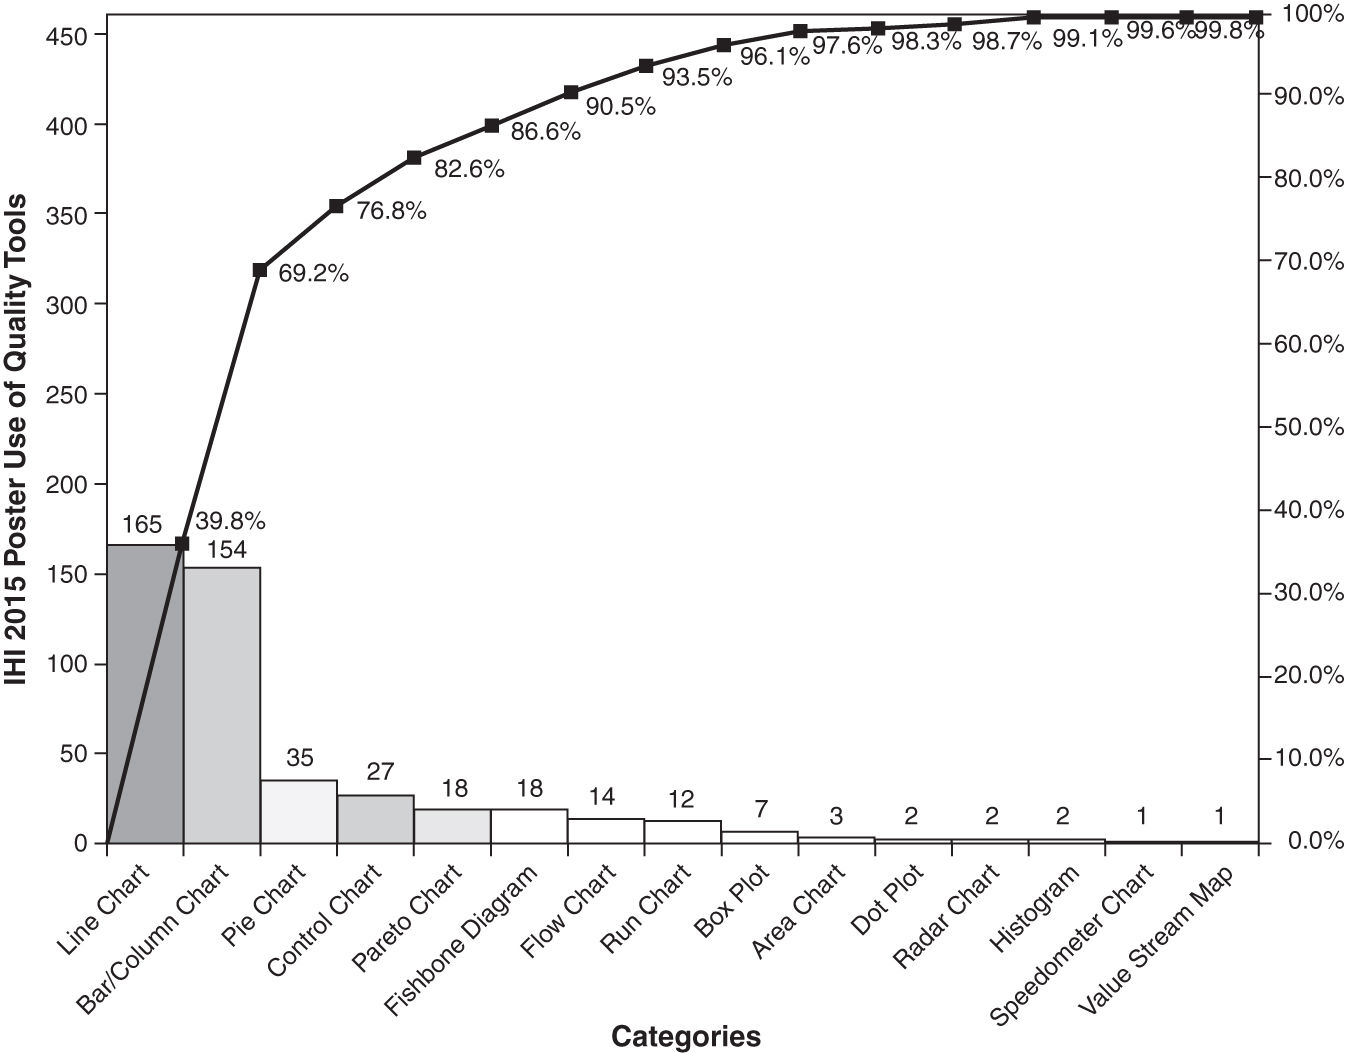
Sadly, even with all the emphasis on control charts, Pareto charts, and other tools of quality, they are used rarely in poster presentations. The vast majority are Excel line, bar, or column charts. This is like using an old rotary dial telephone instead of a smart phone. Basic Excel charts can’t tell you much about your process, but control charts, Pareto charts, and histograms have much needed intelligence about performance.
TREND LINES CAN TELL LIES
I was reading an old issue of the Joint Commission Journal on Quality and Patient Safety. In an article about patient falls, the authors used a run chart with a trend line to assert that they had achieved a 9.9 percent reduction in patient falls (Figure 7.2).
FIGURE 7.2
Line graph of patient falls with trend line.
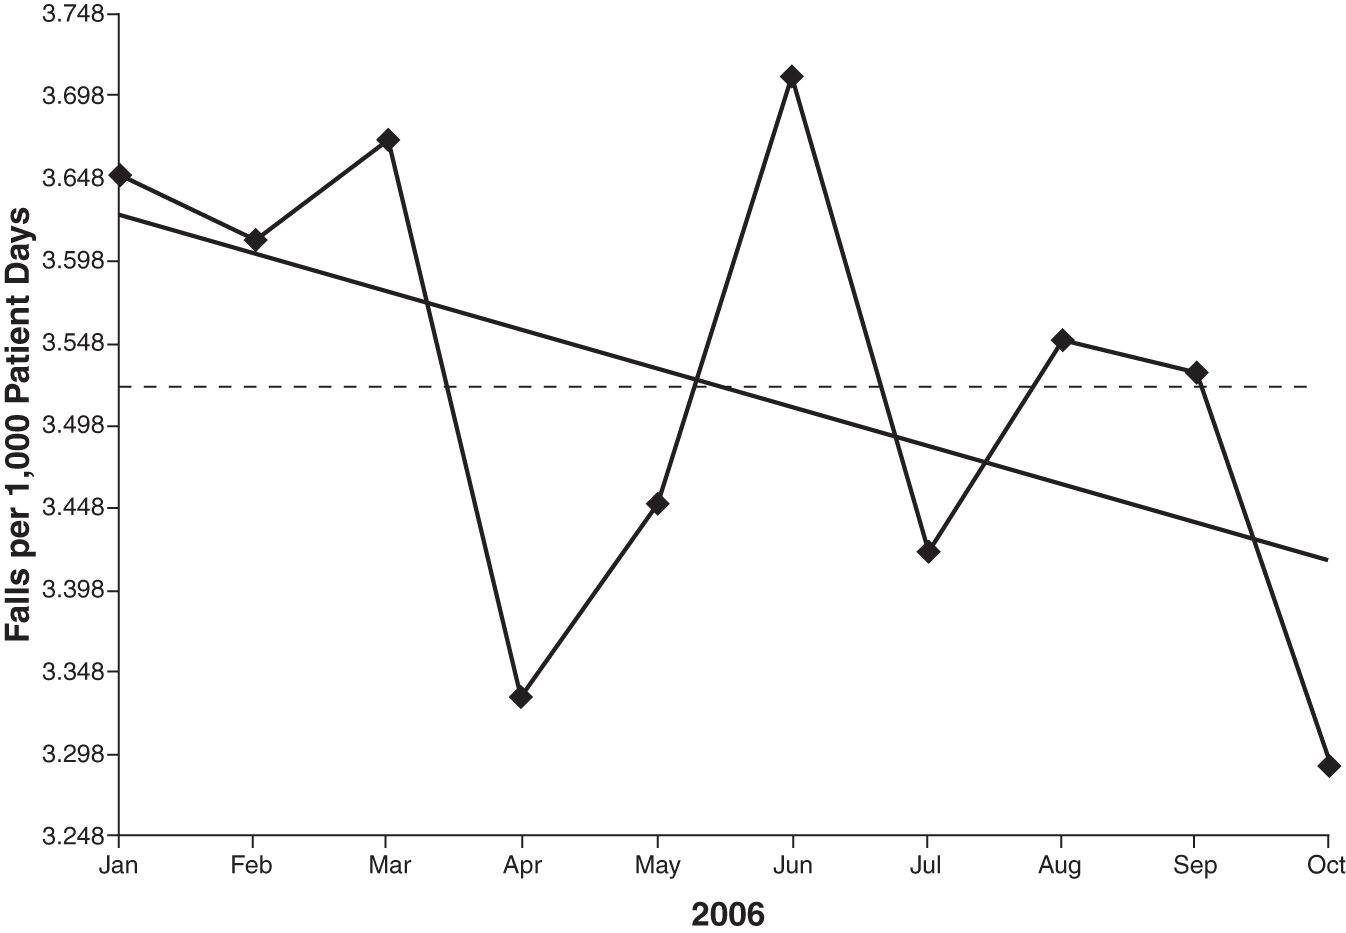
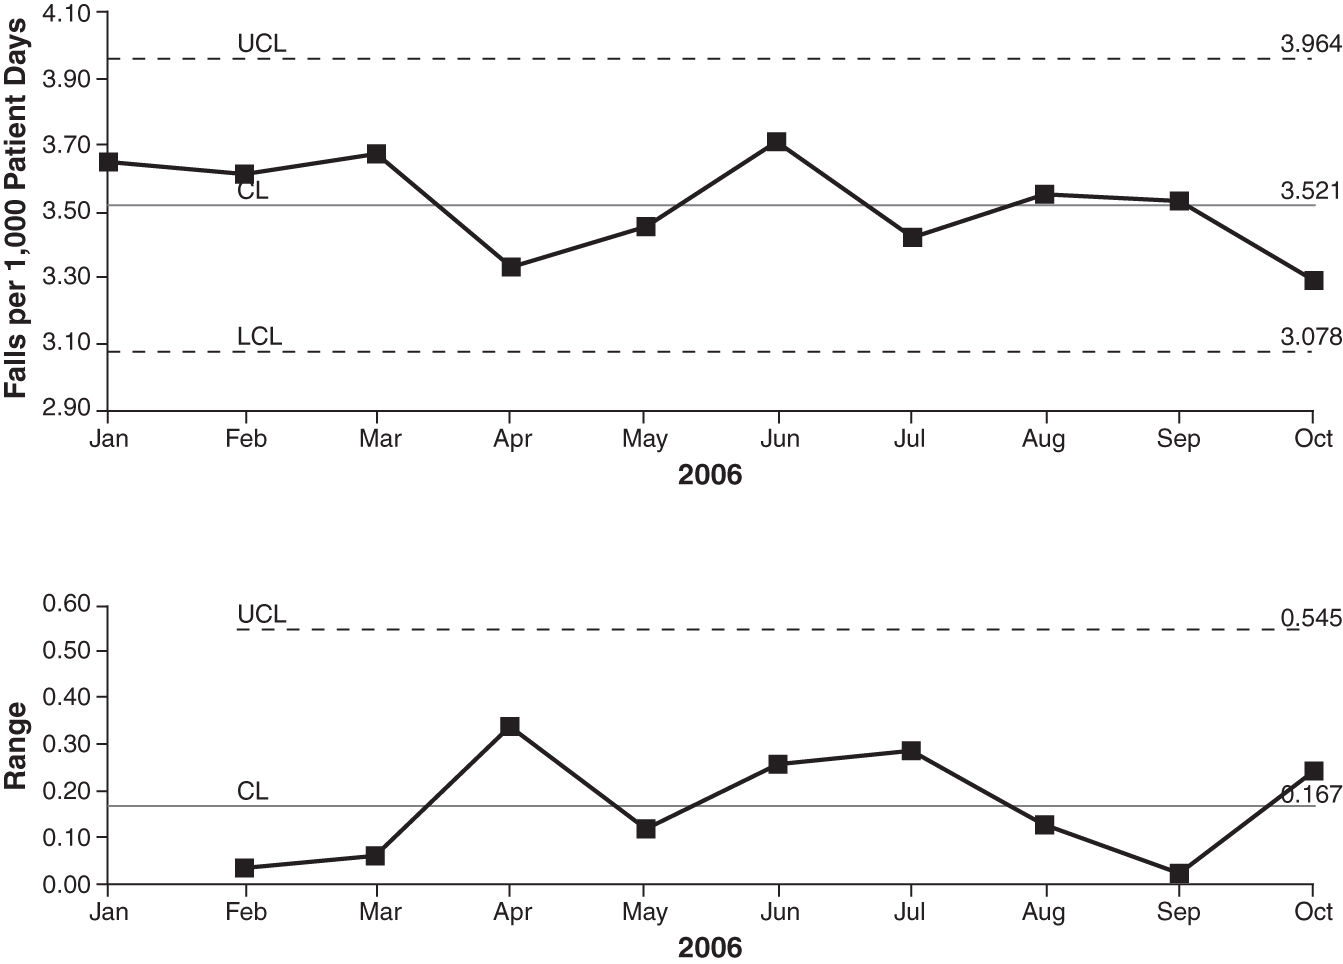
The trend line suggests a trend, but does one exist? If we use an XmR control chart to plot the same data (Figure 7.3), we find that the process is stable and unchanged; the trend line has lied about the improvement. This is why primitive line charts, run charts, and trend lines can be so misleading—they aren’t statistically useful. You will need a control chart to detect actual changes in performance.
FIGURE 7.3
XmR control chart of patient falls.
The 2015 IHI sessions on high-reliability healthcare (e.g., Memorial Hermann) suggest that zero defects are possible with Lean Six Sigma and change management—basically “improvement science.” You cannot get to zero harm without using these tools. To succeed at using Six Sigma to achieve zero harm, you’ll need a set of power tools, but you won’t need every tool in the Six Sigma toolkit. You will mainly need:
 Excel PivotTables to summarize and categorize data from electronic systems. See the video at www.qimacros.com/Moneybelt/pivottable-examples.html.
 XmR (ImR) control charts to monitor ratios (e.g., falls per 1,000 patient days) and turnaround times. See the video at www.qimacros.com/Moneybelt/six-sigma-spc-healthcare-XmR-chart-video.html.
 g control charts of “never” events.
 Pareto charts to categorize types of defects (e.g., medication errors). See the video at www.qimacros.com/Moneybelt/pareto-chart.html.
 Histograms to analyze turnaround times, length of stay, and so on. See the video at www.qimacros.com/Moneybelt/histogram.html.
 Ishikawa (fishbone) diagrams for root-cause analysis. See the video at www.qimacros.com/Moneybelt/ishikawa-fishbone-diagram.html.
 Matrix diagrams such as countermeasures and action plans. See the video at www.qimacros.com/Moneybelt/Countermeasures.html.
What Is a Control Chart?
Progress [in the control of quality] has been slow. … it requires the application of statistical methods, which up to the present time have been for the most part left undisturbed in the journals in which they appeared.
The first step in improvement is evaluating performance about defects, mistakes, errors, and turnaround times. It doesn’t matter if it’s medication errors or patient falls, defects, waste, and rework are consuming a third of most hospital budgets. You can use control charts to measure and monitor the performance of any process—medication errors or door-to-balloon times. Without control charts, you cannot sustain improvements. This is a key reason why so many hospital improvement projects fall back to previous levels of performance. See the video at www.qimacros.com/Moneybelt/what-is-a-control-chart.html.
A control chart (Figure 7.4) is made up of a few key parts:
FIGURE 7.4
The anatomy of a control chart.
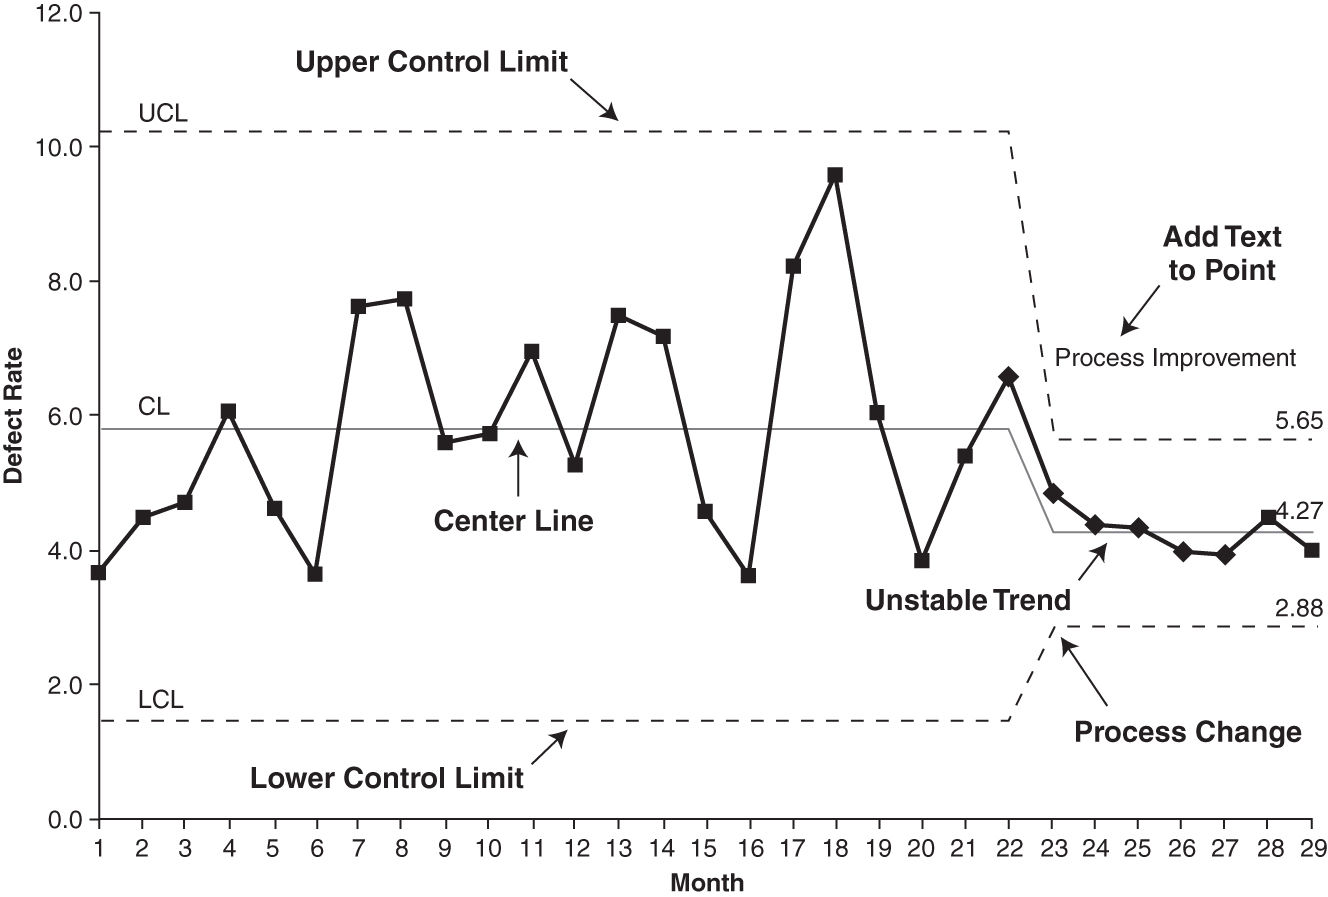
 A line graph of data that shows how a process performs over time
 A centerline (average or median) calculated from the data
 An upper control limit (UCL) that is 3 sigma above the centerline
 A lower control limit (LCL) that is 3 sigma below the centerline
 Stability analysis—analysis of the data that highlights unstable points or trends to be investigated. The QI Macros will do this for you. These unstable conditions should exist naturally only three times out of 1,000 data points, so to see one in 20 to 50 data points is unlikely. These special causes need to be investigated. In a stable process, 997 out of 1,000 data points will fall between the upper and lower control limits.
Control charts originated at Western Electric in the 1920s. I recently got hold of a copy of the Western Electric Statistical Quality Control Handbook (1956). I love that the Preface begins by saying: “This book is written in non-technical language, and no attempt has been made to write for the professional statistician or mathematician.” The Western Electric program focused on “the control chart, and particularly the process capability study, as the foundation of the entire program.”
The authors go on to say that “Statistical Quality Control can be applied to anything that it is possible to express in the form of numbers.” Yep, anything—manufacturing or healthcare.
What Is Statistical Quality Control?
Western Electric summed it up quite nicely:
 Statistical—with the help of numbers or data
 Quality—we study the characteristics of our process
 Control—in order to make it behave the way we want it to behave
The Power of Control Charts
So that’s it in a nutshell: control charts help us study performance in ways that make it behave the way we want it to behave. If your hospital process isn’t behaving the way you want it to, maybe it’s because you haven’t subjected it to the scrutiny of a control chart. All processes vary: “Instead of being exactly the same from point to point or from time to time, the numbers vary.”
Using Control Charts to Detect Faint Signals in the Noise of Daily Operations
One of the characteristics of a high-reliability organization (HRO) is preoccupation with failure—detecting small failures before they become big. In the book, The Signal and the Noise, author Nate Silver examines why so many predictions fail, but some don’t. The trick is in separating the signal (what’s important) from the noise (what’s not important).
I realized while reading Silver’s book that control charts detect faint signals in the noise of daily operations. Unlike Silver’s book, which focuses on predicting what will happen, control charts look backward at the performance of any hospital process to detect “out-of-control” conditions. I have come to believe that without control charts, you cannot monitor and correct a hospital’s performance or sustain improvements. And failing to sustain improvements will kill Six Sigma.
The Costs of Confusing Signals with Noise
One of the by-products of trying to run a hospital by spreadsheets alone is the ongoing tampering and knee-jerk reactions to changes. This occurs because managers look at snapshots of performance (usually bar charts of monthly performance), not the ongoing movie of performance (control charts). One of my friends in corporate finance has found that almost weekly she’d be sent on a wild goose chase to figure out why some number moved up or down. In retrospect, she has come to believe that most of those movements were noise, not signals. If she’d had control charts of the financials, she could have easily separated the signals from the noise.
Signal or Noise
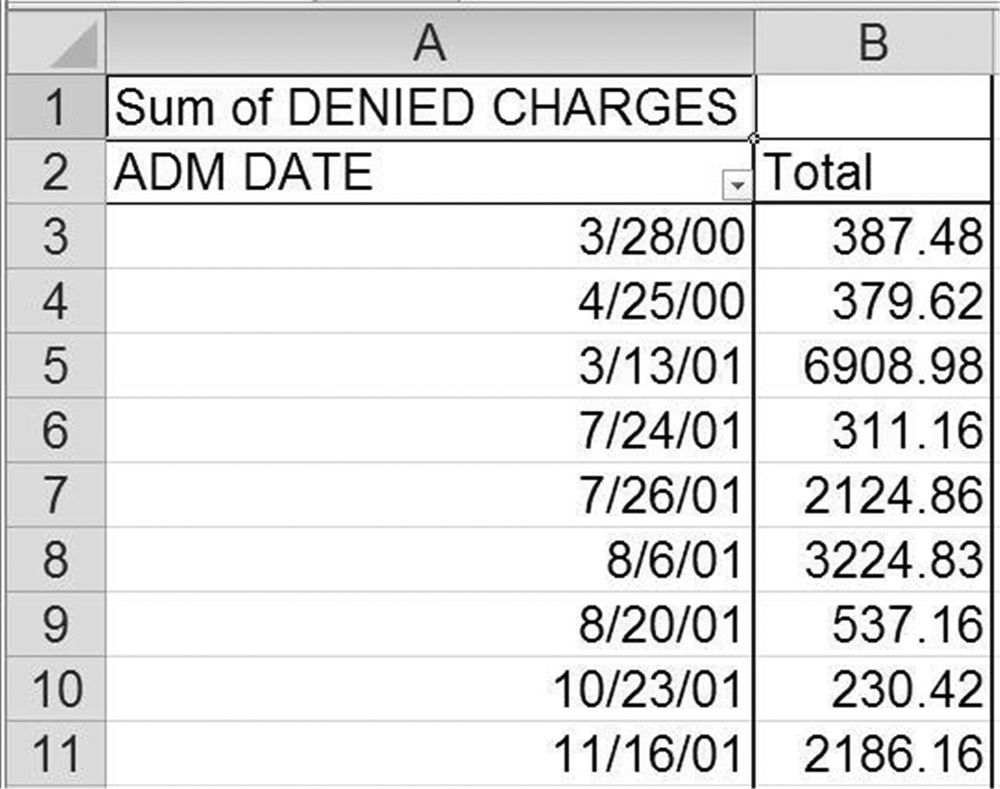
If we look at a spreadsheet of denied claims in healthcare (Figure 7.5), it’s difficult to identify the signals. Cell B5 looks high, but is it?
FIGURE 7.5
Denied claims spreadsheet.
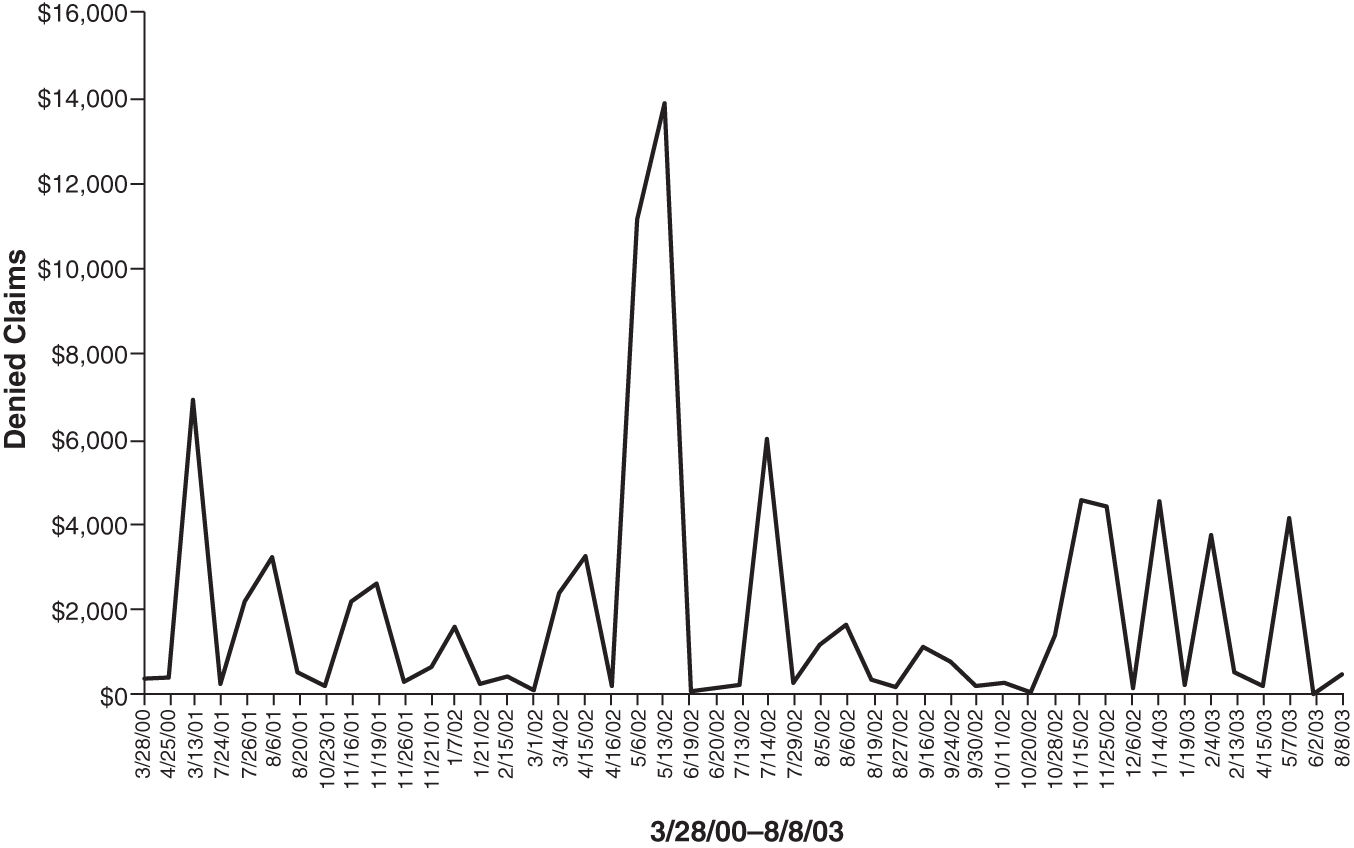
If we take performance data and chart it as a line graph (Figure 7.6), we still can’t really tell if there’s something going on. We can see a spike in May, but is it signal or noise?
FIGURE 7.6
Denied claims line graph.
But if we turn the same data into a control chart (Figure 7.7), the QI Macros will calculate upper and lower control limits (UCL/LCL) that encompass 99.7 percent of all the data. We might consider most of the points within these limits to be noise (i.e., common-cause variation). Using these limits, the software highlights points that are statistically unlikely, that is, signals or special-cause variation. We can see from the diamond-shaped points that the process is out of control.
FIGURE 7.7
Denied claims control chart.
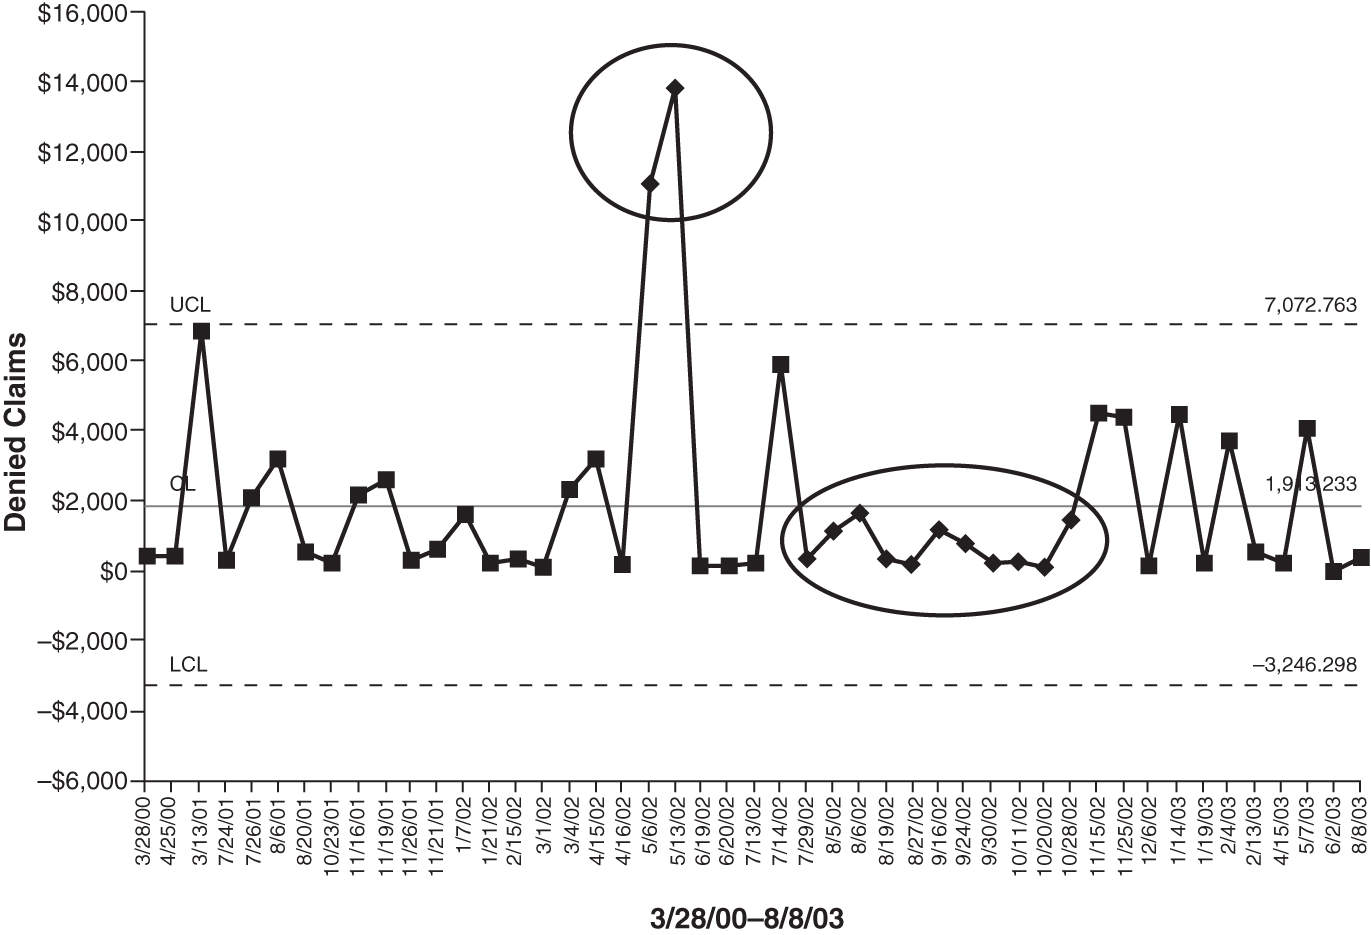
So the control chart will identify the two points in May as a signal that the process is out of control, but it will also detect that the 11 points below the average are also a signal. Using the first signal, we would seek to determine the root cause of the problem and correct it. Using the second signal, we might want to figure out what we were doing to hold down the cost of denied insurance claims. Sometimes these signals can catch your doing something right, not wrong.
Control Chart Signals
The QI Macros statistical process control (SPC) software uses calculated control limits and control chart rules to separate signals from noise. Each of the rules should occur naturally only three times out of a thousand (3:1,000). So when they appear in 20 to 50 data points, it’s very likely that they are a signal, not noise.
Once the QI Macros software detects one of these signals and highlights it by turning the point red, the next step is to immediately ask “Why?” five times to determine the root cause and correct it.
Common-Cause Variation is a Form of Noise
A stable process has no signals. Variation from point to point is just the noise of daily operations. Of course, if we wanted to reduce days to pay insurance claims to a target of 30 days, we’d need an improvement team to investigate why it takes 33.3 days on average.
Overreaction to Noise Can Make Things Worse
Using a snapshot of the data can cause managers to tamper with a stable process. Tampering with a stable process can make it unstable. If, for example, a manager reacts to point 26 in “Days to Pay Insurance Claims,” it could cause overtime to clear the backlog or some other knee-jerk reaction. This might reduce days to pay for a short while but also might cause employee burnout and increased days to pay.
If a process is stable, don’t fiddle with it. Use Lean Six Sigma to reduce the cycle time and variation. Companies that don’t use control charts consistently perform around 3 sigma (a 6 percent error rate). At this level, it costs a quarter to a third of total expenses to find, fix, or replace the defective product or service. It causes overtime and crisis management. Wouldn’t you like to cut costs by 25 to 33 percent? You can, but as you make improvements and climb to 4 or 5 sigma, you will no longer be able to detect the signals that your process is out of control. Without control charts, you will not be able to detect the subtle changes that slowly drive performance back toward 3 sigma.
Using control charts in every aspect of your business will only take a little more effort than you are spending today, but it will save a ton of rework and waste, freeing up employees to satisfy customers without the firefighting.
Learn how to use control charts to detect the signals that your process is shifting. Use them to determine whether improvement is needed and initiate improvements as needed. Use them to monitor and sustain new and improved levels of performance. Your patients will be delighted. Employee morale will improve with the improved performance. Your CFO will be delighted with the reduced costs and increased profits. And everyone from the CEO to the nurse manager will get a better night’s sleep.
Isn’t it time to add control charts to your competitive toolbox?
WHAT IS A PARETO CHART?
Pareto charts help to identify what Joseph Juran called the “vital few” things to work on. They are most commonly used with defects or the cost of defects. Pareto charts combine a sorted bar graph with a cumulative line graph (Figure 7.8). Often, two or three “big bars” on the left side of the Pareto chart represent most of the problem. The cumulative line graph tells us how much each bar contributes to the overall problem.
FIGURE 7.8
The anatomy of a Pareto chart.

Each “big bar” can be turned into a problem statement that fills out the “head” of the fishbone diagram. If you’ve ever tried to create a Pareto chart in Excel, you know how complex and time-consuming it can be. The QI Macros make it simple.
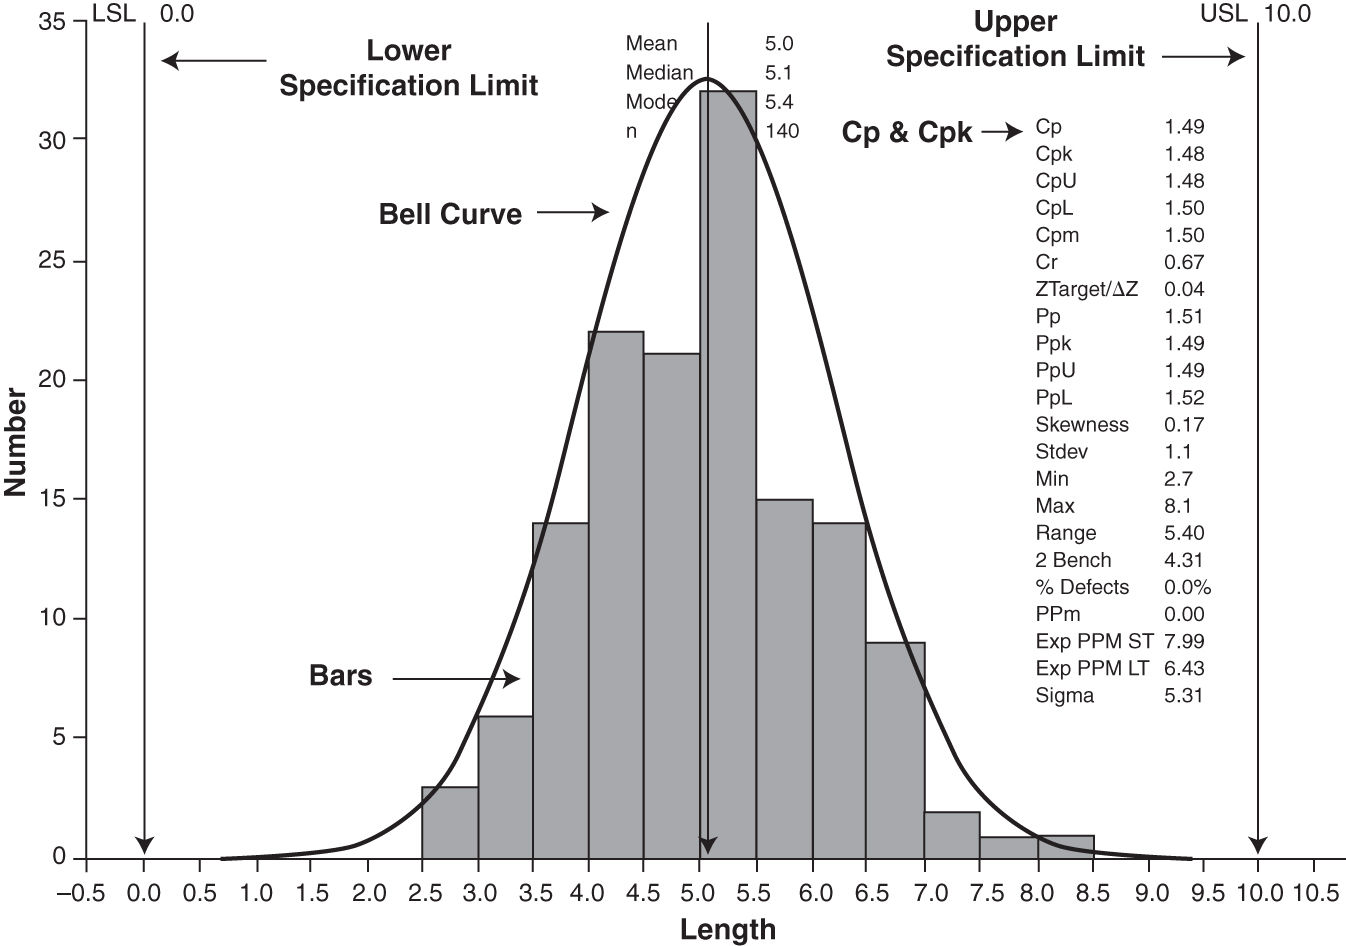
WHAT IS A HISTOGRAM?
Histograms show the spread, or dispersion, of variable data (Figure 7.9). In healthcare, these are most often used for turnaround times, wait times, and length of stay. The customer’s upper (USL) and lower specification limits (LSL) determine how well the process delivers on customer requirements. Because we’re using histograms to track cycle time, there is rarely a LSL; zero is the floor. There is almost always a USL: 90 minutes for door-to-balloon time, for example. Measurements outside the specification limits represent data points that don’t meet customer requirements.
FIGURE 7.9
The anatomy of a histogram.
WHAT IS A FISHBONE DIAGRAM?
Use the Ishikawa or fishbone diagram (Figure 7.10) to analyze the root cause of delay, waste, rework, or cost. Ask “Why?” up to five times to determine the root cause. A fishbone diagram consists of:
FIGURE 7.10
The anatomy of a fishbone diagram.

 A problem statement often derived from the “big bar” on the Pareto chart
 Main bones that represent major contributors to the problem (most commonly process)
 Cause bones developed using the Five Whys
 Root causes (circled), always be the last bone in a chain
WHAT IS A COUNTERMEASURES MATRIX?
Once you’ve completed the root-cause analysis, it’s time to identify the countermeasures required to reduce or eliminate the root causes. Like ecological weed prevention, a countermeasure prevents problems from ever taking root in a process. A good countermeasure not only eliminates the root cause but also prevents other weeds from growing. Here’s how (Figure 7.11):
FIGURE 7.11
Countermeasures matrix.

- Transfer the problem statement and the root causes from your root-cause analysis or fishbone diagram.
- For each root cause, identify one to three broad countermeasures (what to do).
- Rank the effectiveness of each countermeasure (low, medium, or high).
- Identify the specific actions (how to do it) for implementing each countermeasure.
- Rank the feasibility (time, cost) of each specific action (low, medium, or high).
- Decide which specific actions to implement.
These are the key tools you will need to analyze virtually all defects, mistakes, errors, and time delays in a hospital.
WHY GET SPC SOFTWARE?
The short answer to this question is, You can’t do Six Sigma without SPC software. When I learned quality improvement back in 1989, I had to draw Six Sigma charts by hand. I spent five days in a control chart class calculating all the formulas using a handheld calculator and drawing the various charts. Most of my fellow students and I struggled to calculate the formulas correctly. At the end of the course, the class spent only two hours on what the charts were telling us. I knew there was no way I was going to get phone company personnel to draw control charts by hand, but I couldn’t get my management to spend $1,000 on statistical process control (SPC) software, so I just struggled along.
It doesn’t matter if you use the QI Macros or something else, you will need SPC software to do Six Sigma. Without control charts, you will not be able to monitor improvements and detect subtle process shifts. Without Pareto charts, you will not be able to drill down into your data to find the breakthrough improvements needed. Without the Lean Six Sigma templates, you will waste time re-creating nonstandard tools to document your improvement project.
Why might you consider using the QI Macros software? Because it shrinks the learning curve from several days to a few minutes. Go to www.qimacros.com/trial/hospitalbook to download your free 90-day trial. I’ll discuss the QI Macros because they are used in 3,000 hospitals in the United States.
After I left the phone company in 1995, I started experimenting with using Excel to draw all the charts necessary for Lean Six Sigma. I launched the first, primitive version of the QI Macros in 1997 and have been improving them ever since. Healthcare discovered them in 1999 when the Joint Commission started asking hospitals to track core measures using control charts. Since Excel does all the heavy lifting—drawing the charts—I can keep the cost low enough for the typical user. And because I didn’t know how existing Six Sigma software worked, I was free to make it easy to use.
Microsoft Excel is a tremendously powerful tool for Lean Six Sigma, but most people don’t even know how to use the basic capabilities of Excel. If you think you’re a hotshot Excel user, read on because we’ll look at how to use the QI Macros. If you’re not that familiar with Excel and how to set up your data to make them easy to analyze, chart, and graph, then you will get a lot from this discussion. If you don’t own a copy of Excel or Office, you usually can pick up inexpensive copies of older versions on eBay or Amazon. If your management won’t buy you a copy, you can’t afford not to buy one for yourself. The QI Macros work in all recent versions of Excel.
THE QI MACROS FOR EXCEL
The QI Macros Lean Six Sigma SPC software consists of four main parts:
1. Macros | 2. Templates | 3. Statistics | 4. Data Transformation |
Chart Wizards | Dashboards | Statistics Wizards | Data Mining Wizard |
Control charts | Control charts | ANOVA | PivotTable Wizard |
Pareto | Fishbones | Regression | Word count |
Histograms | FMEA | Sample size | Stack/restack |
Box and whisker | Value Stream Map | t-test, F-test | |
Multivari | Flowcharts | Chi-square |
 Over 40 charting tools to draw control charts, histograms, Pareto charts, and so on. The Control Chart Wizard will automatically choose the right control chart for you.
 Over 100 fill-in-the-blank templates for Lean Six Sigma forms and tools such as value-stream mapping, spaghetti diagramming, fishbone diagrams, and charts (e.g., XmR control chart). Four fill-in-the-blank dashboard tools for XmR, c, np, p, and u charts. (If you use ratios, the XmR dashboard is an easy way to monitor all your key process indicators.)
 Statistical tools such as analysis of variance (ANOVA), t-tests, regression analysis, and so on.
 Data-transformation tools such as the Data Mining Wizard that will develop entire improvement projects automatically from your data. Also the PivotTable Wizard, word count that will do text analysis of free-form comments, stack, and restack.
THE QI MACROS ARE EASY TO USE
Because I’d never been exposed to SPC software developed before the now-familiar point-and-click mouse-driven interface, I was free to think outside the interface design imposed by minicomputers. I took a “grab it and go” approach to the software—select data with the mouse, and then click on a menu to draw a chart. The QI Macros are easy to learn and use:
 Because the software was developed from the ground up to work in Excel and deliver immediate results in business environments using “grab it and go” simplicity:
Stay updated, free articles. Join our Telegram channel

Full access? Get Clinical Tree


