It should come as no surprise that a faster, better hospital will be cheaper to operate and more profitable. When you’re not dealing with all the delays in the emergency department (ED) admission-discharge process, fewer patients will be boarded in the ED, reducing diversion and patients who leave without being seen (LWOBS). More patients can be seen more quickly, increasing revenue and improving patient outcomes. When you’re not dealing with the extra costs of preventable falls, infections, and medication errors, it will make the hospital more cost-effective, profitable, and safe.
FASTER + BETTER = CHEAPER AND MORE PROFITABLE!
One year, the National Association of Healthcare Quality Conference in Orlando, Florida, sandwiched itself in between Hurricane Ivan and Tropical Storm Jeanne. This was after hurricanes Charles and Frances had pounded the state. Mounds of debris still littered the suburbs.
Although most hurricane seasons deliver three or four hurricanes, most people now have come to think of Florida as the hurricane state, not the sunshine state. What was different about that particular season from the last? It was not the number of hurricanes, because that’s about the same every season. The difference was that they all happened in such close proximity that we were able to detect the pattern: tropical storm grows into a hurricane that hits Florida, the panhandle, or the Gulf Coast.
This is the challenge faced by all quality professionals. It’s easy for people to detect mistakes and errors when they happen often enough. But when the frequency of those mistakes falls below a certain level or they have a minor impact, you can no longer detect them with your five senses. You need some better tools. Fortunately, the process (5C’s) and tools are simple:
- Count your misses, mistakes, and errors using control charts.
- Categorize your misses, mistakes, and errors using Pareto charts.
- Cause: determine the root cause of the biggest category using a fishbone diagram.
- Correct the process and systems using countermeasures and action plans.
- Confirm that the correction yielded the desired results using control and Pareto charts.
Count Your Misses, Mistakes, and Errors
While much of healthcare quality is focused on clinical care and the Joint Commission and National Database of Nursing Quality Indicators measures, there’s a lot that can be done with the financial or “transactions” side of the business to eliminate costs and increase profits. One healthcare client had 37,000 rejected insurance claims worth millions in appealed and denied claims. In case it isn’t obvious, there was a lot of rework involved in fixing those rejects and appeals. A hospital can have great clinical success but terrible financial issues. Both the clinical and operational sides of the hospital have to work flawlessly to reduce costs and maximize patient satisfaction and outcomes.
Categorize Your Misses, Mistakes, and Errors
My team began by grouping the errors into the categories of rejects, appeals, and denied claims, but to make these categories actionable, we had to dive a little deeper.
Denied Claims. Because “denied” claims involved real dollars, we did a number of Pareto charts to look for more important categories. The biggest category of denied claims was for those denied for lack of timely filing (within 45 days). Then we categorized the denied claims by insurer. When we did, there was a big surprise: One small insurer accounted for 64 percent of the denied claims.
This brings us back to what I call the 4-50 rule: 4 percent of the categories cause 50 percent of rework, waste, and lost profit. If you want to plug the leaks in healthcare quality, you have to use your data to find and fix these small but costly categories.
Armed with this data, we instituted process changes over the weekend that started saving $380,000 a month.
Rejected Claims. Rejected claims are bounced at the doorway of the insurer because of incorrect or incomplete information. When we looked at the rejected claims data, one category, “duplicate claims,” stood out as 24 percent of problem, or about $35 million. We used what I call the “dirty 30 process” for improvement: We looked at 30 examples of duplicate claims and discovered that these were simply miscoded. The claim had been paid; there wasn’t a duplicate claim. By changing the procedures and using the correct code, we eliminated a problem that inflated the overall error numbers.
Other categories included such things as the alpha prefix on Blue Cross Blue Shield insurance ID cards and uninsured dependents such as newborns and students.
Cause: Find the Root Cause of the Biggest Category First
Therefore, category by category, we used the “dirty 30 process” to identify and fix each of the most common problems first. These fixes often reduced other related categories as well. While most teams want to boil the ocean or solve world hunger, when you restrict yourself to fixing the biggest category first, you’ll find it easier to make a difference, and a surprising amount of benefit will come along with it.
Appeals. In the third big category, appeals, the real problem was time. The average length of time for an appeal to be resolved was 298 days. By using Lean and focusing on the cycle time, my team was able to get the time under 90 days, which, of course, improved cash flow by over $800,000 and enhanced the bottom line.
Correct the Processes and Systems
The team developed countermeasures and action plans to correct the root causes of rejected, appealed, and denied claims.
Confirm That the Correction Yielded the Desired Results
As these corrections were implemented, the team tracked the resulting decrease in rejected, appealed, and denied claims as well as the revenue gained from mistake-proof processing of claims.
Don’t Wait for Hurricane Season
Every healthcare business is plagued by occasional hurricanes that are fanned by a series of problems that happen frequently enough to penetrate the dense fog of consciousness, but why wait? You already have the data you need to start finding and fixing the major categories of misses, mistakes, and errors in all aspects of your facility.
Don’t just focus on the clinical side; turn your attention to the big problems on the transactions side of the house: purchasing, billing, and claims. A recent study estimated that eight out of ten hospital bills have mistakes. There’s a whole class of consultants who, for a fee, will help patients to navigate this maze to get their bills paid. Note: When this happens, your patients have become part of your “fix-it factory.”
It’s not enough to provide high-quality clinical care; you also must provide a high-quality experience in all aspects of service delivery from admissions to discharge and beyond. Patients are no longer patient. The global marketplace has taught them the value of better, faster, and cheaper. Consider thinking of them as “impatients.”
To reduce rejected, appealed, and denied claims, use Six Sigma tools to focus the improvement effort. The process is simple:
- Analyze each type of claim or defect using control charts and Pareto charts:
- Rejected claims
- Appealed claims
- Denied claims
- Rejected claims
- Analyze the root causes using the “dirty 30 process.”
- Implement countermeasures.
- Track and verify results.
REDUCING DENIED CLAIMS IN FIVE DAYS
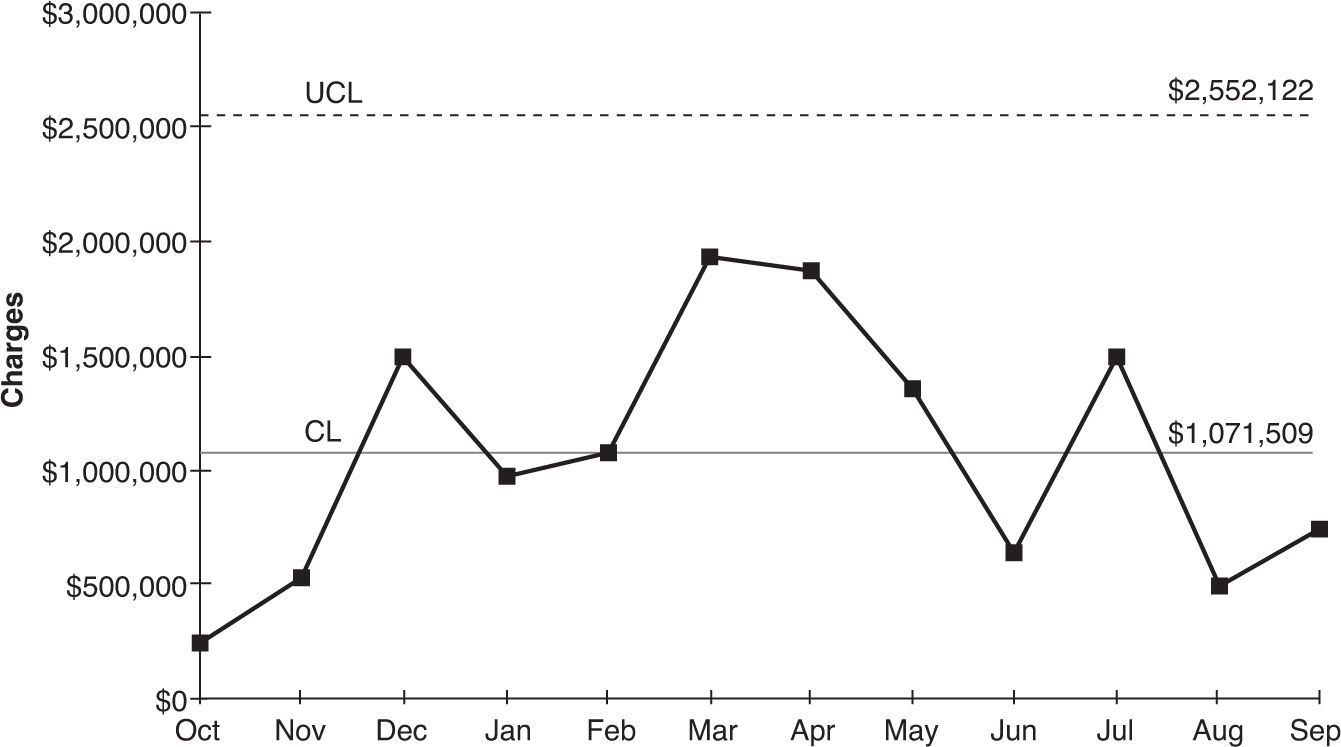
Denied claims mean no money for services rendered because the billing process failed in some way. Nonpayment drives up the cost of healthcare and pushes many hospitals toward bankruptcy. In this case study, monthly denials were over $1 million (Figure 5.1).
FIGURE 5.1
Control chart of denied claims.
Using Pareto Charts of Denials
Using Excel PivotTables and the QI Macros, it was easy to narrow the focus to a few key areas for improvement: timely filing (Figure 5.2) and one insurer (Figure 5.3). See the video at www.qimacros.com/Moneybelt/six-sigma-denied-claims-case-study.html.
Stay updated, free articles. Join our Telegram channel

Full access? Get Clinical Tree


