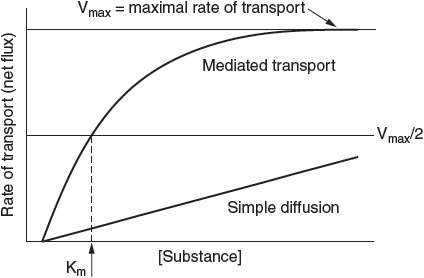
The kinetics of diffusion versus carrier-mediated transport processes vary, as depicted in Figure 1.
Simple diffusion of a substance is described by the Fick equation, as follows:
![]()
where
A is the area available for diffusion,
[S1] − [S2] is the concentration gradient of the substance across the membrane,
d is the distance for diffusion,
D is the diffusion coefficient of the substance,![]()
According to the Fick equation, substances will diffuse more rapidly if the substance has a smaller mass, if the surface area for diffusion is increased, and if the concentration of the substance in one region greatly exceeds the concentration in the other region. For diffusion across membranes, the magnitude of the net flux is also directly proportional to the membrane permeability coefficient for the molecule.
Mediated transport exhibits saturation kinetics described by the Michaelis–Menten equation, as follows:
![]()
where Vmax is the maximal rate of transport, [S] is the concentration of the transported substance, and Km is the concentration required for half-maximal transport of the substance.
Osmosis is a term given to the passive diffusion of water across a semipermeable membrane from a compartment in which the chemical potential of water is higher (solute concentration is lower) to a compartment in which the chemical potential of water is lower (solute concentration is higher), as depicted in Figure 2. A semipermeable membrane is permeable to water but impermeable to solutes.
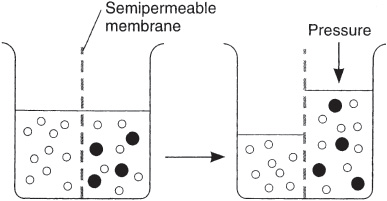
Figure 2
Diagrammatic representation of osmosis. Water molecules are the open circles, and solute molecules are the closed circles. Osmosis is the passive flow of water molecules across a semipermeable membrane from a compartment in which the chemical potential of water is higher (solute concentration is lower) to a compartment in which the chemical potential of water is lower (solute concentration is higher). (Reproduced, with permission, from Ganong WF. Review of Medical Physiology. 22nd ed. New York, NY: McGraw-Hill; 2005:5.)
The flow of water through membranes by osmosis is described by the osmotic flow equation:
![]()
where σ is the reflection coefficient, L is the hydraulic conductivity, and π1 − π2 is the osmotic pressure difference across membrane.
The reflection coefficient (σ) is an index of the membrane’s permeability to a solute and varies between 0 and 1. Particles that are impermeable to the membrane have a reflection coefficient of 1. Particles that are freely permeable to the membrane have a reflection coefficient of 0.
The osmotic pressure (π) of a solution is the pressure necessary to prevent solute migration. The osmotic pressure (in units of mm Hg) is calculated with the van’t Hoff equation:
![]()
where R is the ideal gas constant, T is the absolute temperature, φ is the osmotic coefficient, i is the number of ions formed by the dissociation of a molecule, c is the molar concentration of solute, and (φic) is the osmolarity of the solution.
The value of i is 1 for nonionic substances such as glucose and urea; 2 for substances such as HCl, NaCl, KCl, NH4 Cl, NaHCO3, and MgSO4; and 3 for compounds such as CaCl2 and MgCl2.
A value of 1 is often used as an approximate value of φ. Thus, the osmolarity and osmotic pressure of 1 M CaCl2 > 1 M NaCl > 1 M glucose. Similarly, a 1 M solution of glucose has approximately the same osmolarity and osmotic pressure as 0.5 M NaHCO3 or 0.33 M MgCl2.
One osmol is equal to 1 mol of solute particles. The osmolarity is the number of osmoles per liter of solution, whereas the osmolality is the number of osmoles per kilogram of solvent. In the body, osmolal concentrations are expressed as osmoles per kilogram of water.
The plasma membranes of most cells are relatively impermeable to many of the solutes of the extracellular fluid (ECF) but are highly permeable to water. Thus, the movement of water by osmosis leads to swelling or shrinking of cells.
The term tonicity is used to describe the osmolarity of a solution of nonpenetrating substances relative to plasma. Solutions of nonpenetrating solutes that have the same osmolarity as plasma (~300 mOsm/L) are isotonic; solutions containing greater than 300 mOsm of nonpenetrating solutes are hypertonic; and those containing less than 300 mOsm of non-penetrating solutes are hypotonic.
As shown in Figure 3, cells shrink when placed in hypertonic solutions and swell when placed in hypotonic solutions.
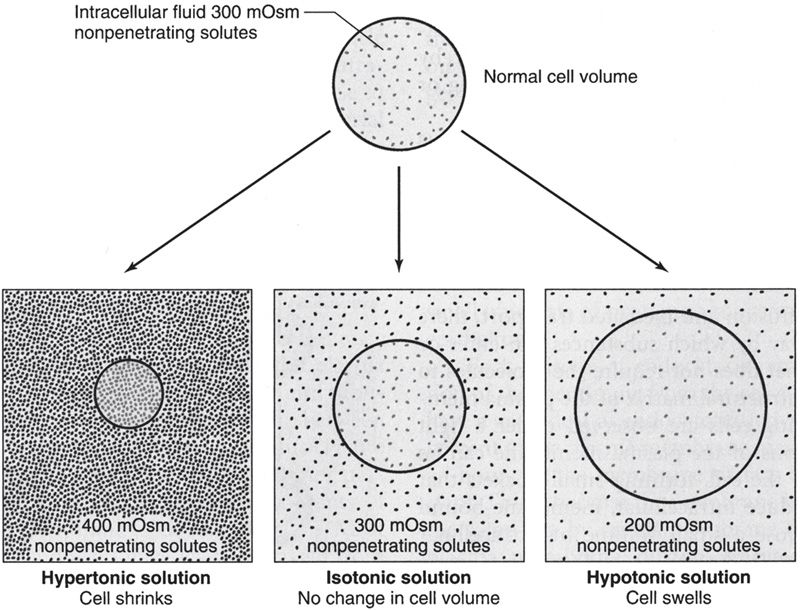
Figure 3
Cell volume changes with hypertonic, isotonic, and hypotonic solutions. (Reproduced, with permission, from Widmaier EP, Raff H, Strang KT. Vander’s Human Physiology: The Mechanisms of Body Function. 11th ed. New York, NY: McGraw-Hill; 2008:111.)
The steady-state volume of a cell can be calculated as follows:
![]()
Isotonic solutions are commonly used for intravenous fluid administration and as drug diluents because administration of an isotonic solution does not produce changes in cell volume, that is, no net water movement. Isotonic saline has a concentration of 154 mM NaCl, containing 154 × 2 or 308 mM of osmotically active particles. An isotonic solution of glucose is a 5% dextrose solution.
Another set of terms—isosmotic, hyperosmotic, and hypoosmotic— denotes the osmolarity of a solution relative to that of normal ECF independent of whether the solute is penetrating or nonpenetrating. For example, a solution containing 150 mOsm each of nonpenetrating Na+ and Cl− and 100 mOsm of the penetrating solute urea, which can readily cross cell membranes, would have a total osmolarity of 400 mOsm (hyperosmotic), but a tonicity of 300 mOsm (isotonic), and thus there would be no net change in the volume of a cell immersed in the solution.
Intercellular Connections and Communication
Two types of connections form between the cells comprising a tissue. One type of junction serves to fasten the cells to one another and to surrounding tissues. Examples of fastening junctions that lend strength and stability to tissues include tight junctions or zona occludens, desmosomes, and zona adherens, as well as hemidesmosomes and focal adhesions, which attach cells to their basal laminas.
The other type of connection between cells serves the purpose of transferring ions and other molecules from cell to cell, as well as the rapid propagation of electrical activity. This type of intercellular connection, called a gap junction, is a dodecameric structure formed by the alignment of units called connexons in the membranes of each cell. Each connexon is made up of six protein subunits called connexins, each of which has four membrane-spanning regions. Connexin mutations are now known to cause almost 20 different human diseases, including X-linked Charcot–Marie–Tooth disease (Cx32), skin disorders such as Clouston syndrome (Cx30) and erythrokeratoderma variabilis (Cx30.3 and Cx31), inherited deafness (Cx26, Cx30, and Cx31), cataracts (Cx46 and Cx50), and predisposition to myoclonic epilepsy (Cx36) and arteriosclerosis (Cx37).
In addition to the direct cell-to-cell communication via gap junctions, cells communicate with each other via chemical messengers in the ECF by a number of processes, including neural, endocrine, and paracrine communication.
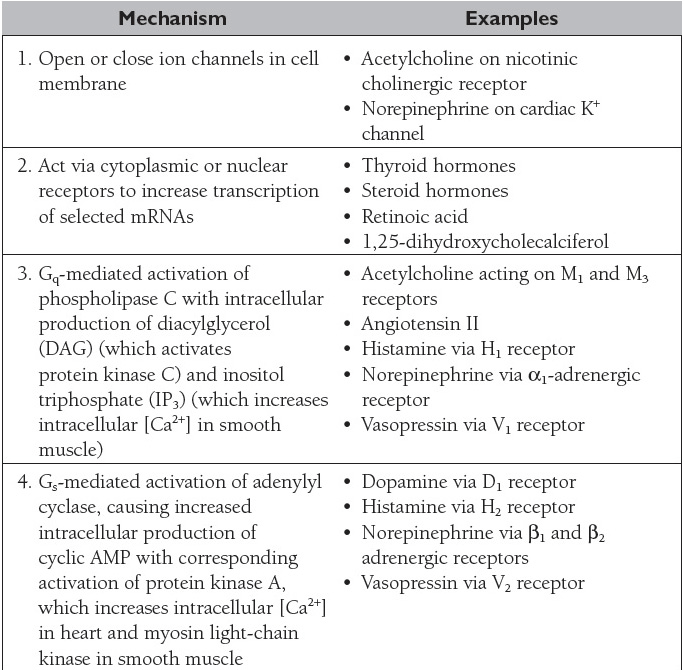
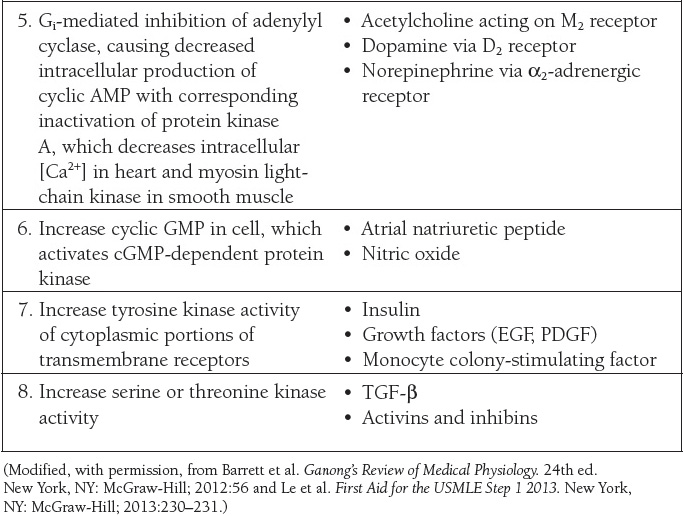
In the case of intercellular communication mediated by chemical messengers in the ECF, there are generally “first messengers,” which constitute the extracellular ligands that bind to receptors in the cell membrane, and “second messengers,” which are the intracellular mediators that bring about the changes in cell function produced by binding of the “first messenger.” The principal mechanisms by which chemical messengers exert their intra-cellular effects are summarized in Table 2.
GENERAL PRINCIPLES: MULTISYSTEM PROCESSES
(References: Barrett et al., pp 3-8, 316-320, 650-651, 697-719. Kaufman et al., pp 239-256. Levitzky, pp 163-188. Longo et al., pp 341-373. Widmaier et al., pp 5-19, 28-29, 417-433, 454-460, 490-515, 569-585.)
Body Fluid Compartments
Water is the most abundant constituent in the body. Total body water (TBW) is approximately 60% of lean body mass. The percentage of water in the body is a function of body fat. The greater the percentage of body fat, the lower the percentage of body water.
As shown in Figure 4, TBW is distributed between intracellular and extracellular fluid compartments.
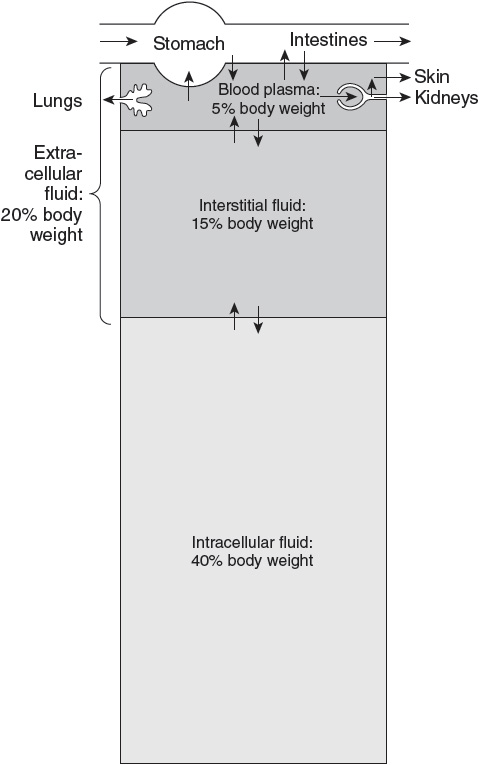
Figure 4
Body fluid compartments with approximate contribution to percentage body weight. Arrows represent fluid movement between compartments. (Reproduced, with permission, from Barrett et al. Ganong’s Review of Medical Physiology. 24th ed. New York, NY: McGraw-Hill; 2012:5.)
• Intracellular fluid (ICF) comprises about two-thirds of TBW (40% of body mass).
• ECF is one-third of TBW (20% of body mass). The ECF water is further divided into:
• Plasma (intravascular) water, which comprises approximately one-fourth of ECF or one-twelfth of TBW (5% of body mass), and
• Interstitial (extravascular) water, which comprises approximately three-fourths of ECF or one-fourth of TBW (15% of body mass).
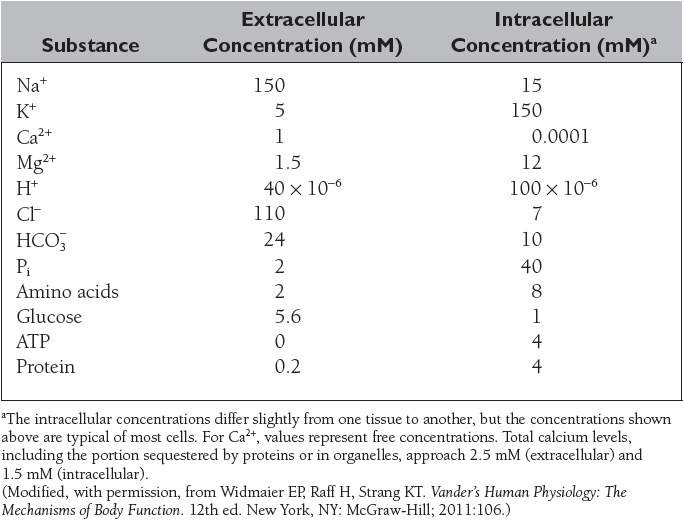
The composition of the extracellular and intracellular fluids is shown in Table 3. The distribution of substances between the intracellular and extracellular fluid is unequal due to the membrane potential and the presence of various transporters and ion channels in the plasma membrane.
The solute or particle concentration of a fluid is its osmolality. Water shifts between the ECF and ICF in order to maintain osmotic equilibrium between the two compartments.
The normal range of plasma osmolality is 285 to 300 mOsm/kg, and the normal range of plasma osmolarity is 285 to 300 mOsm/L.
Because of the predominant role of the major solutes and the deviation of plasma from an ideal solution, plasma osmolarity can normally be estimated using the following formula:
![]()
Fluid and Electrolyte Balance and Disorders
The extracellular osmolarity is controlled by antidiuretic hormone (ADH), also known as vasopressin. Increases in osmolarity stimulate the release of ADH from the posterior pituitary gland. ADH returns osmolarity toward normal by decreasing the amount of water excreted by the kidney. When osmolarity is decreased, ADH release is decreased and osmolarity is returned toward normal by increased water excretion. ADH is also secreted in response to low blood pressure. Under these conditions, reabsorption of water by the kidneys can make the ECF hypotonic.
Plasma osmolality is elevated in:
• Dehydration
• Diabetes insipidus
• Hypernatremia
• Hyperglycemia
• Hypercalcemia
• Mannitol therapy
• Uremia
• Toxin ingestion (ethanol, methanol, ethylene glycol)
Plasma osmolality is decreased in:
• Addison disease
• Hyponatremia
• Hypothyroidism
• Syndrome of inappropriate antidiuretic hormone (SIADH)
• Overhydration
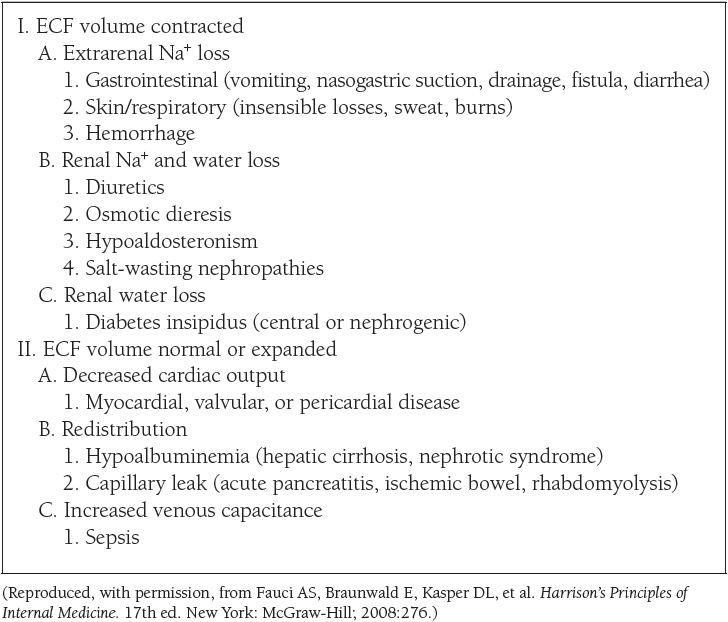
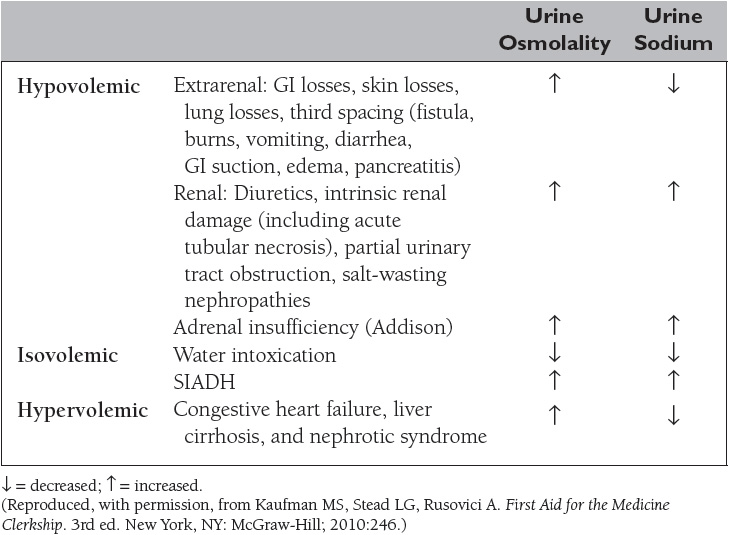
The extracellular volume is controlled by the NaCl content of the ECF. Hypovolemia, or volume depletion, generally refers to a state of combined salt and water loss exceeding intake, leading to ECF volume contraction. The loss of Na+ may be renal or extrarenal (Table 4).
NaCl content is controlled by aldosterone and atrial natriuretic peptide (ANP). Extracellular volume is monitored by low-pressure baroreceptors within the thoracic venous vessels and the atria and by pressure receptors within the afferent arteriole of the kidneys. ANP release is controlled directly by stretch receptors within the right atrium.
Aldosterone secretion is controlled by the renin–angiotensin system. Renin is released from the juxtaglomerular cells (JG cells) of the kidney in response to the following:
• Decreased perfusion pressure within the afferent arteriole
• Sympathetic stimulation of the JG cells
• Decreased Cl− concentration in fluid bathing the macula densa
Renin catalyzes the conversion of angiotensinogen to angiotensin I. Angiotensin I is converted into angiotensin II by angiotensin-converting enzyme (ACE) located within the lung. Angiotensin II stimulates aldosterone secretion from the adrenal cortex gland.
Hyponatremia, defined as a plasma sodium concentration <135 mEq/L, is a very common disorder occurring in more than 20% of hospitalized patients. The disorder is almost always the result of an increase in circulating ADH and/or increased renal sensitivity to ADH. The underlying patho-physiology for the exaggerated or inappropriate ADH response differs in hyponatremic patients as a function of their ECF volume. Therefore, the causes of hyponatremia are subdivided into three categories based on coexisting urine sodium and osmolarity and volume status (Table 5).
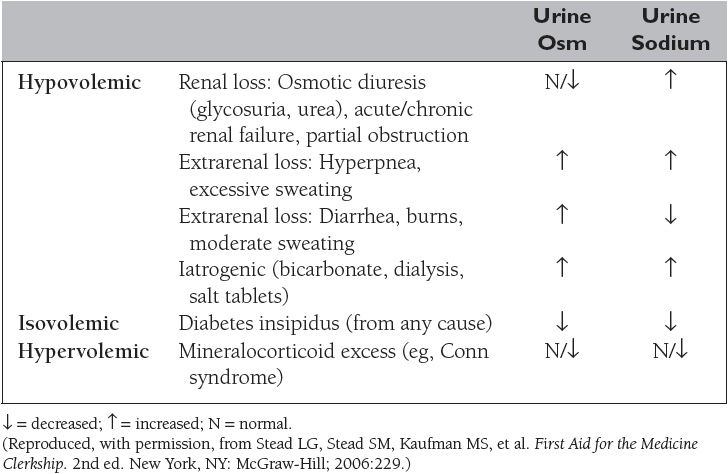
Hypernatremia is defined as a serum sodium concentration greater than 145 mEq/L. The causes of hypernatremia are subdivided into three categories based on the coexisting fluid status (Table 6).
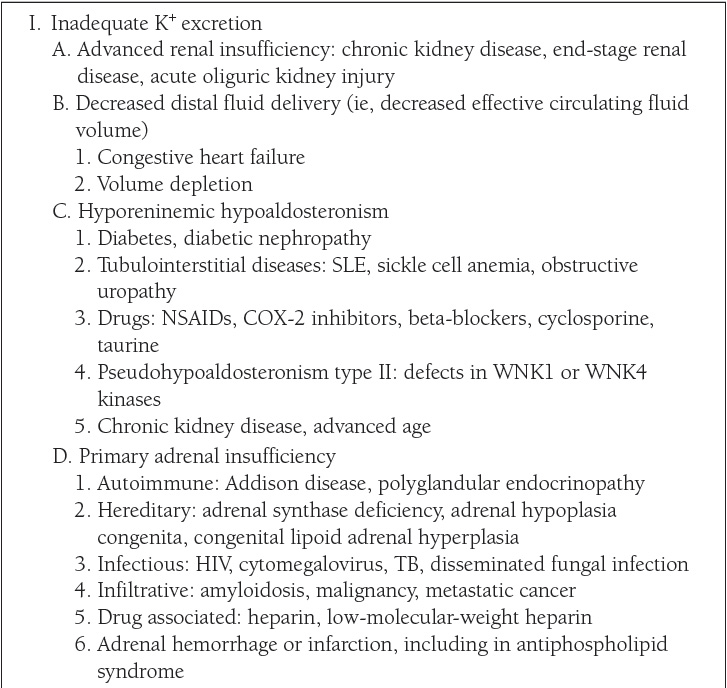
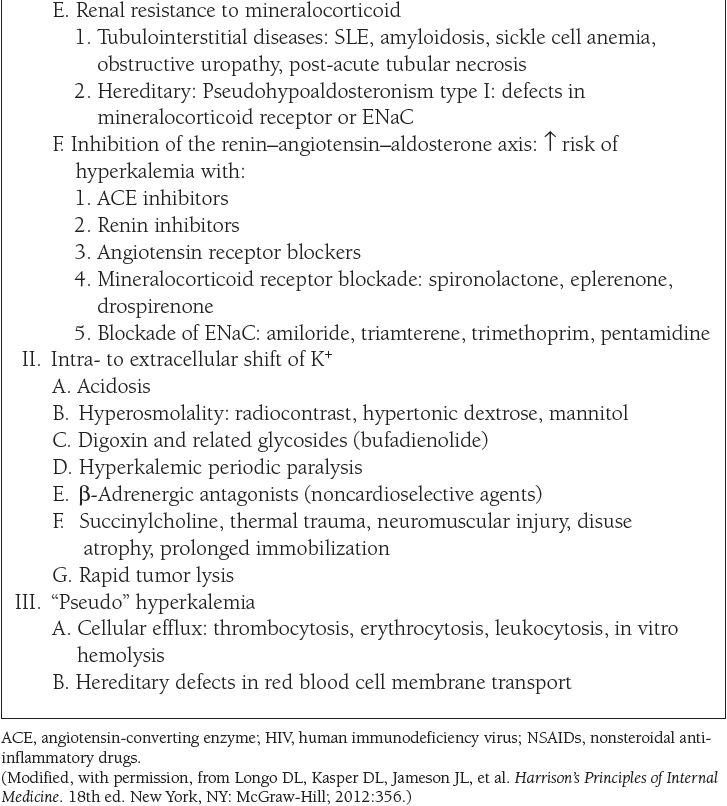
Potassium is the major intracellular cation with a normal concentration of approximately 150 mmol/L (Table 3). Homeostatic mechanisms maintain plasma K+ concentration between 3.5 and 5 mmol/L despite marked variations in dietary K+ intake. The ratio of intracellular to extracellular K+ (normally 38:1) is the principal result of the resting membrane potential and is essential for normal neuromuscular function. Virtually all regulation of renal K+ excretion and total body K+ balance occurs in the distal nephron. Potassium secretion is regulated by aldosterone. Aldosterone is secreted by the zona glomerulosa cells of the adrenal cortex in response to increases in extracellular K+ or angiotensin II, causing K+ secretion to increase. K+ transport into cells is increased by epinephrine and insulin.
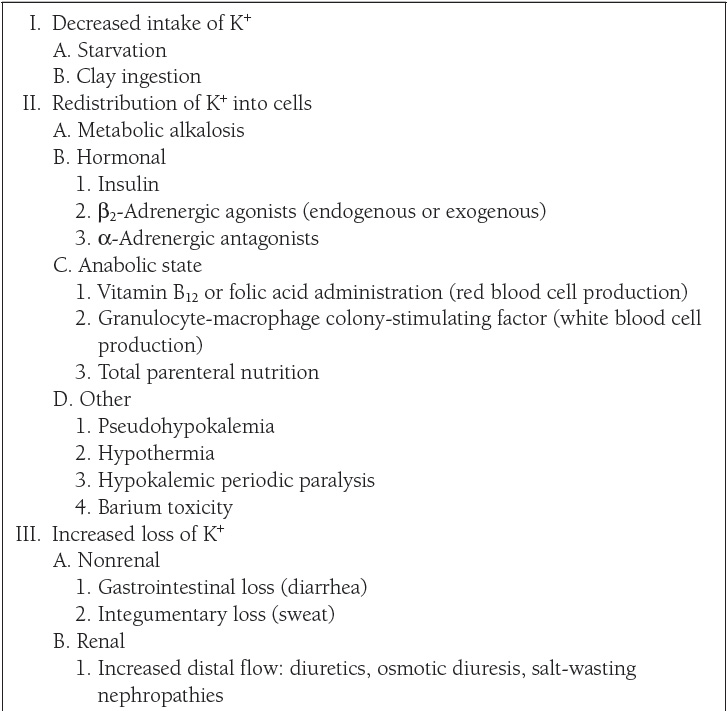
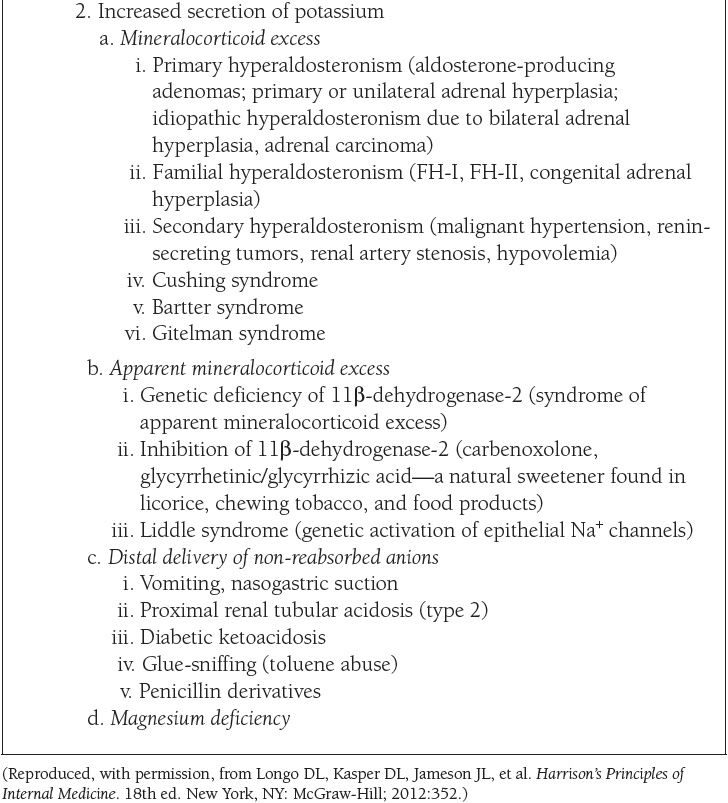
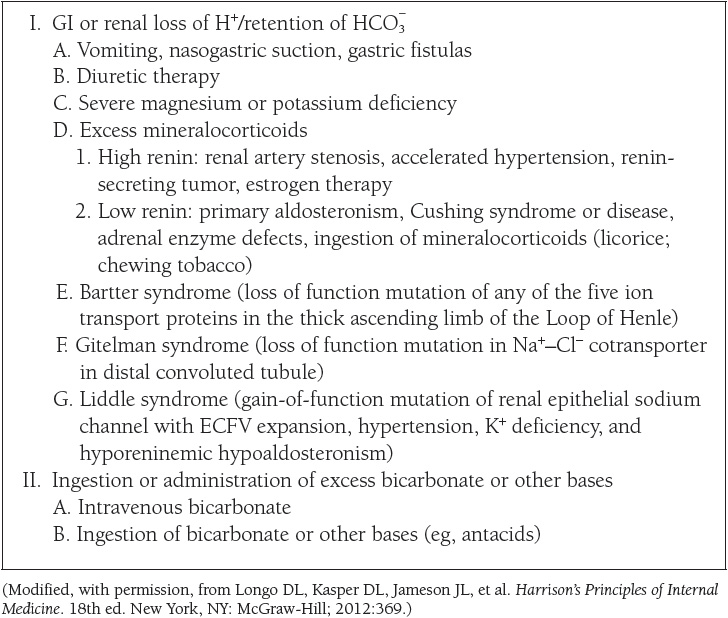
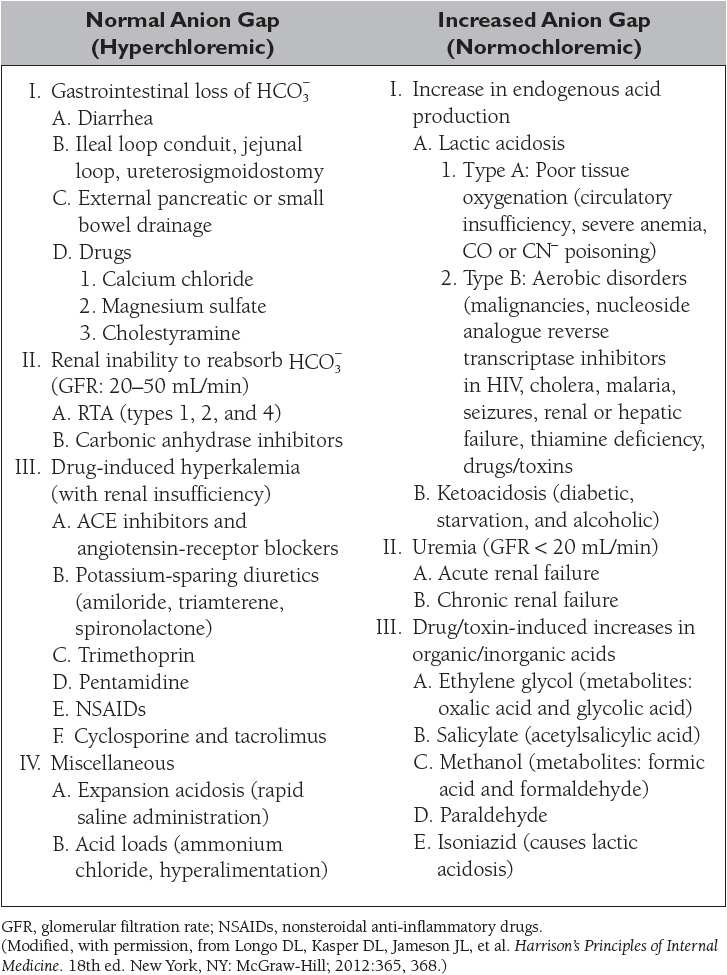
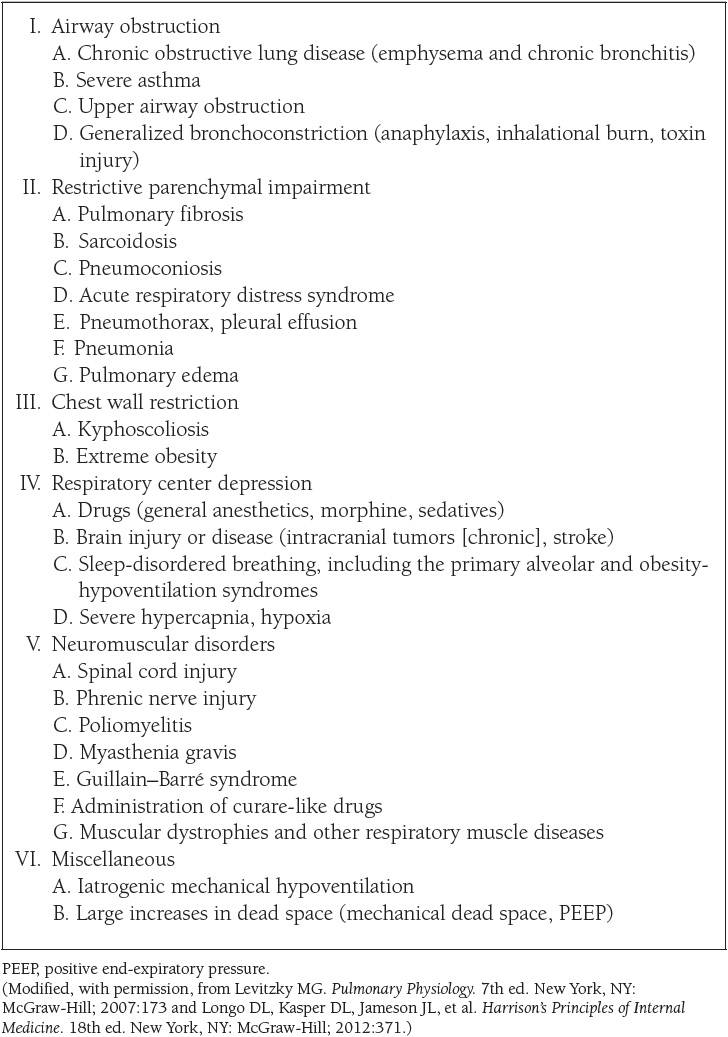
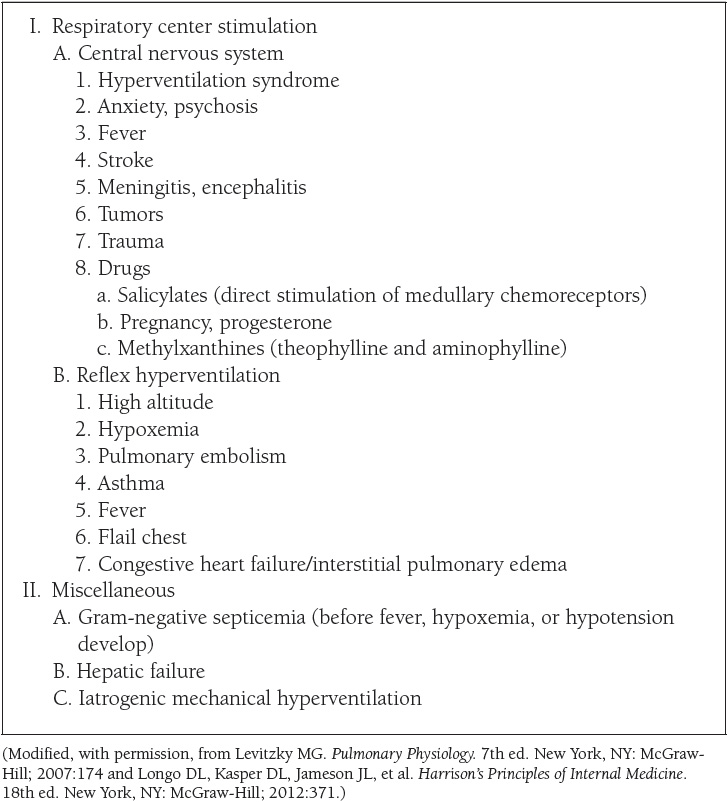
The causes of hypokalemia, defined as a plasma K+ concentration less than 3.5 mEq/L, are shown in Table 7. The causes of hyperkalemia, defined as a plasma K+ concentration ≥ 5 mEq/L, are shown in Table 8. Hypokalemia occurs in up to 20% of hospitalized patients, and is associated with a tenfold increase in in-hospital mortality rates due to adverse effects on cardiac rhythm. Hyperkalemia occurs in up to 10% of hospitalized patients; severe hyperkalemia (>6 mEq/L) occurs in approximately 1% of patients and has a significantly increased risk of mortality.
Acid–Base Balance and Disorders
Each day, approximately 15,000 mmol of volatile acid (CO2) and 50 to 100 mEq of fixed acid (hydrochloric acid, lactic acid, phosphoric acid, sulfuric acid, etc) are produced by metabolism. The pH of the ECF is maintained by buffering the acid as it is formed and excreting the acid over time. The kidneys require approximately 24 hours to excrete the fixed acids. CO2 is rapidly excreted by the lungs.
When CO2 is added to water, it forms carbonic acid (H2 CO3), a reaction that is catalyzed by the enzyme carbonic anhydrase (CA). Once formed, carbonic acid rapidly dissociates into H+ and ![]()
![]()
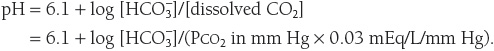
The pH of plasma is calculated using the Henderson–Hasselbalch equation:
Arterial PCO2 is normally maintained at 40 mm Hg by the lungs and arterial ![]() is normally maintained at 24 mEq/L by the kidneys. Thus, normally,
is normally maintained at 24 mEq/L by the kidneys. Thus, normally,
![]()
The normal ratio of ![]() /[dissolved CO2] = 20/1. The four primary acid–base disorders result from abnormalities that alter the normal 20/1 ratio of
/[dissolved CO2] = 20/1. The four primary acid–base disorders result from abnormalities that alter the normal 20/1 ratio of ![]() /[dissolved CO2], as summarized in Table 9.
/[dissolved CO2], as summarized in Table 9.
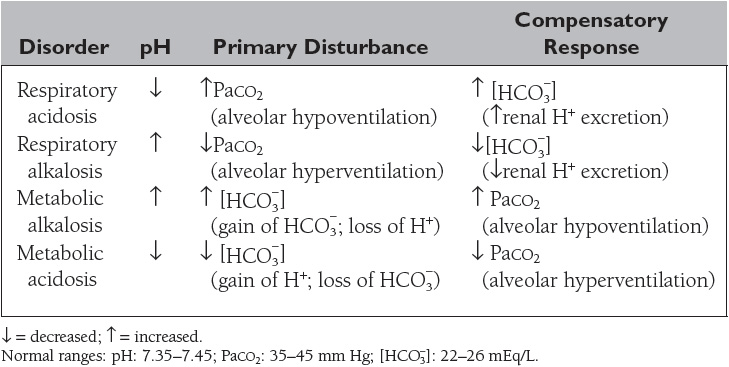
Compensation for the acid–base disorders involves an attempt by the body to minimize the change in pH caused by the primary disorder by restoring the ratio of ![]() /[dissolved CO2] toward its normal value. In order to do so, if the primary disorder is a metabolic acid–base disturbance causing a change in the
/[dissolved CO2] toward its normal value. In order to do so, if the primary disorder is a metabolic acid–base disturbance causing a change in the ![]() , then the appropriate respiratory compensatory response will change the PaCO2, and thus the [dissolved CO2] in the same direction.
, then the appropriate respiratory compensatory response will change the PaCO2, and thus the [dissolved CO2] in the same direction.
If the primary disorder is respiratory in origin, causing a change in the denominator of the ratio, then there will be renal compensation geared toward changing the ![]() in the same direction as the primary change in PaCO2.
in the same direction as the primary change in PaCO2.
The causes of the four primary acid–base disorders are listed in Tables 10 to 13.
PHYSIOLOGY OF THE HEMATOPOIETIC AND LYMPHORETICULAR SYSTEMS
(References: Barrett et al., pp 555-570, 641-648. Levitzky, pp 142-162. Widmaier et al., pp 417-427, 454-459.)
Oxygen Transport in the Blood
Oxygen is transported in the blood in two forms: (1) dissolved in plasma and (2) chemically combined with hemoglobin. The concentration of a gas dissolved in a liquid is proportional to its partial pressure and its solubility in the liquid. The solubility coefficient of oxygen in plasma at body temperature and pressure is 0.003 mL O2/100 mL blood/mm Hg. The concentration of O2 combined with hemoglobin is determined by the following equation:
![]()
As shown in Table 14, the total oxygen content is the sum of the dissolved oxygen and the oxyhemoglobin content. More than 98% of the oxygen delivered to the blood is bound to hemoglobin (HbO2), an amount 65 times greater than the amount dissolved in the arterial blood. Nonetheless, the dissolved oxygen is critical because it determines the amount of oxygen that combines with hemoglobin, as depicted by the oxyhemoglobin dissociation curve (Figure 5).
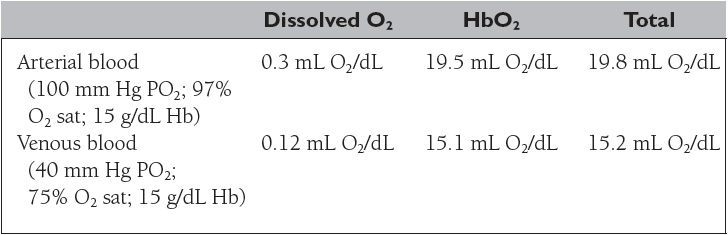
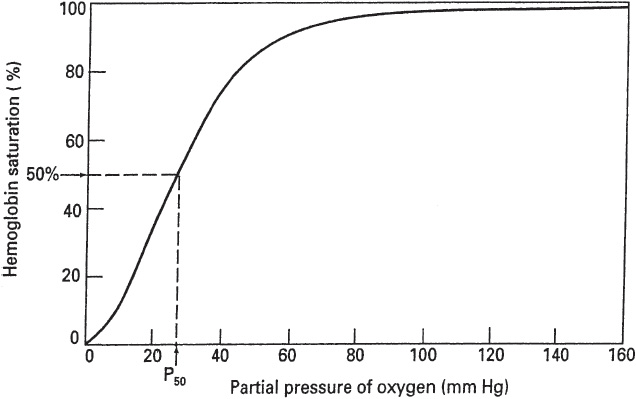
Figure 5
Oxyhemoglobin dissociation curve. (Reproduced, with permission, from Levitzky MG. Pulmonary Physiology. 7th ed. New York, NY: McGraw-Hill; 2007:146.)
Oxygen delivery is the product of the cardiac output and the arterial oxygen content.
Oxygen extraction is the difference between the arterial and venous oxygen contents (a-v O2).
According to the Fick equation, cardiac output (CO) can be calculated as the ratio of the oxygen consumption ![]() and the oxygen extraction.
and the oxygen extraction.
![]()
Reaction of Hemoglobin and Oxygen
Hemoglobin is a protein with four subunits, each of which has a heme moiety attached to a polypeptide chain (HbA: two α chains and two β chains). Heme is a complex consisting of a porphyrin and one atom of a ferrous (Fe2+) iron. Each of the four iron atoms can bind reversibly one molecule of O2 (Hb4 + O2 = Hb4O2).
The plot of the four reversible reactions of hemoglobin and oxygen is represented by the oxyhemoglobin dissociation curve, which shows the relationship between the PO2 of the plasma and the percent of hemoglobin saturated with oxygen (Figure 5).
The oxyhemoglobin dissociation curve has a characteristic sigmoidal shape reflecting the increased affinity of hemoglobin for oxygen as each additional molecule of oxygen binds to the four subunits of hemoglobin (cooperative binding). Conversely, dissociation of oxygen from hemoglobin facilitates additional dissociation. As a result, the slope of the curve decreases as one goes from low to high PO2 values, with a plateau reached when the PO2 is above approximately 80 mm Hg.
This is important physiologically because the S-shape facilitates oxygen loading in the pulmonary capillaries and oxygen unloading at the tissues. Also, there is an important physiological safety factor because a patient with a relatively low arterial PO2 still has a relatively high O2 saturation (eg, 90% SO2 at 60 mm Hg PO2).
A rightward shift of the oxyhemoglobin dissociation curve is indicative of a decrease in HbO2 affinity with less oxygen uptake at the pulmonary capillaries but greater release of oxygen to the tissues. The P50, that is, the PO2 at which hemoglobin is 50% saturated with oxygen, is increased above the normal value of approximately 27 mm Hg. Factors that shift the oxyhemoglobin dissociation curve to the right include the following:
• Hyperthermia
• Increased PCO2 or decreased pH (known as the Bohr effect)
• Increased erythrocyte [2,3-bisphosphoglycerate] (BPG, DPG, 2,3-BPG, 2,3-DPG)
A leftward shift of the oxyhemoglobin dissociation curve denotes a higher-than-normal HbO2 affinity with greater oxygen uptake at the pulmonary capillaries but less oxygen released at the tissue level. The P50 is lower than normal when affinity is increased. Factors that shift the oxyhemoglobin dissociation curve to the left include the following:
• Hypothermia
• Alkalosis or decreased PCO2 (Bohr effect)
• Decreased erythrocyte 2,3-BPG concentration
• Carbon monoxide
The Hb–O2 curve for fetal Hb (HbF) is shifted to the left of that for normal adult hemoglobin (HbA) because there is poor binding of 2,3-BPG to the γ-chains in HbF compared with the β-chains in HbA.
There are hundreds of hemoglobin variants that have been described, most of which result from single-point mutations. Hb variants are often classified as high affinity versus low affinity based on their P50 values.
CO2 Transport in the Blood
The total CO2 content in blood (~50 mL/dL) is much greater than total arterial O2 content (~20 mL/dL). Like oxygen, carbon dioxide can be physically dissolved in the plasma or chemically combined with hemoglobin (carbaminohemoglobin). Approximately 5% of total CO2 is dissolved. Carbaminohemoglobin constitutes approximately 10% of total CO2 in the blood, in contrast to oxygen combined to hemoglobin. The majority of CO2 in the blood (80%–90%) is transported as bicarbonate, a product of the dissociation of carbonic acid from the CO2 hydrolysis catalyzed by carbonic anhydrase.
There is no carbonic anhydrase in the plasma, so the CO2 hydration equation proceeds very slowly in plasma. In contrast, the presence of carbonic anhydrase in red blood cells results in most HCO3− being formed within erythrocytes. However, the HCO3− then diffuses down its concentration gradient from RBCs into the plasma in exchange for Cl−, a process called the chloride shift, which is mediated by Band 3, a major membrane protein. Because of the chloride shift, the Cl− content of the red cells in the venous blood is greater than that in the arterial RBCs.
NEUROPHYSIOLOGY
(References: Barrett et al., pp 8-10, 83-96, 119-296. McPhee and Hammer, pp 141-181. Widmaier et al., pp 135-249, 292-310.)
Ionic Equilibria and Membrane Potentials
All cells have membrane potentials. The magnitude of the membrane potential is determined by the membrane permeability and the concentration gradient of the ions that are permeable to the membrane.
In the resting state, the membrane is primarily permeable to K+ and, therefore, the resting membrane potential is close to the equilibrium potential for K+.
The equilibrium potential (E) is calculated with Nernst equation:
![]()
The equilibrium potential for K+ is −90 mV, for Na+ is +60 mV, and for Cl− is −70 mV.
The resting membrane potential is calculated with the Goldman equation:
![]()
Because neither EK nor ENa is at the EM of −70 mV, one would expect the cell to gradually gain Na+ and lose K+ if only passive electrical and chemical forces were acting on the membrane. In other words, there is more K+ and less Na+ in the neurons than can be accounted for by electrochemical gradients. This condition is maintained by the electrogenic Na+ –K+ pump, that is, Na+, K+ –ATPase, which pumps three Na+ out of the cell for every two K+ it pumps into the cell for each molecule of ATP hydrolyzed.
Action Potential
If an axon is stimulated and the current has sufficient intensity, an action potential will be produced (Figure 6).
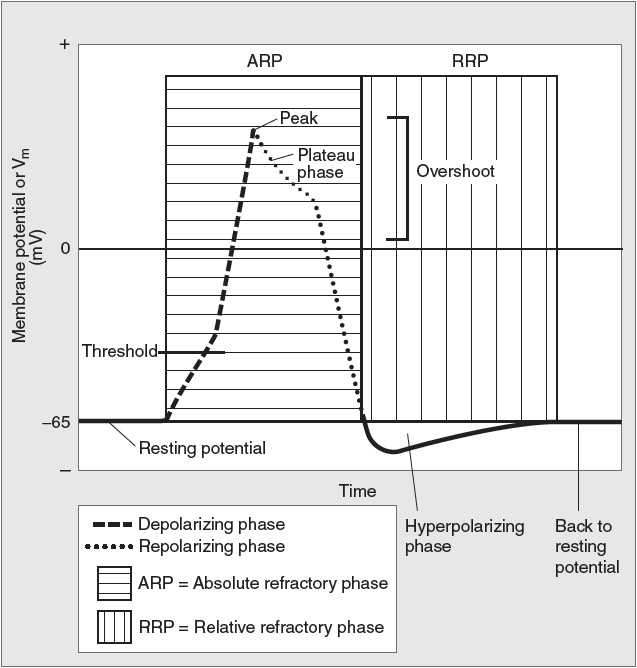
Figure 6
Components of an action potential. (Reproduced with permission from Toy et al. Case Files™: Neuroscience. www.accessmedicine.com. McGraw-Hill.)
Stay updated, free articles. Join our Telegram channel

Full access? Get Clinical Tree


