Figure 13-1. Flow diagram of article screening process for Joint National Committee 8 review of pharmacologic therapy of hypertension at specific blood pressure levels to improve outcomes. (Data from James PA, Oparil S, Carter BL, et al. 2014 evidence-based guideline for the management of high blood pressure in adults: report from the panel members appointed to the Eighth Joint National Committee (JNC 8). JAMA. 2014;311:507-520.)
The panel concluded on the basis of its review of the evidence that:
• In persons age 60 years or older, a strong recommendation was made for pharmacologic therapy of people with a systolic blood pressure of 150 mm Hg or higher or a diastolic blood pressure of 90 mm Hg or higher, with a goal of lowering their respective blood pressures below the specified levels.
• In persons between 30 and 59 years of age, a strong recommendation was made for pharmacologic therapy of people with a diastolic blood pressure of 90 mm Hg or higher, with a goal of lowering blood pressure below that level.
• For persons younger than the age of 60 years, there was insufficient evidence for a systolic blood pressure goal.
• For persons younger than the age of 30 years, there was insufficient evidence to establish a diastolic blood pressure goal.
When applied to the Health Scenario, the patient in question is age 49 years old, and his diastolic blood pressure exceeded the goal level of 90 mm Hg. Accordingly, he would fit the second recommendation for treating his high blood pressure with pharmacologic therapy to a target goal diastolic blood pressure of 90 mm Hg or lower. In terms of selecting the preferred pharmacologic agent for treating this patient, the recommendations went on to examine the data by agent and patient demographics. It was concluded that for African American patients, such as the individual in the Health Scenario, a moderate recommendation can be made to initiate antihypertensive treatment with a thiazide-type diuretic or calcium channel blocker. Of course, individual treatment needs to be customized to the particular situation for each patient, but these guidelines can help the caregiver focus on the treatment choices that are most likely to benefit this patient based on the best evidence that is available.
As illustrated in the review conducted by the JNC 8, the volume of medical literature on a particular topic can be very extensive. The number of RCTs and studies conducted has increased dramatically over the past few decades. For example, the number of RCTs published in MEDLINE increased five fold from 1978 to 1985 to 1994 to 2001. At the same time, not all of these studies produced results that are internally and externally valid. If results are biased or confounded or limited to selective subsets of patients, the evidence may have reduced value in guiding clinical practice. Routinely, clinicians are confronted with a vast volume of evidence of uncertain and unclear value. Thus, critically appraised and synthesized scientific evidence has become fundamental to clinical practice. Likewise, the “art of medicine” involves the incorporation of the best evidence in the integration of clinician skills and expertise with patient values and preferences.
Clinical practice guidelines and recommendations incorporate the interrelationships among these critical contributors to clinical decision making. Such guidelines should enhance clinical decision making by clearly describing and appraising the scientific evidence behind clinical recommendations. Some common limitations in developing high-quality and trustworthy clinical practices and guidelines include:
• Variable quality of individual scientific studies
• Limitations in systematic reviews
• Inadequate consideration of evidence quality in appraisals
• Failure to include multidisciplinary groups
• Failure to adequately include conflicting studies
• Failure to use rigorous methodologies in the considered studies
The Institute of Medicine (IOM) issued two reports that established new “best practice” standards for generating systematic evidence reviews and developing clinical guidelines for evidence-based clinical practices. Similarly, the National Heart, Lung, and Blood Institute (NHLBI) has implemented evidence-based practice development for the prevention, detection, and treatment of cardiovascular, lung, and blood diseases. To continually improve the quality and impact of the evidence reviews, the evidence review process should ensure rigor and minimize bias. The process based on the IOM recommendation should:
• Be based on a systematic review of the existing evidence.
• Consider important patient subgroups and patient preferences.
• Be based on an explicit process that minimizes distortion, biases, and conflicts of interest.
• Provide a clear explanation of logical relationships between alternative care options and health outcomes.
• Provide ratings of both the quality of evidence and the strength of the recommendations.
This type of a review should be implemented in a systematic manner. As illustrated in the JNC 8 review of hypertension research, there are several components of the review process:
1. Construction of the clinical questions most relevant to clinical practice. In general, these questions follow “PICOTSS” (population, intervention or exposure, comparison group, outcome, time, setting, and study design) format.
2. Identification (a priori) of inclusion/exclusion (I/E) criteria for each clinical question. This process includes the development of a search strategy based on I/E criteria. The more restrictive the I/E criteria, the greater the limits on extrapolating the results to other groups.
3. Implement a systematic electronic search of the published literature from relevant bibliographic databases for each clinical question. The first activity is the screening process to identify relevant original articles, systematic reviews, or meta-analyses. Rigorous validation procedures should be applied to ensure that the selected articles meet the preestablished detailed I/E criteria before being included in the final review.
4. Assessment of quality (good, fair, or poor) of each included study. This is typically accomplished with study-rating instruments.
5. Abstraction of relevant information from the included studies into an electronic database. These data elements can be completed by constructing templates with lists of data elements that were pertinent to I/E criteria.
6. Construction of detailed evidence tables from the abstraction database. Included in the evidence tables are summary tables displaying the evidence in a manageable format to answer specific parts of each clinical question.
7. Evaluate summary tables to develop evidence statements for each clinical question. The quality of evidence for each evidence statement can be graded as high, moderate, or low. The grade is based on scientific methodology, scientific strength, and consistency of results.
SYSTEM FOR GRADING THE BODY OF EVIDENCE
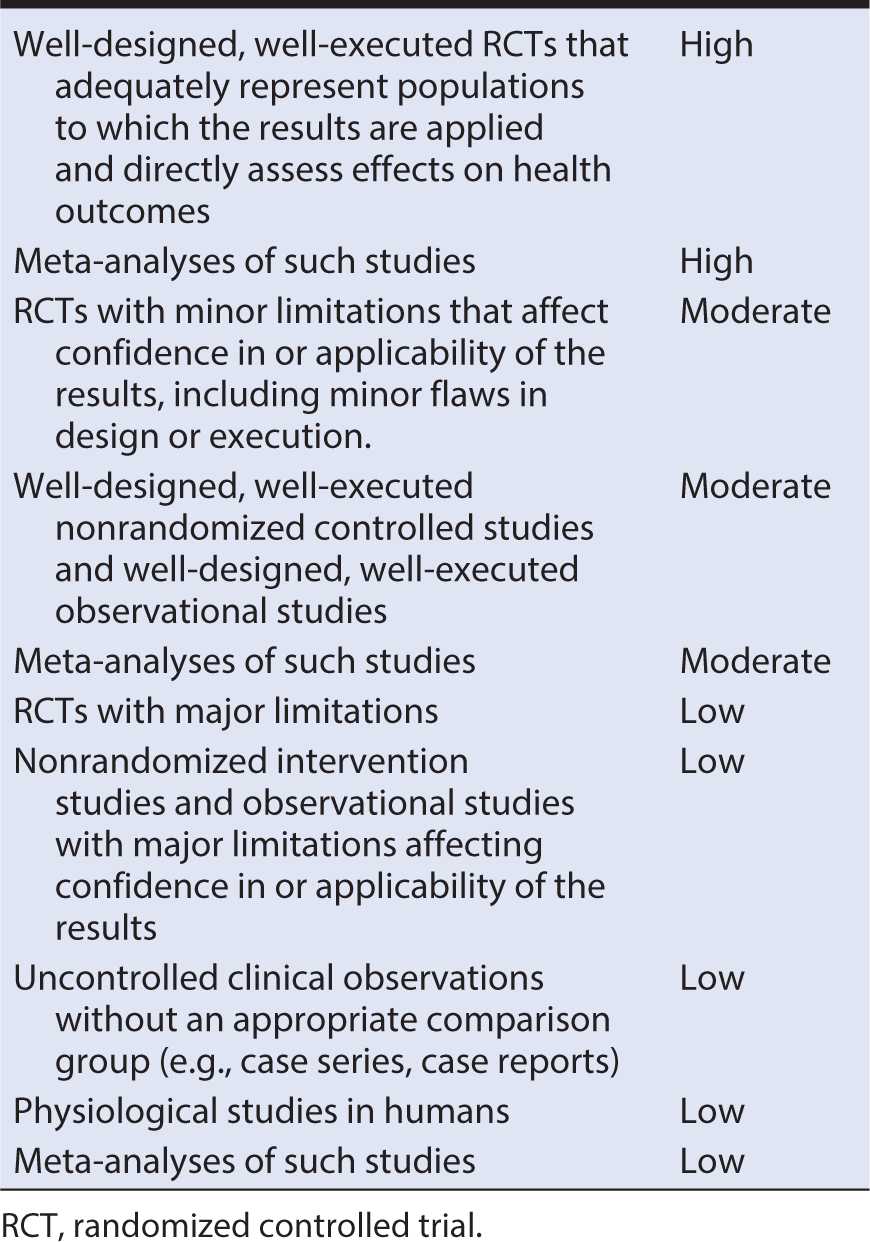
The assessment system is used to grade the body of the evidence and the strength of the clinical intervention. The evidence statements typically are graded as high, moderate, or low quality. Table 13-1 presents an example of an evidence quality grading system. Studies with results considered with high confidence to reflect the true effect, and further research is unlikely to change the high confidence are considered to be of high quality. Studies with moderate confidence that the evidence reflects the true effect, and further research may change the moderate confidence in the estimate of effect and may change the estimate are considered to be of moderate quality. Studies with low confidence that the evidence reflects the true effect, and further research is likely to change the low confidence in the estimate of effect and is likely to change the estimate are considered to be of low quality.
Table 13-1. Evidence quality grading system including types of evidence and strength of evidence grade.
Example 2: When Experimental and Observational Studies Differ
The strength of the body of evidence represents the degree of certainty, based on the overall body of evidence, that an effect or association is correct. Different types of studies often agree about the general direction of the evidence but vary concerning the strength. However, there are scenarios in which evidence from observational studies varies significantly from RCTs. A classic example of the limitations of observational studies compared with RCTs is the hormone replacement therapy (HRT) experience. Early on, the clinical enthusiasm for the use of HRT was based in part on the perception that it could lower women’s risk for heart disease, with some estimations as much as 50%. This attitude was encouraged by the consistent finding from observational studies that postmenopausal women users of HRT had substantially lower rates of cardiovascular events than nonusers. In addition, in vitro investigations and animal study results indicated favorable effects of HRT on cardiovascular risk factors, further supporting the observational study results. These findings and perceptions made HRT one of the most frequently prescribed medications in the United States despite the absence of any large RCTs.
The Heart and Estrogen/progestin Replacement Study (HERS) was the first major RCT of HRT for secondary prevention of heart disease. This study found an increased risk of heart disease rather than an overall benefit of hormone treatment. Further RCTs confirmed the conclusions of no benefit of HRT on atherosclerosis in women with established CVD, with a consistent suggestion that HRT might increase cardiovascular risk.
The discrepancy in the results of the observational studies and RCTs might be explained in part by healthy user bias in the observational studies because HRT users typically are healthier and have higher socioeconomic status than nonusers. Although most of the observational studies of HRT included adjustment for potential confounders, many failed to delete or adjust the apparent benefit in the analyses. Another explanation for the discordance between observational studies and clinical trials relates to differing ages and exposure durations to HRT. In many of the observational studies, HRT users included longer term users compared with subjects exposed experimentally in RCTs, and users in the general population tend to also use better tolerated HRTs, leading to increased exposure times. By ignoring timing persistence and tolerance of exposure to HRTs, different results and conclusions about potential risks and benefits for observational and RCT studies could be seen.
The HRT and heart disease scenario leads to two major considerations when judging evidence from observational studies:
• Observational data, clinical studies of intermediate endpoints, and in vitro and animal model research are useful for hypothesis generation, but they should not be considered adequate on their own to justify a broad-based pattern of clinical practice.
• The cardiovascular effects of estrogen are complex, with impacts on lipids, endothelial function, and other aspects of vascular biology producing a net increase in clinical cardiovascular events.
In the following sections, we will consider separately the assessment of quality of evidence from both experimental (RCT) and observational studies. In some settings, such as the JNC 8 review of hypertension, there may be substantial evidence from RCTs, so it is not necessary to include observational studies in the review. For other clinical questions, there may so few RCTs conducted that it is necessary to rely primarily on the results of observational studies. In between these two extremes is the relatively common situation in which there may be some RCTs but not enough to justify ignoring the results of observational studies. In this setting, even bearing in mind the potential for differing conclusions from RCTs and observational studies, there may be value to maximizing the use of all available information by including both types of research in the systematic review.
Regardless of the types of studies included, a fundamental task in a systematic review is to judge the quality of the evidence in the studies included. In essence, for each of the studies involved, one is trying to address two fundamental questions:
1. To what extent are the results of the study attributable to the intervention rather than to flaws in the design and conduct of the study (internal validity)?
2. To what extent can the results of the study be extrapolated to populations other than the one included (external validity)?
The answer to the first question relates primarily to judging the likelihood that the results could be attributable, in part or in whole, to distortions because of bias in the selection of subjects, the collection of information, or the mixture of the effect of interest with other determinants of the outcome (confounding). If a judgment is made that there is a high likelihood for bias, as occurred presumably in the observational studies on HRT use and risk of heart disease, the quality of evidence would be rated as poor. If the likelihood of bias is low, as in the HERS RCT of HRT, then the corresponding quality of evidence would be rated as high.
The answer to the second question concerning external validity relates to the extent to which the study population is likely to be broadly representative or not. The types of constraints that often are placed on a study population include considerations such as willingness to participate, age, gender, health status, treatment facility, region, and time period, among many other possible attributes. These constraints might be incorporated for purely logistical reasons for ease of accessing and following the subjects. Alternatively, the sample might be narrowed with the goal of reducing the potential influence of other prognostic factors. Regardless of the reason for restricting the characteristics of participants, narrow I/E criteria limit the ability to extrapolate the results to other populations.
In the following sections, we provide a framework for evaluating the quality of individual studies to be included in a systematic review. This framework is organized by the design of the research study involved because the type of issues that one must consider varies somewhat for RCTs, cohort studies, and case-control studies.
Quality Assessment of Controlled Intervention Studies
The guidance document below is organized from the tool for quality assessment of controlled intervention studies.
A study does not satisfy quality criteria as randomized simply because the authors call it randomized. Nonetheless, the study is reviewed initially if randomization is indicated.
2. Treatment allocation adequacy
The randomization is adequate if it occurred according to the play of chance (e.g., computer-generated sequence in more recent studies or random number table in older studies). Randomization is inadequate if there is a preset plan (e.g., alternation in which every other subject is assigned to treatment arm or another method of allocation is used, such as time or day of hospital admission or clinic visit, ZIP code, or phone number). This type of allocation is not true randomization. The assessment of randomization requires careful reading and consideration for the role of chance in assignment. For example, in group randomization, sites are randomized to receive treatment or not. All individuals at the site thereby are assigned to the same treatment group. Another approach is allocation concealment in which one does not know in advance, or one cannot guess accurately, to what group the next person eligible for randomization will be assigned. Methods include sequentially numbered, opaque, sealed envelopes; numbered or coded containers; central randomization by a coordinating center; and computer-generated randomization that is not revealed ahead of time.
3. Blinding
Blinding, or masking, means that one does not know to which group—intervention or control—the participant is assigned. It is important to consider who is blinded to knowledge of treatment assignment, which may include one or more of the following groups:
A. The person assessing the primary outcome(s) for the study (e.g., taking the measurements, examining medical records to determine type of event as in an adjudication committee)
B. The person receiving the intervention (e.g., the patient or volunteer participant)
C. The person providing the intervention (e.g., the physician, nurse, or behavioral interventionist)
Generally placebo-controlled medication studies are blinded to patient, provider, and outcome assessors; behavioral or lifestyle studies may often be blinded only to the outcome assessors. Sometimes the person providing the intervention is the same person doing the outcome assessment.
4. Similar characteristics of study groups at baseline
This assessment considers if the intervention and control groups have similar characteristics on average. A primary purpose of a randomization is to create similar groups to enable valid comparisons of intervention effects between or among groups. If there is a significant imbalance in prognostic factors between or among the groups, it may be detected during the review of baseline characteristics. Baseline characteristics for intervention groups usually are presented in a table in the article, typically the first table. It is possible for study groups to differ at baseline without adversely affecting the results if the differences are not of prognostic importance (i.e., would not be expected to have any bearing on the interventions and outcomes).
5. Dropout
Dropout refers to participants for whom there are no endpoint measurements. The most common reason for dropping out of the study is being lost to follow-up. Typically, an acceptable overall dropout rate is considered 20% or less of participants who were randomized or allocated into each group, and an acceptable differential dropout is considered an absolute difference between groups of no more than 15% (calculated by subtracting the dropout rate of one group minus the dropout rate of the other group). These are, however, general considerations and not absolute rules. Higher overall dropout rates might be acceptable in a longer term study or one that is particularly complicated. Likewise, a simple short-term trial might be expected to have a lower dropout rate. Regardless of overall dropout rates, if a differential of more than 15% exists between groups, there is a serious potential for bias.
6. Adherence
Adherence refers to whether the participants in each treatment group comply with the protocols for assigned interventions. For example, one might ascertain the percentage of patients who took the intervention (and comparison) drugs as prescribed.
7. Competing interventions
Changes that occur in the study outcomes being assessed should be attributable to the interventions being compared in the study. Distortion could occur if participants in any of the study groups receive other interventions that are not part of the study protocol but could affect the outcomes being assessed. If the use of other interventions is balanced between comparison groups, the expected effect is to reduce the apparent effect of the intervention. If the use of other interventions is unbalanced, however, the impact could be either to increase or decrease the observed effect.
8. Outcome measures assessment
The methods that were used to measure outcomes in the study should be assessed for validity, accuracy, reliability, and objectivity. This assessment is important because it indicates the confidence in the reported outcomes. Even more important is whether the outcomes were assessed in the same manner within groups and between groups.
9. Power calculation
In general, the current standard is to have at least 80% statistical power to detect a clinically relevant difference in an outcome using a two-sided type I error rate of 0.05. Negative results in small, underpowered studies do not provide compelling evidence of no effect.
10. Prespecified outcomes
Outcomes reported in the study must have been prespecified and define the whole purpose of doing an RCT. If outcomes are not prespecified, then the study may be reporting ad hoc analyses—simply looking for differences that support the findings they wanted. In addition to outcomes, the subgroups being examined should be prespecified. Multiple subgroup analyses can lead to spurious findings if statistical significance levels are not adjusted accordingly. Bearing this caveat in mind, it also is true that most RCTs conduct numerous post hoc analyses as a way of exploring findings and generating additional hypotheses. This may be justified given the time and expense of collecting these intervention data. Nevertheless, such findings must be considered exploratory and subject to confirmation in other studies.
11. Intent-to-treat (ITT) analysis
Intent to treat is an analysis approach that means participants who were randomized are analyzed according to the original group to which they are assigned even if they do not receive the treatment completely. This is an important concept because ITT analysis preserves the intended benefits of randomization. When the ITT analysis philosophy is not followed, it is not certain that the groups being compared are balanced in other important attributes. Some studies use a completer’s analysis (which analyzes only the participants that completed the intervention and the study), which introduces significant potential for bias because characteristics of participants who do not complete the study are unlikely to be comparable to those who do. The likely impact of participants who withdraw from the study treatment must be considered carefully.
12. General guidance for determining the overall quality rating
In addition to the considerations of quality identified above, some additional study attributes should be included in the overall assessment.
If a study has a fatal flaw, then the risk of bias is significant, and the study is of poor quality. Examples of fatal flaws in RCTs include high dropout rates, high differential dropout, no ITT analysis, or unsuitable statistical analysis (e.g., completers-only analysis). Typically in published studies, fatal flaws are not evident, but indicators of the risk of bias are found. By focusing on the concepts of quality, studies can be appraised uniformly and critically. It is important to think about the assessment categories and potential for bias within any study.
Quality Assessment of Cohort and Cross-Sectional Studies
The quality assessment for cohort and cross-sectional studies includes the clarity of the research question or research objective; the definition, selection, composition, and participation of the study population; the definition and assessment of exposure and outcome variables; the measurement of exposures before outcome assessment; the study timeframe and follow-up; study analysis and power; and other factors.
1. Research question
The study goal and research question should be clearly defined and appropriate to the research design. The research question should be obvious in the early assessment of the study.
2. Study population
This is the study participants who were selected or recruited, with regard to demographics, location, and time period. In cohort studies, it is crucial that the population at baseline is free of the outcome of interest. Also, if fewer than 50% of eligible persons participated in the study, then there is concern that the study population does not adequately represent the target population.
3. Groups recruited from the same population and uniform eligibility criteria
The I/E criteria developed before recruitment or selection of the study population should be clearly defined, as well as the underlying criteria used for all of the subjects involved. Most cohort studies begin with the selection of the source population(s); participants in this cohort are then measured or evaluated to determine their exposure status. However, some cohort studies may recruit or select exposed participants in a different time or place than unexposed participants. This approach typically is seen in retrospective cohort studies, which is when data are obtained from the past (retrospectively), but the analysis still examines exposures before outcomes.
4. Sample size justification
A discussion of statistical power may be found in the Discussion section of the paper (e.g., the study had 85% power to detect a 20% increase in the rate of an outcome of interest, with a two-sided alpha of 0.05). Observational cohort studies, however, often do not report anything about statistical power or sample size because the analyses are exploratory in nature. This is not necessarily a “fatal” flaw but rather indicates that the study was exploratory or hypothesis generating.
5. Exposure assessed before outcome measurement
Temporality is important because to determine whether an exposure causes an outcome, the exposure must occur before the outcome. For some prospective cohort studies, the investigator enrolls the cohort and then determines the exposure status of various members of the cohort. Elsewhere, the cohort is selected based on its exposure status. An example of the latter is a cohort identified by its exposure to fluoridated drinking water and then compared with a cohort living in an area without fluoridated water. Another example is a cohort of military personnel exposed to combat compared with a cohort of military personnel not deployed in a combat zone. With either of these types of cohort studies, the cohort is followed forward in time to assess the outcomes that occur subsequently among the exposed compared with the nonexposed.
For retrospective cohort studies, the same principle applies. The difference is that rather than identifying a cohort in the present and following them forward in time, the investigators go back in time (i.e., retrospectively) and select a cohort based on their exposure status in the past and then follow them forward to assess the subsequent outcomes that occurred in the exposed and nonexposed cohort members. In retrospective cohort studies, the exposure and outcomes both may have occurred already, so it is important to make sure that the exposure preceded the outcome.
Sometimes cross-sectional studies are conducted (or cross-sectional analyses of cohort study data) in which the exposures and outcomes are measured during the same timeframe. As a result, cross-sectional analyses provide weaker evidence than cohort studies regarding a potential causal relationship between exposures and outcomes because the sequence of occurrence (temporality) of exposure and outcome are obscured.
6. Sufficient timeframe for an effect
The issue of timeframe is important to enable meaningful analysis of the relationships between exposures and outcomes to be conducted. This depends on the research question and outcomes being examined. When looking at chronic health outcomes, it often requires at least several years.
Cross-sectional analyses allow no time to see an effect because the exposures and outcomes are assessed at the same time.
7. Different levels of the exposure of interest
If the exposure can be defined in graded levels (e.g., drug dosage, amount of physical activity, amount of sodium consumed), were multiple categories of that exposure assessed (e.g., for medications: no use, low dose, medium dose, high dose; for dietary sodium intake: higher than average U.S. consumption, average consumption, and lower than average consumption)? Sometimes discrete categories of exposure are not used, but instead exposures are measured as continuous variables (e.g., milligrams per day [mg/day] of dietary sodium or millimeters of mercury [mm Hg] for blood pressure values).
In any case, studying different levels of exposure (when possible) enables investigators to assess trends or dose-response relationships between exposures and outcomes. The presence of trends or dose-response relationships lends credibility to the hypothesis of causality between exposure and outcome.
For some exposures, however, this question may not be applicable; for example, the exposure may be a dichotomous variable (e.g., living in a rural setting vs. an urban setting or vaccinated vs. not vaccinated).
8. Exposure measures and assessment
When exposures are measured with less accuracy or validity, it is harder to see an association between exposure and outcome even if one exists. Also important is whether the exposures were assessed in the same manner within groups and between groups; if not, bias may result.
For example, retrospective self-report of dietary salt intake is not as valid and reliable as prospectively using a standardized dietary log plus testing participants’ urine for excreted sodium. Another example is measurement of blood pressure; there may be quite a difference between usual care (e.g., routine measurements in physician’s practices) or use of trained blood pressure assessors using standardized equipment and a standardized protocol.
If individuals with hypertension (exposed cohort) are seen by their providers more frequently than normotensives (nonexposed group), it also increases the chances of detecting and documenting changes in health outcomes, including CVD-related events. Therefore, it may produces the conclusion that hypertension produces more CVD events when it is just a product of greater surveillance. Thus, it could bias the results and lead to an erroneous conclusion.
9. Repeated exposure assessment
Multiple measurements with the same result increase confidence that the exposure status was classified correctly. Multiple measurements also enable investigators to look at changes in exposure over time (e.g., individuals who ate high dietary sodium throughout the follow-up period compared with those who started out high and then reduced their intake compared with those who ate low sodium throughout). Again, this may not be applicable in all cases. In many older studies, exposure was measured only at baseline. Multiple exposure measurements provide stronger evidence for exposure–outcome associations.
10. Outcome measures
The study outcomes should be defined in detail. The tools and methods for measuring outcomes should be accurate and reliable with clear quality indicators. Also important is whether the outcomes were assessed in the same manner within groups and between groups.
An example of an outcome measure that is objective, accurate, and reliable is death—the outcome measured with more accuracy than any other. But even with a measure as objective as death, there can be differences in the accuracy and reliability of how death was assessed by the investigators. For example, was the cause of death assigned from an autopsy report, death certificate, death registry, or report from a family member? Sometimes the outcome is based on a biomarker. For example, in a study of whether dietary fat intake is related to blood cholesterol level, the cholesterol level is measured from fasting blood samples that are all sent to the same laboratory. Similar to the example cited earlier, results may be biased if one group (e.g., hypertensive individuals) is seen more frequently than another group (e.g., normotensive individuals) because more frequent encounters with the health care system increases the chances of outcomes being detected and documented.
11. Blinding of outcome assessors
Blinding in this case means that outcome assessors did not know whether individual participants were exposed or unexposed. It is also sometimes called “masking.” The objective is to look for evidence in the article that the person(s) assessing the outcome(s) for the study (e.g., examining medical records to determine the outcomes that occurred in the exposed and comparison groups) is masked to the exposure status of the participant. Sometimes the person measuring the exposure is the same person who conducts the outcome assessment. In this case, the outcome assessor would most likely not be blinded to exposure, although in very large cohorts, recall of individual subjects may be limited. It is important to consider whether it is likely that the person(s) doing the outcome assessment would know (or be able to figure out) the exposure status of the study participants. If the answer is “no,” then blinding is adequate. One approach to blinding of the outcome assessors is to create a separate committee, whose members were not involved in the care of the patient and had no information about the study participants’ exposure status. The committee would then be provided with copies of participants’ medical records, which would be stripped of any potential exposure information or personally identifiable information. The committee would then review the records for prespecified outcomes according to the study protocol. In some situations, blinding is not possible, and the potential for bias must be weighed.
12. Follow-up rate
Higher overall follow-up rates always are better than lower follow-up rates, even though higher rates are expected in shorter studies, and lower overall follow-up rates often are seen in studies of longer duration. For example, a 6-month cohort study examining the relationship between dietary sodium intake and blood pressure level may have a more than 90% follow-up rate, but a 20-year cohort study examining effects of sodium intake on stroke may have only a 65% follow-up rate. As a guideline, an acceptable overall follow-up rate is considered 80% or more of participants whose exposures were measured at baseline. The greater loss-to-follow-up is a potential concern if subjects who are lost differ from those followed.
13. Statistical analyses
Statistical analyses need to control for potential confounders, in contrast to an RCT in which randomization tends to limit the potential of confounders. All key factors that may be associated both with the exposure of interest and the outcome—that are not intermediaries in the association of interest—should be controlled for in the analyses.
For example, in a study of the relationship between cardiorespiratory fitness and heart attacks and strokes, the study should control for age, blood pressure, blood cholesterol, and body weight because all of these factors are associated both with low fitness and with heart attacks and stroke.
14. General guidance for determining the overall quality rating
Internal validity for cohort studies is the extent to which the results reported in the study can truly be attributed to the exposure being evaluated and not to flaws in the design or conduct of the study. In other words, can one draw associative conclusions about the effects of the exposures being studied on outcomes?
Critical appraisal involves considering the risk for potential for selection bias, information bias, measurement bias, or confounding (the mixture of exposures that one cannot tease out from each other). Examples of confounding include cointerventions or differences at baseline in patient characteristics. A high risk of bias in a study requires that it be rated as being of “poor” quality. A low risk of bias in a study allows it to be rated of good quality. In addition, the more attention in the study design to issues that can help determine whether there is a causal relationship between the exposure and outcome, the higher the quality of the study. These attributes include exposures occurring before outcomes, evaluation of a dose-response gradient, accuracy of measurement of both exposure and outcome, sufficient timeframe to see an effect, and appropriate control for confounding.
Quality Assessment of Case-Control Studies
The quality assessment tool for case-control studies includes clarity of the research objective or research question; definition, selection, composition, and participation of the study population; definition and assessment of case or control status; exposure and outcome variables; use of concurrent controls; confirmation that the exposure occurred before the outcome; statistical power; and other factors.
1. Research question
Was the study designed to answer a clear predetermined question, or was it exploratory in nature?
2. Study population
Case-control study populations are determined by the location, time period, and inclusion criteria for cases (individuals with the disease or health problem) and controls (individuals without the disease or health problem). Selection criteria should address how the disease was diagnosed, whether cases were limited to those newly diagnosed, when and where cases were sampled, and any other selection factors. The choice of controls is even more challenging in order to assemble an unbiased comparison group, and the source and approach to sampling should be appropriate to the study question.
Other studies may use disease registries or data from cohort studies to identify cases, in which case the populations are individuals in the area covered by the disease registry or included in a cohort study (i.e., nested case control or case cohort). For example, a study of the relationship between vitamin D intake and myocardial infarction (MI) might use patients identified via a database of heart attack patients.
3. Target population and case representation
For a study to truly address the research question, the target population, the population from which the study population is drawn and to which study results are believed to apply, should be defined carefully. Some authors may compare characteristics of the study cases with characteristics of cases in the target population. When study cases are shown to be representative of cases in the appropriate target population, it increases the likelihood that the study was well designed for the research question.
Because these statistics frequently are difficult or impossible to measure, however, publications should not be penalized unduly if case representativeness is not documented.
4. Sample size justification
Generally, the sample size needed to detect differences in exposures should be discussed or a presentation should be made about the statistical power to detect an association of the magnitude anticipated.
5. Groups recruited from the same population
To determine whether cases and controls were recruited from the same source population, it is important to consider if a control was to develop the outcome of interest (the condition that was used to select cases), would she or he have been eligible to become a case? For example, cases and controls may be recruited from hospitals in a given region. It may be reasonable to assume that controls in the catchment area for the hospitals, or those already in the hospitals for a different reason, would attend those hospitals if they became a case; therefore, the controls are drawn from the same population as the cases.
In a prospective case-control study, participants are enrolled as cases at the time they are found to have the outcome of interest; the number of cases increases as time progresses. In this type of study, controls may be recruited or selected from the population without the outcome of interest at the time the case is diagnosed. Cases may be identified or recruited through a surveillance system, with controls selected from the population covered by that surveillance system; this is an example of population-based controls. If cases are selected from a cohort study population, then controls may be sampled from the cohort study population as well. This is known as a nested case-control study.
6. I/E criteria prespecified and applied uniformly
The same selection criteria should be used for cases and controls except, of course, for whether or not they had the disease or condition of interest. Typical criteria include age (or age range), gender, race, and so on. If the inclusion criteria are highly selective, the ability to extrapolate results beyond the study population may be limited.
7. Case and control definitions
A specific description of “case” and “control” should be defined, with a discussion of the validity of the case and control definitions and the processes or tools used to identify study participants. The more definitive the diagnostic process, the better for the purposes of validity. All cases should be identified using the same methods. Study results cannot be used to draw valid conclusions unless the distinction between cases and controls is accurate and reliable.
8. Random selection of study participants
If a case-control study did not use 100% of eligible cases and controls (e.g., not all disease-free participants were included as controls), did the authors indicate that random sampling was used to select controls? When it is possible to identify the source population fairly explicitly (e.g., in a nested case-control study or in a registry-based study), then random sampling of controls is preferred. If consecutive sampling was used, as frequently occurs for cases in prospective studies, then study participants were not randomly selected, but unless there is some inherent lack of independence between cases, this is not necessarily an issue of great concern.
9. Concurrent controls
A concurrent control is selected at the same time as a case. This means that one or more controls are recruited or selected from the population without the outcome of interest at the time a case is diagnosed. Concurrent controls tend to reduce the potential for bias if exposure patterns vary over time. This can be done in both prospective case-control studies and retrospective case-control studies. It also can be done in hospital-based samples, population-based samples, and case-control studies nested within a cohort.
The use of concurrent controls can be done in the presence or absence of matching and vice versa. Just because a study incorporates matching does not necessarily mean that concurrent controls were used.
10. Exposure assessed before outcome measurement
Because the case or control status is determined first (based on the presence or absence of outcome of interest) and then the exposure history of the case or control is assessed, it is important to make sure that the exposure actually occurred before the outcome. For example, if tissue samples were used to determine exposure, were the tissue samples collected from patients before their diagnosis? If hospital records were used, did investigators verify that the date that a patient was exposed (e.g., received medication for hypertension) occurred before the date that a person became a case (e.g., was diagnosed with MI)? For an association between an exposure and an outcome to be considered causal, the exposure must occur before the outcome.
11. Exposure measures and assessment
Are measures of exposure accurate and reproducible? Equally important is whether the exposures were assessed in the same manner within groups and between groups. In a case-control study, one often has to rely on historical information about exposure. Personal recall is a relatively weak method of exposure classification, but it may be all that is available to the investigator. If disease status could affect recall, a potential bias (“recall bias”) may occur.
12. Blinding of exposure assessors
Blinding in this case means that persons assessing the exposure status of study participants did not know whether the participant was a case or a control. The objective is to look for evidence in the article that the person assessing the exposure(s) (e.g., examining medical records to determine the exposures that occurred in the cases and controls) is masked to the case or control status of the participant. Sometimes it is not possible to blind the disease status because it is so obvious (e.g., many serious illnesses). If interviews are conducted with the cases and controls, it would be important to ensure that the interviewers are blinded to the research question of interest.
If the investigators used medical records to assess exposure, the following attributes favor blinding:
• Assessors not directly involved in the care of the study subjects because they would probably have knowledge of the conditions of their patients.
• If the medical record contained information on the patient’s condition that identified him or her as a case (which is likely), that information would have to be removed before the exposure assessors reviewed the records.
• At a minimum, the record abstractors should be blinded to the research question of interest.
13. Statistical analysis
Logistic regression or other multiple regression methods often are used to adjust for the influence of variables other than the exposure of interest. This is a key issue in case-control studies, in contrast to an RCT in which the randomization process tends to control for potential confounders. All key factors that may be associated both with the exposure of interest and the outcome should be controlled for in the analyses. Most well-designed case-control studies control for multiple potential confounders.
Matching is a technique used in an effort to improve study efficiency and control for known confounders. For example, in a study of smoking and CVD events, one might identify cases who had a heart attack or stroke and then select controls of similar age, gender, and body weight to the cases. For case-control studies, it is important that if matching was performed during the selection or recruitment process, it should be considered in the analysis.
14. General guidance for determining the overall quality rating
Internal validity for case-control studies is the extent to which the associations between disease and exposure reported in the study can truly be attributed to the exposure being evaluated and not to flaws in the design or conduct of the study. In other words, what is the ability of the study to draw associative conclusions about the effects of the exposures being studied on outcomes? Any such study limitations and weaknesses can increase the risk of bias. Critical appraisal involves considering the risk for potential for selection bias, information bias, measurement bias, or confounding (the mixture of exposures that one cannot tease out from each other). Examples of confounding include co-interventions, differences at baseline in patient characteristics, and other issues throughout the questions above. The greater the risk of bias, the lower the quality rating of the study.
a. Risk of bias
Risk of bias refers to the likelihood that the body of included studies for a given question or outcome is distorted because of flaws in the results of design or conduct of the studies. Risk of bias and internal validity are similar concepts that are inversely correlated. A study with a low risk of bias has high internal validity and is more likely to provide correct results than one with high risk of bias and low internal validity. At the individual study level, risk of bias is determined by rating the quality of each individual study using standard rating instruments. Overall risk of bias for the body of evidence regarding a particular question, summary table, or outcome is then assessed by the aggregate quality of studies available for that particular question or outcome. If the risk of bias is low, then it increases the rating for the strength of the overall body of evidence. If the risk of bias is high, then it decreases the strength of evidence rating.
b. Consistency
Consistency is the degree to which reported effect sizes are similar across the included studies for a particular question or outcome. Consistency, when present, enhances the overall strength of evidence and is assessed through effect sizes being in the same direction (i.e., multiple studies demonstrate an improvement in a particular outcome) and the range of effect sizes across studies being narrow. Inconsistent evidence is reflected in:
• Effect sizes that are in different directions
• A broad range of effect sizes
• Non-overlapping confidence intervals
• Unexplained clinical or statistical heterogeneity
Studies included for a particular question or outcome can have effect sizes that are consistent, inconsistent, or unknown (or not applicable). The latter occurs when only a single study is available.
c. Directness
Directness has two aspects: the direct line of causality and the degree to which findings can be extended from a specific population to a more general population. The first defines directness as whether the evidence being assessed reflects a single direct link between the intervention (or service, approach, or exposure) of interest and the ultimate health outcome under consideration. Indirect evidence relies on intermediate or surrogate outcomes that serve as links along a causal pathway. Evidence that an intervention results in changes in important health outcomes (e.g., mortality, morbidity) increases the strength of the evidence. Evidence that an intervention results in changes limited to intermediate or surrogate outcomes (e.g., a blood measurement) decreases the strength of the evidence. However, the importance of each link in the chain should be considered, including existing evidence that a change in an intermediate outcome affects important health outcomes.
Another example of directness involves whether the bodies of evidence used to compare interventions are the same. For example, if drug A is compared with placebo in one study and drug B is compared with placebo in another study, using those two studies to compare drug A with drug B yields indirect evidence and provides a lower strength of the evidence than direct head-to-head comparisons of drug A versus drug B.
The second aspect of directness refers to the degree to which participants or interventions in the study are different from those to whom the study results are being applied. This concept is referred to as applicability or generalizability. If the population or interventions are similar, then the evidence is direct and strengthened. If they are different, then the evidence is indirect and weakened.
d. Precision
Precision is the degree of statistical certainty about an estimate of effect for a specific outcome of interest. Indicators of precision are statistical significance and confidence intervals. Precise estimates enable conclusions to be drawn about an intervention’s effect relative to another intervention or control. An imprecise estimate is one in which the confidence interval is so large that the superiority or inferiority of an intervention cannot be defined with relevant specificity. Precision is related to the statistical power of the study. An outcome that was not the primary outcome or not prespecified generally will be less precise than the primary outcome of a study. In a meta-analysis, precision is reflected by the confidence interval around the summary effect size. For systematic reviews, which include multiple studies but no quantitative summary estimate, the quantitative information from each study should be considered in determining the overall precision of the body of included studies because some studies may be more precise than others. Determining precision across many studies without conducting a formal meta-analysis is challenging and requires judgment. Whereas a more precise estimate increases the strength of evidence, less precision reduces the strength of a body of evidence.
Quality Assessment of Systematic Reviews and Meta-Analyses
The quality assessment for systematic reviews and meta-analyses includes elements of prespecified eligibility criteria, use of a comprehensive and systematic literature search process, dual review for abstracts and full-text articles, quality assessment of individual studies, assessment of publication bias, and other factors. Some specific factors to consider are detailed next.
1. Focused question
The review should be based on a question that is clearly stated and well formulated. An example would be a question that uses the PICO (population, intervention, comparator, outcome) format, with all of the components clearly described.
2. Eligibility criteria
The eligibility criteria used to determine whether studies were included or excluded from the review should be clearly specified and predefined.
3. Literature search
The search strategy should employ a comprehensive, systematic approach to capture all of the evidence possible that pertains to the question of interest. At a minimum, a comprehensive review should have the following attributes:
• Electronic searches were conducted using multiple scientific literature databases such as MEDLINE, EMBASE, Cochrane Central Register of Controlled Trials, PsychLit, and others as appropriate for the subject matter.
• Manual searches of references found in articles and textbooks should supplement the electronic searches.
Additional search strategies that may be used to improve the yield of potential studies include the following:
• Studies published in a range of countries and different populations
• Studies published in languages other than English
• Use of content area experts to identify studies and articles that may have been missed
• Search of the grey (non–peer-reviewed) literature, which includes technical reports and other papers from government agencies or scientific groups or committees, presentations and posters from scientific meetings, conference proceedings, unpublished manuscripts, and so on. A search of the grey literature is important (whenever feasible) because sometimes only positive studies with significant findings are published in the peer-reviewed literature, which can bias the results of a review.
The literature search strategy should be described clearly in the review and be reproducible by others.
4. Dual review for determining which studies to include and exclude
Titles, abstracts, and full-text articles (when indicated) should be reviewed by two independent reviewers to determine which studies to include or exclude from the review. Disagreements between the reviewers should be resolved by discussion and consensus or with third-party involvement. The process for review, including methods for adjudicating disagreements, should be stated clearly.
5. Quality appraisal for internal validity
Each included study should be appraised for internal validity (study quality assessment) using a standardized approach for rating the quality of the individual studies. Ideally, this should be done by at least two independent reviewers. However, because there is not one commonly accepted, standardized tool for rating the quality of studies, at a minimum, the goal should be to show that individual study quality was assessed and adequately described by the authors.
6. List and describe included studies
All of the included studies should be listed in the review along with descriptions of their key characteristics. This can be presented in narrative or tabular format.
7. Publication bias
Publication bias is when studies with positive results have a higher likelihood of being published, being published rapidly, being published in higher impact journals, being published in English, being published more than once, or being cited by others. Publication bias can be linked to favorable or unfavorable treatment of research findings by any of the following: the investigators, editors, industry sponsors, or peer reviewers. A strategy that can minimize the potential for publication bias is to conduct a very comprehensive literature search. A funnel plot is a commonly used graphical method for detecting publication bias. The funnel plot is a scatter plot of component studies in a meta-analysis. The graph looks like a symmetrical inverted funnel if there is no significant publication bias.
8. Heterogeneity
Heterogeneity is used to describe important differences in the included studies of a meta-analysis that may make it inappropriate to combine the results of studies. Heterogeneity can be clinical (e.g., important differences between study participants, baseline disease severity, interventions), methodologic (e.g., important differences in the design and conduct of the study), or statistical (e.g., important differences in the quantitative results or reported effects). Clinical or methodologic heterogeneity usually is assessed qualitatively by determining whether it makes sense to combine studies. An example of clinical heterogeneity is whether a study that involves elderly male smokers with hypertension could be combined with a study that involves healthy, nonsmoking adults ages 18 to 40 years. Methodologic heterogeneity is illustrated by the question of whether studies that use an RCT design could be combined with studies that use observational study designs.
Statistical heterogeneity describes the degree of variation in the effect estimates from a set of studies and is assessed quantitatively. The two most common methods used to assess statistical heterogeneity are the Q test (also known as the χ2 or chi-square test) or I2 test.
An assessment for heterogeneity should be conducted and clearly described. If the studies are found to be heterogeneous, the investigators should explore and explain the causes of the heterogeneity, and they should determine what influence, if any, the study differences had on the overall study results.
SUMMARY
In this chapter, we have introduced the process involved in the assessment of medical literature using as an illustrative model the work of the JNC 8 review of the treatment of hypertension. A systematic review conducted for the purpose of developing treatment guidelines should have a number of key elements, including (1) framing of a question(s) that is (are) relevant to clinical practice, (2) choosing I/E criteria appropriate to the questions of interest, (3) conducting a thorough screening process for literature relevant to the question of interest, (4) assessing the quality of each study included in the review, (5) abstracting essential information from each included study into a database, (6) constructing evidence tables that summarize the abstracted data from the database, and (7) evaluating the summary tables in order to derive evidence statements about the questions of interest.
One of the most fundamental and challenging tasks in this process is the fourth item above—judging the quality of each included study. A framework for doing so is included in this chapter, recognizing that such an assessment must be adapted to the types of studies being reviewed. In general, the strongest evidence comes from RCTs. In situations, such as the literature reviewed by the JNC 8, when many RCTs have been performed, a judgment may be made to exclude from consideration evidence derived from observational studies. In many other situations, however, there may be too few RCTs available, or those that are available have such major design limitations that the evidence base needs to be augmented by the inclusion of observational studies.
Assessment of the quality of studies is motivated by the desire to determine the level of confidence that can be placed in the accuracy (validity) of their conclusions. It is useful to dissect out two different aspects of validity. The first domain is the extent to which the study provides a correct answer for the population that was studied (internal validity). Limitations in internal validity relate to aspects of the design or execution of the study that may have led to a distorted result. We refer to such a distortion as a bias and conventionally group these distortions into broad categories related to the selection of study subjects, the information collected on the study participants, and the mixing (or confounding) of the effect of interest with other factors that may influence the outcome. A second broad category of validity is so-called external validity, which relates to the ability to extend the findings from the study population to other groups who were not studied. In general, the more restrictive the inclusion criteria for the study sample, the more one is concerned about the ability to extrapolate the findings to other people who were not studied.
For RCTs, the typical elements of quality assessment include whether randomization was performed correctly and achieved the intended results, whether the observers were adequately blinded, whether the sample size was sufficient, whether dropout rates were acceptably low, whether the subjects adhered to their assigned treatment regimens, and whether the appropriate analysis was performed. For cohort studies, the principal elements of quality assessment include whether the study groups were chosen appropriately, whether the exposure was measured adequately and assessed before outcome determination, whether the sample size was sufficient to observe an effect, whether sufficient time was allowed to observe an effect and the dropout rate was acceptable, whether the outcome was measured adequately, whether a gradient of effect was assessed, and whether the appropriate analysis was performed. For case-control studies, the key elements of quality assessment include whether the definition of cases was sufficient, whether controls came from the same time period and source population that gave rise to the cases, whether exposure occurred before outcome development and was measured appropriately, whether the sample size was sufficient to observe an effect, and whether the appropriate analysis was performed.
The JNC 8 review of RCTs led to some clear recommendations for pharmacologic treatment of high blood pressure. Specifically, for all persons 60 years of age or older, patients with blood pressures above 150 mm Hg systolic or 90 mm Hg diastolic should receive pharmacologic therapy with a goal of reaching those specified blood pressure targets. For persons 30 to 59 years of age, the same diastolic blood pressure target was established, but a systolic blood pressure target could not be established for persons younger than age 60 years. These and other findings can help guide appropriate evidence-based care for patients with high blood pressure.

1. All of the following would be considered providing low quality of evidence EXCEPT
A. RCTs with major limitations.
B. case reports of clinical observations.
C. physiological measurement studies.
D. well-designed, well-executed observational studies.
E. none of the above.
2. Which of the following types of studies typically is considered to provide the strongest quality of evidence?
A. Well-designed, well-executed nonrandomized intervention studies
B. Well-designed, well-executed randomized intervention studies
C. Well-designed, well-executed observational studies
D. Well-designed, well-executed case series
E. Well-designed, well-executed physiological measurement studies
3. Which of the following associations is an example in which the results of observational studies and RCTs reached differing conclusions?
A. Cholesterol reduction and lowered risk of recurrent MIs
B. Hypertension control and reduced risk of stroke
C. Hormone replacement therapy and reduced risk of cardiovascular disease
D. Aspirin use and reduced risk of cardiovascular disease
E. Blood glucose control and reduced risk of complications of diabetes mellitus
4. The IOM’s “best practice” standards for developing evidence-based clinical guidelines include all of the following EXCEPT
A. use of a systematic review.
B. consideration of patient subgroups and preferences.
C. a process to minimize biases.
D. ratings of the quality of the evidence.
E. none of the above.
5. A study with highly restrictive inclusion criteria is likely to be limited with respect to
A. internal validity.
B. face validity.
C. ecologic validity.
D. external validity.
E. construct validity.
6. Which of the following study designs is LEAST susceptible to the potential distortion from confounding?
A. An RCT
B. A correlation (ecologic) study
C. A cross-sectional study
D. A case-control study
E. A cohort study
7. Which of the following is NOT a potential fatal flaw for an RCT?
A. High dropout rates
B. Too short a follow-up period for the outcome of interest
C. Restrictive inclusion criteria
D. No intention-to-treat analysis
E. None of the above
8. A study with too few subjects to detect an effect of moderate magnitude is said to be limited with respect to statistical
A. significance.
B. power.
C. sampling.
D. control.
E. dispersion.
9. Which of the following study designs has the greatest potential for recall bias?
A. A crossover RCT
B. A prospective cohort study of hospital records of elderly subjects
C. An RCT conducted many years ago
D. A prospective cohort study using administrative data
E. A case-control study with exposures classified from subject interviews
10. In an evaluation of a systematic review, which of the following is a strategy to maximize the yield of studies reviewed?
A. Include research from a broad range of countries
B. Include studies published in a wide variety of languages
C. Include research not published in the peer-reviewed literature
D. Include content area experts to identify any missing studies
E. All of the above
Stay updated, free articles. Join our Telegram channel

Full access? Get Clinical Tree


