Systems of Health Care Delivery


Systems of Health Care Delivery


The United States has the most advanced medical technology and the most highly trained physicians in the world. However, when compared to people in many other developed countries, Americans have shorter life expectancies (Table 27-1) and a greater probability of dying in infancy (Fig. 27-1). The explanation for this counterintuitive concurrence lies to some extent in the structure of the American health care system.

The United States is one of the few industrialized countries that does not have publicly mandated and funded health care insurance coverage for all citizens. The elderly, the chronically disabled, and the indigent have government-funded health care insurance through Medicare and Medicaid (see later text). Other Americans, however, must either obtain health insurance through their employers or pay out-of-pocket for their insurance or health care. This situation, in part, explains why Americans average fewer visits to physicians per year than people in other developed countries, often relying instead on over-the-counter medications and home treatments.

Throughout this book, the relationship between behavior and illness has been discussed. This chapter addresses the challenges that ill Americans face in obtaining the world’s finest health care and, significantly, in paying for that care.


• DEMOGRAPHICS OF HEALTH

Socioeconomic status (SES), gender, and age are important variables in health and in obtaining health care in the United States.


SES and health

SES, a construct determined primarily by occupation, education, and income, correlates directly with health status. People with lower SES typically have poorer mental and physical health and decreased life expectancies than those with higher SES.

In the United States, approximately 85% of people with low SES are African American or Latino. Thus, these ethnic groups are at higher risk than the white population for several medical conditions (see Chapter 20) and for dying young (see Chapter 4). Among white Americans, those with low SES also are at higher risk for illness and early death.

Patients with high SES are more likely to seek treatment in a timely fashion, whereas low-SES patients are more likely to delay seeking treatment. Because of this delay, by the time a poor person is seen, he or she is often severely ill, making treatment more difficult and expensive. High-SES patients are also more likely to visit private doctors’ offices than are
low-income patients, who tend to go to hospital emergency rooms (ERs). Although hospital ER visits are more expensive than private doctors’ office visits, doctors in private practice can refuse to see patients who cannot pay them. In contrast, because of the Emergency Medical Treatment and Active Labor Act (EMTALA), most hospital ERs are responsible for stabilizing every patient who presents for treatment, even those unable to pay.


table 27.1 LIFE EXPECTANCY (IN YEARS) AT BIRTH IN SELECTED COUNTRIES (IN ALPHABETICAL ORDER) BY THE UNITED NATIONS (2005-2010)


LIFE EXPECTANCY (YEARS)


Member State


Both Sexes


Males


Females


Australia


81.2


78.9


83.6


Canada


80.7


78.3


82.9


France


80.7


77.1


84.1


Germany


79.4


76.5


82.1


Italy


80.5


77.5


83.5


Japan


82.6


78.0


86.1


Spain


80.9


77.7


84.2


Sweden


80.9


78.7


83.0


The United Kingdom


79.4


77.2


81.6


The United States


78.2


75.6


80.8


Source: United Nations, Department of Economic and Social Affairs, Population Division (2007). World Population Prospects: The 2006 Revision, Highlights, Working Paper No. ESA/P/WP.202. Table A.17.


In addition to the added difficulty that the poor face in obtaining health care, poorer diet (Flegal et al., 2002) and habits, such as smoking and alcohol abuse, are seen more commonly in people with low SES and contribute to their increased risk for physical and emotional illness.


Gender and health

The sex difference in life expectancy starts early; males are more likely than females to die in the first 5 years of life and in young and middle adulthood. There also are sex differences in the risk of having certain illnesses in adulthood. For example, women are at higher risk than men are for developing autoimmune disorders (Table 27-2).

Men are more likely to have heart disease than women are. However, when women, particularly those under 55 years of age, have their first heart attack, they are less likely than men to undergo diagnostic and therapeutic procedures and more likely than men to die (Vaccarino et al., 1999). This sex difference in death rate after heart attack has been attributed to sex differences in reactions to medications, presentation of symptoms, and other physiological factors. However, it has also been attributed to missed or delayed diagnoses of heart problems in women resulting from the societal stereotype that only men have heart disease (Wong, 2001).

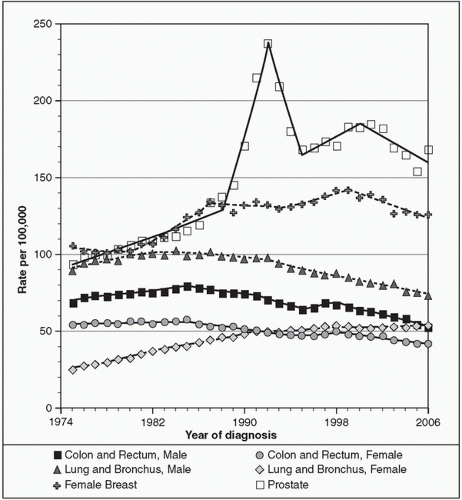
Smoking rates in American women, lower than in men in past years, now equal or exceed those of men. Thus, unsurprisingly, lung cancer rates in American women have been increasing. Figure 27-2 shows incidence rates from 1974 to 2006 for the most common types of cancer in women and men.

No matter what the illness, gender differences exist in the frequency of seeking medical care. With the same symptom severity, women seek medical treatment more often than men do.


Age and health

Children are more likely than young and middle-aged adults to require medical treatment. However, of all age groups, the elderly are at highest risk for physical and mental illness. Although they comprise only 12% of the
population, the elderly currently incur at least 30% of all health care costs. Because of the increasing number of elderly Americans (see Chapter 4), that percentage is expected to rise to 50% by the year 2020. The leading causes of death in the United States are listed in Table 27-3.


FIGURE 27-1. Comparison of Infant Mortality Rates in Selected Countries ( Modified from CDC. (2009). Behind international rankings of infant mortality: how the United States compares with Europe. NCHS Data Brief, 23. Figure 1.)


table 27.2 FEMALE-TO-MALE RATIOS OF COMMON AUTOIMMUNE DISORDERS


DISORDER


FEMALE:MALE RATIO


Hashimoto thyroiditis


10:1


Primary biliary cirrhosis


9:1


Chronic active hepatitis


8:1


Graves’ hyperthyroidism


7:1


Systemic lupus erythematosus


6:1a


Scleroderma


3:1


Rheumatoid arthritis


2.5:1


Idiopathic thrombocytopenia purpura


2:1a


Multiple sclerosis


2:1


Autoimmune hemolytic anemia


2:1


a Ratio is age specific.


Adapted with permission from Wizeman, T. M., and Pardue, M.L. (2001). Exploring the biological contributions to human health: Does sex matter? Washington, DC: National Academy Press, p. 149.


FIGURE 27-2. Rates of new cases of the most common cancers, delay-adjusted cancer incidence by site and sex: 1975-2006. (Source: Seer Program, National Cancer Institute.)


• HEALTH CARE DELIVERY SYSTEMS


Hospitals

The United States has close to 6,000 hospitals and almost 1,000,000 hospital beds. Hospital facilities fall into four basic groups: community hospitals, federal government hospitals, nonfederal psychiatric hospitals, and nonfederal long-term care hospitals (Table 27-4). Currently, at least one-third of hospital beds, especially in city hospitals, are unoccupied. This current surplus of beds is caused in part by restrictions on length of hospital stays imposed by health insurance carriers. In 2006, the average hospital stay was 4.8 days, down from 5.7 days in 2001 (American Hospital Association, 2009).


Long-term care: Nursing homes and other health care facilities

The United States currently has approximately 15,500 state-certified nursing homes, with a capacity of more than 1.6 million beds (American Health Care Association, 2011). These institutions provide inpatient long-term care, particularly for the elderly, but also for the chronically disabled.

Although the American population is aging (see Chapter 4), the number of nursing home beds has been stable over the past 10 years; only about 5% of the elderly utilize such care during their last years. This small percentage is due, in part, to the high expense of long-term care (which is not funded by Medicare; see later text), In fact, most elderly
Americans spend the last years of their lives in their own residences; a smaller number spend their last years being cared for by family members.


table 27.3 LEADING CAUSES OF DEATH IN THE UNITED STATES, 2009


CAUSE OF DEATH


AGE-ADJUSTED DEATHS PER 100,000


Diseases of the heart


190.7


Cancer


177.5


Stroke and other cerebrovascular diseases


41.6


Chronic lung diseases


41.2


Accidents


37.8


Alzheimer’s disease


22.8


Diabetes


22.4


Influenza and pneumonia


16.3


Kidney disease


14.4


Blood infection


11.0


Suicide


10.8


Chronic liver disease and cirrhosis


8.9


High blood pressure


7.3


Parkinson’s disease


6.4


Homicide


5.8


Source: Centers for Disease Control and Prevention, National Vital Statistics System, 2009.


Long-term care facilities are classified by the level of care that they provide, which also determines their costs. Assisted living facilities provide limited care, such as meals, housekeeping, and some personal care, and they typically cost about $36,000 per year. Skilled nursing home care facilities provide professional nursing care and typically cost at least $75,000 per year.

Only gold members can continue reading. Log In or Register to continue

Stay updated, free articles. Join our Telegram channel

Jun 16, 2016 | Posted by in GENERAL & FAMILY MEDICINE | Comments Off on Systems of Health Care Delivery

Full access? Get Clinical Tree

Get Clinical Tree app for offline access