Special Diagnostic, Special Specimen Collection, and Postmortem Studies
OVERVIEW OF SPECIAL DIAGNOSTIC STUDIES
These special studies have been selected for discussion because of their great diagnostic value in identifying diseases and disorders of certain organs and systems. Tests after death serve to identify previously undiagnosed disease; evaluate accuracy of predeath diagnosis; provide information about sudden, suspicious, or unexplained deaths; assist in organ donation and postmortem legal investigations; and promote quality control in health care settings.
THE EYE
This procedure is used in conjunction with basic eye tests to evaluate and rule out glaucoma. The visual field exam may detect diseases that affect the eye, optic nerve, or brain. Small blind spots in the visual field begin to appear early in glaucoma.
Reference Values
Normal
Negative for blind spots
Procedure
Remember that the visual field test presents dimmer and dimmer targets of what the eye can see until they reach the limit.
Check one eye at a time.
Inform patient that procedure time is about 45 minutes for each eye.
Clinical Implications
Abnormal findings show the blind spots that appear in glaucoma.
Repeat testing for positive findings will show larger spots and progression of disease (Fig. 16.1).
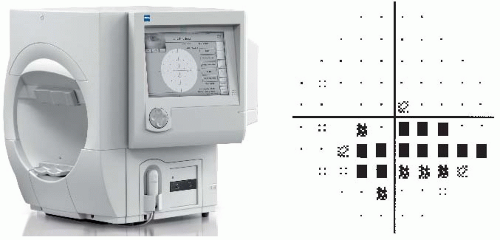 FIGURE 16.1. Humphrey Field Analyzer II-i and visual field grid. The darker the symbol (from a single dot to a black square), the less likely the field is normal in that location. (Courtesy of Humphrey Field Analyzer II-i User Manual, Carl Zeiss Meditec, Inc., Dublin, CA.) |
Interventions
Pretest Patient Care
Explain purpose and procedure for visual field testing.
Alert patient that no pain should be involved. The only discomfort is related to feeling sleepy, feeling like the patient is being hypnotized.
Be aware that elevated intraocular pressure, family history, age, and ethnicity are among the risk factors for developing glaucoma.
Follow guidelines in Chapter 1 for safe, effective, informed pretest care.
Posttest Patient Care
Interpret test outcomes (Fig. 16.2) and counsel appropriately, especially about need for further testing and possible treatment.
Follow guidelines in Chapter 1 for safe, effective, informed posttest care.
NOTE
For the previous section, information was produced by the Eye Clinic of Wisconsin. Laser Diagnostic Technologies of San Diego, California, supplied the technical information.
Retinal imaging (with the scanning laser ophthalmoscope [SLO]) is performed by an optometrist and is used to evaluate the back of the eye. The retina, or the inside layer at the back of the eye, is responsible for the majority of vision (Fig. 16.3).
Cause of vision changes and general health can be diagnosed by viewing the retina. SLO technology uses red and green lasers to detect eye disease and monitor treatment. Green laser (532 mm) scans the sensory retina through the pigment epithelium layers of the retina. Red laser (633 mm) scans the deeper structures of the retina, from the pigment epithelium deep into the choroid. Unlike conventional imaging, Optomap retinal images are made at varying depths, providing additional diagnostic information. This provides up to a 200-degree internal view of the retina and is captured within 0.25 seconds. Even though the patient may not be aware that vision is affected, signs of systemic disease such as diabetes, hypertension, and retinal disease, including macular degeneration, may be seen.
Reference Values
Normal
Retinal scan: healthy eye with no diseases noted
Procedure
Through digitally imaging the back of the eye, SLO technology uses different colored lasers to scan a picture of the retina onto a computer screen (Optomap). This exam allows for a more thorough exam of the retina than the routine ophthalmoscope exam.
This exam is recommended for all patients during routine eye exams to follow the health of the eyes more accurately.
The procedure time is approximately 25 minutes.
Clinical Implications
Abnormal results show evidence of bleeding in the eye associated with (most often) diabetes, hypertension, or macular degeneration.
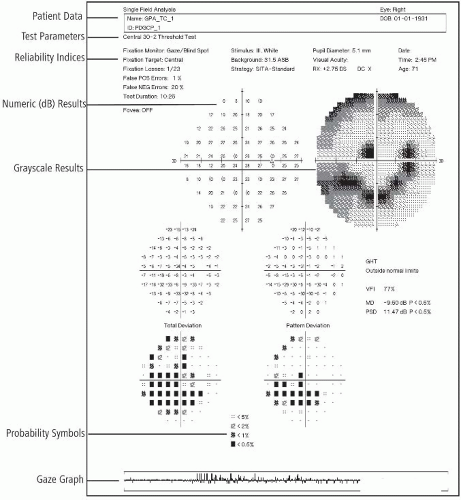 FIGURE 16.2. Patient report of a single visual field analysis of the right eye. The darker the symbol (from a single dot to a black square), the less likely the field is normal in that location. For example, P < 0.5% means that the deviation from normal at that location occurs in fewer than 0.5% of normal patients. (Courtesy of Humphrey Field Analyzer II-i User Manual, Carl Zeiss Meditec, Inc., Dublin, CA.) |
Interventions
Pretest Patient Care
Explain the purpose of the eye test and procedure.
Do not administer eyedrops for test.
If patient has contact lenses, these may be worn during the procedure.
Generally, there is minimal or no discomfort during the procedure. However, some individuals’ eyes may be sensitive to the flashing of light of the lasers.
Follow guidelines in Chapter 1 for safe, effective, informed pretest care.
Posttest Patient Care
Interpret test results. If bleeding or related problems that may require surgery are identified, the doctor may refer patient to another eye specialist.
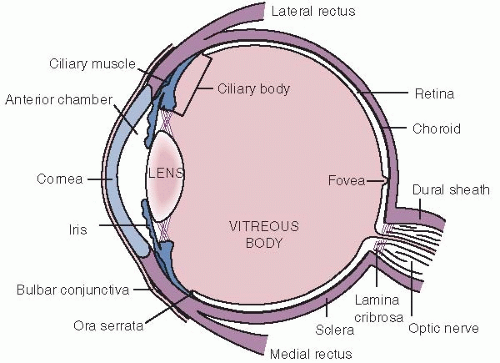
FIGURE 16.3. Diagram of the internal eye cut in a horizontal section. (From Stein HA, Slatt BJ, Stein RM: The Ophthalmic Assistant, 5th ed. St Louis, Mosby, 1988.)
Refer the patient to the appropriate medical specialist if problems related to medical diagnosis, such as bleeding in eye related to diabetes or hypertension, are identified.
Instruct the patient to return for follow-up a year later for repeat tests to evaluate disease progression.
Follow guidelines in Chapter 1 for safe, effective, informed posttest care.
This procedure evaluates glaucoma by use of microscopic laser technology to precisely measure the thickness of the retinal nerve fiber of the eye and is recorded in computerized data for analysis. It is this nerve layer that receives and transmits images and gives us vision.
Reference Values
Normal
No abnormalities of retinal nerve fiber
Normal thickness of retinal nerve layer
Procedure
Dilation of the eye is not necessary.
Have the patient sit upright in the examining chair.
Place the patient’s forehead and chin in cuplike holders and check one eye at a time. Twenty sectional images are obtained in less than 1 second and then analyzed to determine thickness of the nerve layer.
Clinical Implications
Abnormal appearance of the optic nerve is associated with changes in the eye that occur in glaucoma. Changes may be associated with vision loss.
Interventions
Pretest Patient Care
Explain test purpose and procedure. No pain or discomfort is associated with this test. There are no bright flashes of light.
Contact lenses may be left in place.
Follow guidelines in Chapter 1 for safe, effective, informed pretest care.
Posttest Patient Care
Evaluate outcomes, counsel appropriately, and explain if there is need for further testing and possible treatment of abnormal outcomes.
Follow guidelines in Chapter 1 for safe, effective, informed posttest care.
The purpose of this test is to detect vascular disorders of the retina that may be the cause of poor vision. Fluorescein, a yellow-red contrast substance, is injected intravenously over a 10- to 15-second period. Under ideal conditions, retinal capillaries 5 to 10 µm in diameter can be visualized using FA. Images of the eye, taken by a special camera, are studied to detect the presence of retinal disorders. Choroidal circulation is not seen with color photographs.
Reference Values
Normal
Normal retinal vessels, retina, and circulation
Procedure
Give a series of 3 drops to dilate the pupil of the eye. Complete dilation occurs within 30 minutes of giving the last drop.
When dilation is complete, take a series of color photographs of both eyes.
Have the patient sit with the head immobilized in a special headrest in front of a fundus camera.
Inject fluorescein dye intravenously.
Take a series of photographs as the dye flows through the retinal blood vessels over a period of 3 to 4 minutes.
Take a final series of photographs 8 to 10 minutes after the injection.
 PROCEDURAL ALERT
Some patients may experience nausea for a short period of time following the injection.
The eyedrops may sting or cause a burning sensation.
Clinical Implications
Abnormal results reveal:
Diabetic retinopathy
Aneurysm
Macular degeneration
Diabetic neovascularization
Blocked blood vessels
Leakage of fluid from vessels
Interventions
Pretest Patient Care
Determine whether the patient has any known allergies to medications or contrast agent.
Instruct patient about the purpose, procedure, and side effects of the test.
Follow guidelines in Chapter 1 for safe, effective, informed pretest care.
Posttest Patient Care
Inform the patient that he or she may experience color changes in the skin (yellowish) and urine (bright yellow or green) for 36 to 48 hours after the test.
Advise the patient to wear dark glasses and not to drive while the pupils remain dilated (4 to 8 hours). During this time, patients are unable to focus on nearby objects and react abnormally to changes in light intensity.
Interpret test results and monitor appropriately.
Follow guidelines in Chapter 1 for safe, effective, informed posttest care.
This test of retinal function is used in the study of suspected hereditary and acquired degeneration of the retina. As a measurement of retinal function, electro-oculography (EOG) serves primarily to complement electroretinography (ERG) by determining the functional state of retinal pigment epithelium, as in retinitis pigmentosa. EOG determines the electrical potential of the eye at rest in both darkness and light. Normally, the potential difference between the front and back of the eye should increase as light intensity increases.
Reference Values
Normal
>1.85 ratio (Arden ratio: maximum height of the retinal potential in light divided by the minimum height of the potential in the dark)
Procedure
Have the patient sit in the examining chair.
Place skin surface electrodes in the inner and outer canthi of the eye. The electrical potentials are recorded on a polygraph unit.
Make two recordings:
Make recordings after 15 minutes with the patient in total darkness with measurement of eye movement through a known angle.
Ask the patient to again move the eyes through the same angle, this time with the integrating sphere lighted.
Tell patient that total examination time is 40 to 45 minutes.
 PROCEDURAL ALERT
If FA and EOG are both ordered, the EOG must be done first because the eye is dilated for the FA test but not for the EOG test. However, when an ERG and an FA are performed on the same day, the FA should be done first to avoid corneal edema caused by the corneal electrode used in the ERG procedure. The waiting time between FA and ERG should be at least 2 hours.
Clinical Implications
An Arden ratio of 1.60 to 1.84 is probably abnormal; a ratio of 1.20 to 1.59 is definitely abnormal; whereas a ratio < 1.20 is flat. The outcome is usually reported as normal or abnormal.
The EOG ratio decreases in most retinal degeneration, such as retinal pigmentosa; this sometimes parallels the decrease on the ERG examination.
In Best’s disease (congenital macular degeneration), the EOG is abnormal; however, the ERG is normal.
In retinopathy due to toxins such as antimalarial drugs, the EOG may show abnormalities earlier than the ERG.
Supernormal EOGs have been noted in albinism and aniridia (loss of all or part of iris), in which the common factor seems to be chronic excessive light exposure resulting in retinal damage.
Interventions
Pretest Patient Care
Explain the purpose and procedure of the test. For the most part, the patient will experience little to no discomfort.
Follow guidelines in Chapter 1 for safe, effective, informed pretest care.
Posttest Patient Care
Interpret test results and monitor appropriately.
Follow guidelines in Chapter 1 for safe, effective, informed posttest care.
The electroretinography (ERG) is used to study hereditary and acquired disorders of the retina, including partial and total color blindness (achromatopia), night blindness, retinal degeneration, and detachment of the retina in cases in which the ophthalmoscopic view of the retina is prohibited by some opacity, such as vitreous hemorrhage, cataracts, or corneal opacity. When these disorders exclusively involve either the rod system or the cone system to a significant degree, the ERG shows corresponding abnormalities.
In this test, an electrode is placed on the eye to obtain the electrical response to light. When the eye is stimulated with a flash of light, the electrode will record potential (electric) change that can be displayed and recorded on an oscilloscope. The ERG is indicated when surgery is considered in cases of questionable retinal viability.
Reference Values
Normal
Normal A and B waves
NOTE
“A” waves are produced by photoreceptor cells and “B” waves by Müller radial cells.
Procedure
Have patient hold eyes open during the procedure.
The patient may be sitting up or lying down.
Instill topical anesthetic eyedrops.
Place bipolar cotton wick electrodes, saturated with normal saline, on the cornea.
Use two states of light adaptation to detect rod and cone disorders along with different wavelengths of light to separate rod and cone function. Normally, the more intense the light, the greater the electrical response.
Room (ambient) light
Room darkened for 20 minutes, then a white light is flashed
Bright flash (In cases of trauma, when there is vitreous hemorrhage, a much more intense flash of light must be used.)
Use chloral hydrate or a general anesthesia for infants and small children who are being tested for a congenital abnormality.
Total examining time is about 1 hour.
Clinical Implications
Changes in the ERG are associated with:
Diminished response in ischemic vascular diseases, such as arteriosclerosis and giant cell arteritis
Siderosis (poisoning of the retina when copper is embedded intraocularly [this is not associated with stainless steel foreign bodies])
Drugs that produce retinal damage, such as chloroquine and quinine
Retinal detachment
Opacities of ocular media
Decreased response, such as in vitamin A deficiency or mucopolysaccharidosis
Diseases of the macula do not affect the standard ERG. Macular disorder can be detected using a focal ERG.
Interventions
Pretest Patient Care
Explain the purpose and procedure of the test. For the most part, the patient will experience little or no discomfort. The electrode may feel like an eyelash in the eye.
Follow guidelines in Chapter 1 for safe, effective, informed pretest care.
Posttest Patient Care
Interpret test results and monitor appropriately.
Follow guidelines in Chapter 1 for safe, effective, informed posttest care.
Caution the patient not to rub the eyes for at least 1 hour after testing to prevent accidental corneal abrasion.
Ultrasound can be used to describe both normal and abnormal tissues of the eyes when no alternative visualization is possible because of opacities caused by inflammation, hemorrhage, or dense cataracts. This information is valuable in the management of eyes with large corneal leukomas or conjunctival flaps and in the evaluation of the eyes for keratoprosthesis. Orbital lesions can be detected and distinguished from inflammatory and congestive causes of exophthalmus with a high degree of reliability. An extensive preoperative evaluation before vitrectomy or surgery for vitreous hemorrhages is also done. In this case, the vitreous cavity is examined to rule out retinal and choroidal detachments and to detect and localize vitreoretinal adhesions, choroidal lesions, and intraocular foreign bodies. It can also be used to detect optic nerve drusen. Persons who are to have intraocular lens implants after removal of cataracts must be measured for the length of the eye (within 0.1 mm).
Reference Values
Normal
Normal image pattern indicating normal soft tissue of eye, retrobulbar orbital areas, retina, choroid, and orbital fat
Procedure
Anesthetize the eye area by instilling eyedrops.
Ask the patient to fix the gaze and hold very still. If imaging a lesion, movement is required for a retinal detachment evaluation.
Place a small, very-high-frequency transducer directly on the eye or position over a water standoff pad placed onto the eye surface.
Take multiple images.
If a lesion in the eye is detected, as much as 30 minutes may be required to differentiate the pathologic process accurately.
Orbital examination can be done in 8 to 10 minutes.
See Chapter 1 guidelines for intratest care.
 PROCEDURAL ALERT
When a ruptured globe is suspected or surgery has been performed, ophthalmic ultrasound can be performed over a closed eyelid.
Caution must be used to avoid excessive pressure applied to the globe causing expulsion of the contents and increased risk for introduction of bacteria.
Clinical Implications
Abnormal patterns are seen in:
Alkali burns with corneal flattening and loss of anterior chamber
Detached retina
Keratoprosthesis
Extraocular thickening in thyroid eye disease
Pupillary membranes
Cyclotic membranes
Vitreous opacities
Orbital mass lesions
Inflammatory conditions
Vascular malformations
Foreign bodies
Hypotony
Optic nerve drusen
Congenital cataract
Posterior vitreous detachment
Retinoschisis
Choroidal hemorrhage or detachment
Trauma
Abnormal patterns are also seen in tumors of various types based on specific ultrasonic patterns:
Solid tumors (e.g., meningioma, glioma, neurofibroma)
Cystic tumors (e.g., mucocele, dermoid, cavernous hemangioma)
Angiomatous tumors (e.g., diffuse hemangioma)
Lymphangioma
Infiltrative tumors (e.g., metastatic lymphoma, pseudotumor)
Interfering Factors
If, at some time, the vitreous humor in a particular patient was replaced by gas or silicone oil, no result may be obtained.
Interventions
Pretest Patient Care
Explain the purpose and procedure of the test. For the most part, the patient will experience little to no discomfort.
See Chapter 1 guidelines for safe, effective, informed pretest care.
Posttest Patient Care
Interpret test results and monitor appropriately.
Caution the patient not to rub the eyes until the effects of the anesthesia have disappeared to prevent accidental corneal abrasion. Minor blurred vision may be experienced for a short time.
Follow guidelines in Chapter 1 for safe, effective, informed posttest care.
BRAIN AND NERVOUS SYSTEM
The EEG measures and records electrical impulses from the brain cortex. It is used to investigate causes of seizures, to diagnose epilepsy, and to evaluate brain tumors, brain abscesses, subdural hematomas, cerebral infarcts, and intracranial hemorrhages, among other conditions. It can be a tool for diagnosing narcolepsy, Parkinson’s disease, Alzheimer’s disease, and certain psychoses. It is common practice to consider the EEG pattern, along with other clinical procedures, drug levels, body temperature, and thorough neurologic examinations, to establish electrocerebral silence, otherwise known as “brain death.” The American Electroneurodiagnostic Society sets guidelines for obtaining these recordings. When an electrocerebral silence pattern is recorded in the absence of any hope for neurologic recovery, the patient may be declared brain dead despite cardiovascular and respiratory support.
Epilepsy/seizure monitoring using simultaneous video and EEG recordings (online computer) is done to verify a diagnosis of epilepsy, when seizures begin, and how they appear. The results differentiate and define seizure type, localize region of seizure onset, quantify seizure frequency, and identify candidates for medical implantation of vagus nerve stimulator or surgical treatment of seizures. Hospital admission is required.
Reference Values
Normal
Normal, symmetric patterns of electrical brain activity
Range of alpha: 8-11 Hertz (cycles per second)
Seizure monitoring: expected outcome of at least three typical recorded seizures that may be different from what the patient usually experiences because medications have been reduced; also, onset area and type of seizures
No cross-circulation of internal carotid arteries
Evidence of hemispheres to support language and memory
Procedure for EEG
Scalp hair should be recently washed.
Fasten electrodes containing conduction gel to the scalp with a special skin glue or paste. Seventeen to 21 electrodes are used according to an internationally accepted measurement known as the 10-20 System. This system correlates electrode placement with anatomic brain structure.
Place the patient in a recumbent position, instruct to keep the eyes closed, and encourage patient to sleep during the test (resting EEG). (Seizure activating procedure [see numbers 4 to 6]).
Before beginning the EEG, some patients may be instructed to breathe deeply through the mouth 20 times per minute for 3 minutes. This hyperventilation may cause dizziness or numbness in the
hands or feet but is nothing to be alarmed about. This activating breathing procedure induces alkalosis, which causes vasoconstriction, which in turn may activate a seizure pattern.
Place a light flashing at frequencies of 1 to 30 times per second close to the face. This technique, called photic stimulation, may cause an abnormal EEG pattern not normally recorded.
Be aware that certain persons may be intentionally sleep deprived before the test to promote sleep during the test. Administer an oral medication to promote sleep (e.g., Valium chloral hydrate). The sleep state is valuable for revealing abnormalities, especially different forms of epilepsy. Make recordings while the patient is falling asleep, during sleep, and while the patient is waking.
Remove electrodes, glue, and paste after the EEG. The patient may then wash the hair.
Follow guidelines in Chapter 1 for safe, effective, informed intratest care.
Procedure for Seizure Monitoring
Apply electrodes, take EEG, and explain video and EEG monitoring (for up to 6 days). An electrode panel is applied and must be covered when patient eats. Patient remains in bed except to use the bathroom; a helmet is worn when out of bed.
Perform neuropsychological testing to evaluate memory (remember objects), language (circles, squares), and problem solving (4 to 6 hours of testing).
A cerebral angiogram to assess cross-circulation in carotids is followed by a Wada test to determine the dominant hemisphere for language and whether opposite hemisphere can support memory. An intravenous line is started and a catheter is threaded through the femoral artery to the internal carotid to inject sodium amobarbital to “put the brain to sleep” for 5 minutes in each half of the brain. The Wada test is also known as the amobarbital study or intracarotid amytal test or the Brevital (when sodium methohexital is used) test.
Perform a functional brain magnetic resonance imaging (MRI) study. Procedure time is about 90 minutes. Patient wears earphones and is asked to respond to questions, sounds, and pictures by pressing a special button.
A combined positron emission tomography/computed tomography (PET/CT) scan is often done to provide further information about brain hemispheres.
Clinical Implications
Abnormal EEG pattern readings reveal seizure activity (e.g., grand mal epilepsy, petit mal epilepsy) if recorded during a seizure. If a patient suspected of having epilepsy shows a normal EEG, the test may have to be repeated using sleep deprivation or special electrodes. The EEG may also be abnormal during other types of seizure activity (e.g., focal [psychomotor], infantile myoclonic, or jacksonian seizures); between seizures, 20% of patients with petit mal epilepsy and 40% with grand mal epilepsy show a normal EEG pattern, and the diagnosis of epilepsy can be made only by correlating the clinical history with the EEG abnormality, if one exists.
An EEG may often be normal in the presence of cerebral pathology. However, most brain abscesses and glioblastomas produce EEG abnormalities.
Electroencephalographic changes due to cerebrovascular accidents depend on the size and location of the infarcts or hemorrhages.
Following a head injury, a series of EEGs may be helpful in predicting the likelihood of posttraumatic epilepsy, especially if a previous EEG is available for comparison.
In cases of dementia, the EEG may be normal or abnormal.
In early stages of metabolic disease, the EEG is normal; in the later stages, it is abnormal.
The EEG is abnormal in most diseases or injuries that alter the level of consciousness. The more profound the change in consciousness, the more abnormal the EEG pattern.
Abnormal procedure results (e.g., identification of major connections between the anterior and posterior circulation, or abnormal connection between the internal carotid arteries, or isolation of seizure onset and number and types of seizures)
Interfering Factors
Sedative drugs, mild hypoglycemia, or stimulants can alter normal EEG tracings.
Oily hair, hair spray, and other hair care products interfere with the placement of EEG patches and the procurement of accurate EEG tracings.
Artifacts can appear in technically well-performed EEGs. Eye and body movements cause changes in brain wave patterns and must be noted so that they are not interpreted as abnormal brain waves.
Interventions
Pretest Patient Care
Explain test purpose and procedure to allay patient fears and concerns. Emphasize that the EEG is not painful, that it is not a test of thinking or intelligence, that no electrical impulses pass through the body, and that it is not a form of shock therapy. The transmitted impulses are magnified at least 1 million times and transcribed to permanent hard copy for further study.
Explain seizure monitoring procedures, purposes, and risks. Risks of angiogram and Wada test include allergy to sodium amobarbital, cross-circulation leading to respiratory arrest, and stroke related to allergy to contrast agent used in angiogram.
Allow food if the patient is to be sleep deprived. However, no coffee, tea, or cola is permitted within 12 hours of the test. Emphasize that food should be eaten to prevent hypoglycemia.
Allow, but do not encourage, smoking before the test.
Have patient wash and thoroughly rinse hair with clear water the evening before the EEG so that the EEG patches remain firmly in place during the test. Tell patient to not apply conditioners or oils after shampooing.
If a sleep study is ordered, the adult patient should sleep as little as possible the night before (i.e., stay up past midnight) so that sleep can occur during the test.
Call the EEG department for special instructions if a sleep deprivation study is ordered for a child.
Medications are generally reduced before the Wada test. A liquid breakfast is permitted.
EEG and video monitoring of seizures occur for up to 6 days, with medications gradually reduced by one-third for 3 days.
Follow guidelines in Chapter 1 regarding safe, effective, informed pretest care.
Posttest Patient Care
Wash the hair after the test. Application of oil to the adhesive before shampooing can ease its removal.
Allow the patient to rest after the test if a sedative was given during the test. Put bedside rails in the raised position for safety. Resume medications (if reduced preprocedure).
Skin irritation from the electrodes usually disappears within a few hours.
Interpret test results and monitor appropriately. If a repeat testing is necessary, provide explanations and support to the patient. Explain possible treatment of uncontrolled seizures (e.g., newer antiseizure medications, surgical implantation of vagus nerve stimulator). Explain role of female hormones in epilepsy: seizures may be worsened by hormones; adult epilepsy involves areas of the brain sensitive to reproductive hormones; and, at menopause, seizures tend to increase, worsen, or lessen.
Follow guidelines in Chapter 1 for safe, effective, informed posttest care.
These tests use conventional EEG recording techniques with specific electrode site placement for each procedure and include computer data processing to evaluate electrophysiologic integrity of the auditory, visual, and sensory pathways. These are brain responses “time-locked” to some event. See Chart 16.1 for wave and standard deviation (SD) measurements.
CHART 16.1 Wave and Standard Deviation Measurements for Evoked Response/Potential
Normal Potentials, Brainstem Auditory Evoked Response (BAER), and Visual Evoked Response (VER)
Absolute latency, measured in milliseconds (msec), of the first five waveforms at a sound stimulation rate of 11 clicks/second
Wave | Mean ± Standard Deviation (SD) |
I | 1.7 ± 0.15 |
II | 2.8 ± 0.17 |
III | 3.9 ± 0.19 |
IV | 5.1 ± 0.24 |
V | 5.7 ± 0.25 |
Normal Visual Evoked Response (VER)
Absolute latency, measured in milliseconds of the first major positive peak (P100)
Wave | Mean ± SD | Range |
P100 | 102.3 ± 5.1 | 89-114 |
Normal Somatosensory Evoked Response (SSER)
Absolute latency of major waveforms, measured in milliseconds at a stimulation rate of 5 impulses/second
Wave | Mean ± SD |
EP | 9.7 ± 0.7 |
A | 11.8 ± 0.7 |
B | 13.7 ± 0.8 |
II | 11.3 ± 0.8 |
III | 13.9 ± 0.9 |
N2 | 19.1 ± 0.8 |
P2 | 22.0 ± 1.2 |
Brainstem auditory evoked response. This study allows evaluation of suspected peripheral hearing loss, cerebellopontine angle lesions, brainstem tumors, infarcts, multiple sclerosis, and comatose states. Special stimulating techniques permit recording of signals generated by subcortical structures in the auditory pathway. Stimulation of either ear evokes potentials that can reveal lesions in the brainstem involving the auditory pathway without affecting hearing. Evoked potentials of this type are also used to evaluate hearing in newborns, infants, children, and adults through electrical response audiometry.
Visual evoked response. This test of visual pathway function is valuable for diagnosing lesions involving the optic nerves and optic tracts, multiple sclerosis, and other disorders. Visual stimulation excites retinal pathways and initiates impulses that are conducted through the central visual path to the primary visual cortex. Fibers from this area project to the secondary visual cortical areas on the brain’s occipital convexity. Through this path, a visual stimulus to the eyes causes an electrical response in the occipital regions, which can be recorded with electrodes placed along the vertex and the occipital lobes. It is also used to assess development of blue-yellow pathway in infants.
Somatosensory evoked response. This test assesses spinal cord lesions, stroke, and numbness and weakness of the extremities. It studies impulse conduction through the somatosensory pathway. Electrical stimuli are applied to the median nerve in the wrist or peroneal nerve near the knee at a level near that which produces thumb or foot twitches. The milliseconds it takes for the current to travel along the nerve to the cortex of the brain is then measured. Somatosensory evoked responses can also be used to monitor sensory pathway conduction during surgery for scoliosis or spinal cord decompression and/or ischemia. Loss of the sensory potential can signal impending cord damage.
Procedures
Obtain brainstem auditory evoked responses through electrodes placed on the vertex of the scalp and on each earlobe. Stimuli in the form of clicking noises or tone bursts are delivered to one ear through earphones. Because sound waves delivered to one ear can be heard by the opposite ear, a continuous masking noise is simultaneously delivered to the opposite ear.
Place electrodes used in visually evoked response on the scalp along the vertex and occipital lobes. Ask the patient to watch a checkerboard pattern flash for several minutes, first with one eye, then with the other, while brain waves are recorded.
Record somatosensory evoked responses through several pairs of electrodes. Apply electrical stimuli to the median nerve at the wrist or to the peroneal nerve at the knee. Scalp electrodes placed over the sensory cortex of the opposite hemisphere of the brain pick up the signals and measure, in milliseconds, the time it takes for the current to travel along the nerve to the cortex of the brain.
Follow guidelines in Chapter 1 for safe, effective, informed intratest care.
Clinical Implications
Abnormal BAERs are associated with the following conditions:
Acoustic neuroma
Cerebrovascular accidents
Multiple sclerosis
Lesions affecting any part of the auditory nerve or brainstem area
Abnormal VERs are associated with the following conditions:
Demyelinating disorders such as multiple sclerosis
Lesions of the optic nerves and eye (prechiasmal defects)
Lesions of the optic tract and visual cortex (postchiasmal defects)
Abnormal visual evoked potentials may also be found in persons without a history of retrobulbar neuritis, optic atrophy, or visual field defects. However, many patients with proven damage to the postchiasmal visual path and known visual field defects may have normal visual evoked potentials.
Abnormal SSERs are associated with the following conditions:
Spinal cord lesions
Cerebrovascular accidents
Multiple sclerosis
Cervical myelopathy accident
Interfering Factors
Some difficulty in interpreting brainstem evoked potentials may arise in persons with peripheral hearing defects that alter evoked potential results (i.e., subthreshold stimulation of peripheral nerves and inadequate skin preparation).
Maximum depolarization stimulation is divided into two protocols:
Brachial plexus (BP) protocol involves stimulation of the median, ulnar, and superficial sensory radial nerves just proximal to the wrist.
Lumbosacral (LS) protocol involves stimulating the posterior tibial and common peroneal nerves, which are the primary divisions of the lumbosacral plexus forming the sciatic nerve.
Interventions
Pretest Patient Care
Explain the test purpose and procedure.
Have patient wash and rinse hair before testing. Instruct patient not to apply any other hair preparations.
Follow guidelines in Chapter 1 for safe, effective, informed pretest care.
Posttest Patient Care
Allow patient to wash hair (assist if necessary). Remove gel from other skin areas.
Interpret test results and monitor appropriately for neurologic problems.
Follow guidelines in Chapter 1 for safe, effective, informed posttest care.
Event-related potentials are used as objective measures of mental function in neurologic diseases that produce cognitive defects. These measurements use the method of auditory evoked response testing in which sound stimuli are transmitted through earphones. A rare tone is associated with a prominent endogenous P3 component that reflects the differential cognitive processing of that tone. Although a systematic neurologic increase in P3 component latency occurs as a function of increasing age in normal persons, in many instances of neurologic diseases associated with dementia, the latency of the P3 component has been reported to exceed substantially the normal age-matched value.
This test is useful in evaluating persons with dementia or decreased mental functioning. It is also helpful in differentiating persons with real organic brain defects affecting cognitive function from those who are unable to interact with the examiner because of motor or language defects or those unwilling to cooperate because of problems such as depression or schizophrenia.
Reference Values
Normal
No shift of P3 components to longer latencies
ERP: absolute latency of P3 waveform
P3 wave mean and SD 294 ± 21 milliseconds
Procedure
This procedure is the same as that for auditory brainstem response.
Ask patients to count the occurrences of audible rare tones they hear through the earphones.
Follow guidelines in Chapter 1 for safe, effective, informed intratest care.
Clinical Implications
An increased or abnormal P3 latency is associated with neurologic diseases producing dementia, such as the following:
Alzheimer’s disease
Metabolic encephalopathy such as that associated with hypothyroidism or alcoholism with severe electrolyte disturbances
Brain tumor
Hydrocephalus
Interfering Factors
Latency of P3 component normally increases with age.
Interventions
Pretest Patient Care
Explain the purpose and procedure of the test.
Follow guidelines in Chapter 1 regarding safe, effective, informed pretest care.
Posttest Patient Care
Interpret test results and monitor appropriately for neurologic disease.
Follow guidelines in Chapter 1 for safe, effective, informed posttest care.
Brain mapping uses transitional EEG data and specialized computer digitization to display the diagnostic information as a topographic map of the brain and spinal cord. The computer analyzes EEG signals for amplitude and distribution of alpha, beta, theta, and delta frequencies and displays the analysis as a color map. Specific or minute abnormalities are enhanced and allow comparison with normal data. This methodology is used for assessing cognitive function and for evaluating patients with migraine headaches, trauma, or episodes of vertigo or dizziness. Persons who lose periods of time and select patients with generalized seizures, dementia of organic origin, ischemic abnormalities, or certain psychiatric disorders are also candidates for this testing. With this procedure, it is possible to localize a specific area of the brain that may otherwise show up as a generalized area of deficit in the conventional EEG. Children or adults who demonstrate hyperactivity, dyslexia, dementia, or Alzheimer’s disease may benefit from evaluation through brain mapping.
Reference Values
Normal
Normal frequency signals and evoked responses presented as a color-coded map of electrical brain activity
Procedure
Ensure that the patient is rested and awake for the test so that no sleep signals appear as indicators of beta wave activity.
After the skin of the scalp is cleansed with an abrasive solution, place 42 electrodes at designated areas on the scalp and hold in place with adhesive or paste formulated for this purpose.
Place the patient in a recumbent position and instruct him or her to keep the eyes closed and to refrain from any movement.
Follow guidelines in Chapter 1 for safe, effective, informed intratest care.
Clinical Implications
Abnormal brain maps can pinpoint the following conditions:
Areas of focal seizure discharge in persons who experience generalized seizures
Areas of focal irritation in persons with migraine
Areas of ischemia
Areas of dysfunction in states of dementia
Areas of possible brain abnormalities associated with schizophrenia or other psychotic states
Interfering Factors
Tranquilizers may alter results.
Unwashed hair or the use of hair preparations can interfere with electrode placement.
Eye and body movements cause changes in signals and wave patterns.
Interventions
Pretest Patient Care
Explain the test purpose and procedure. There are no known risks. Emphasize the fact that electrical impulses pass from the patient to the machine and not the opposite.
Tell patient that food and fluids can be taken before testing. However, no coffee, tea, or caffeinated drinks should be ingested for at least 8 hours before test.
Ensure that hair has been recently washed.
Ensure that tranquilizers are not taken before testing (check with physician). Other prescribed medications such as antihypertensives and insulin may be taken. If in doubt, contact the testing laboratory for guidelines.
Follow guidelines in Chapter 1 for safe, effective, informed pretest care.
Posttest Patient Care
Remove the conduction gel and encourage the patient to wash his or her hair. Provide supplies if possible.
Interpret test results and monitor appropriately for seizure activity and other neurologic manifestations.
Follow guidelines in Chapter 1 for safe, effective, informed posttest care.
Electromyoneurography combines electromyography and electroneurography. These studies, done to detect neuromuscular abnormalities, measure nerve conduction and electrical properties of skeletal muscles. Together with evaluation of range of motion, motor power, sensory defects, and reflexes, these tests can differentiate between neuropathy and myopathy. The electromyogram can define the site and cause of muscle disorders such as myasthenia gravis, muscular dystrophy, and myotonia; inflammatory muscle disorders such as polymyositis; and lesions that involve the motor neurons in the anterior horn of the spinal cord. EMG can also localize the site of peripheral nerve disorders such as radiculopathy and axonopathy. Skin and needle electrodes measure and record electrical activity. Electrical sound equivalents are amplified and recorded on tape for later studies.
Reference Values
Normal
Normal EMG and EMNG
Procedure
The test is done in a copper-lined room to screen out outside interference.
Remember that the patient may lie down or sit during the test.
Apply a surface disk or lead strap to the skin around the wrist or ankle to ground the patient. Choose the muscles and nerves examined according to the patient’s signs and symptoms, history, and physical condition (select nerves innervate specific muscles).
Encourage the patient to relax (massage certain muscles to get the patient to relax) or to contract certain muscles (e.g., to point to toes) at specific times during the test.
Testing is divided into two parts.
The first test determines nerve conduction.
Coat metal surface electrodes with electrode paste and firmly place over a specific nerve area. Pass electrical current (maximum, 100 mAmp for 1 msec) through the area to cause sensations, similar to shock from carpeting or static electricity or the equivalent of an AA battery, that are directly proportional to the time the current is applied. Patients with mild forms of neuromuscular disorders may feel mild discomfort, whereas those with polyneuropathies may experience moderate discomfort.
Read the amplitude wave on an oscilloscope and record on magnetic tape for later studies.
Electrical current leaves no mark but can cause unusual sensations that are not usually considered unpleasant. How fast and how well a nerve transmits messages can be measured. Nerves in the face, arms, or legs are appropriate for testing in this way.
The second test determines muscle potential.
Insert a monopolar electrode (a 1.25- to 7.5-cm long small-gauge needle) and incrementally advance into the muscle. Manipulate the needle without actually removing it to see if readings change, or place the needle in another muscle area.
The electrode usually causes no pain unless the tip is near a terminal nerve. Ten or more needle insertions may be necessary. The needle electrode detects electricity normally present in muscle.
Observe the oscilloscope for normal wave forms and listen for normal quiet sounds at rest. A “machine-gun popping” sound or a rattling sound like hail on a tin roof is normally heard when the patient contracts the muscle.
If the patient complains of pain, remove the needle because the pain stimulus yields false results.
Total examining time is 45 to 60 minutes if testing is confined to a single extremity; testing may take up to 3 hours for more than one extremity. There is no completely “routine” EMG. The length of the test depends on the clinical problem.
Follow guidelines in Chapter 1 regarding safe, effective, informed intratest care.
 PROCEDURAL ALERT
Enzyme levels that reflect muscle activity (e.g., aspartate aminotransferase, lactate dehydrogenase, creatine phosphokinase) must be determined before actual testing because the EMG causes elevation of these enzymes for up to 10 days postprocedure.
Although rare, hematomas may form at needle insertion sites. Take measures, such as application of pressure to the site, to control bleeding. Notify the physician. Ascertain whether the patient is taking anticoagulants or aspirin-like drugs.
Clinical Implications
Abnormal neuromuscular activity occurs in diseases or disturbances of striated muscle fibers or membranes in the following conditions:
Muscle fiber disorders (e.g., muscular dystrophy)
Cell membrane hyperirritability; myotonia and myotonic disorders (e.g., polymyositis, hypocalcemia, thyrotoxicosis, tetanus, rabies)
Myasthenia (muscle weakness states) caused by the following conditions:
Myasthenia gravis
Cancer due to nonpituitary adrenocorticotropic hormone (ACTH) secretion by the tumor
Bronchial cancer
Sarcoid
Deficiencies
Familial hypokalemia
McArdle’s phosphorylase
Hyperadrenocorticism
Acetylcholine-blocking agents
Curare
Botulin
Kanamycin
Snake venom
Disorders or diseases of lower motor neurons
Lesions involving motor neuron on anterior horn of spinal cord (myelopathy)
Tumor
Trauma
Syringomyelia
Juvenile muscular dystrophy
Congenital amyotonia
Anterior poliomyelitis
Amyotrophic lateral sclerosis
Peroneal muscular atrophy
Lesions involving the nerve root (radiculopathy)
Guillain-Barré syndrome
Entrapment of the nerve root
Tumor
Trauma
Herniated disk
Hypertrophic spurs
Spinal stenosis
Damage to or disease of peripheral or axial nerves
Entrapment of the nerve
Carpal or tarsal tunnel syndrome
Facial, ulnar, radial, or peroneal palsy
Neuralgia paresthetica
Endocrine
Hypothyroidism
Diabetes
Toxic
Heavy metals
Solvents
Antiamebicides
Chemotherapy
Antibiotics
Early peripheral nerve degeneration and regeneration
Interfering Factors
Conduction can vary with age and normally decreases with increasing age.
Pain can yield false results.
Electrical activity from extraneous persons and objects can produce false results as a result of movement.
The test is ineffective in the presence of edema, hemorrhage, or thick subcutaneous fat.
Interventions
Pretest Patient Care
Explain the test purpose and procedure. There is a risk for hematoma if the patient is on anticoagulant therapy.
Sedation or analgesia may be ordered.
Follow guidelines in Chapter 1 for safe, effective, informed pretest care.
Posttest Patient Care
If the patient experiences pain, provide pain relief through appropriate interventions. Obtain an order for an analgesic if necessary.
Promote rest and relaxation.
Interpret test results and monitor appropriately for nerve and muscle disease. Provide assistance as necessary.
Follow guidelines in Chapter 1 for safe, effective, informed posttest care.
This study aids in the differential diagnosis of lesions in the brainstem and cerebellum. It can confirm the causes of unilateral hearing loss of unknown origin, vertigo, or ringing in the ears. Evaluation of the vestibular system and the muscles controlling eye movement is based on measurements of the nystagmus cycle. In health, the vestibular system maintains visual fixation during head movements by means of nystagmus, the involuntary back-and-forth eye movement caused by initiation of the vestibular-ocular reflex.
Reference Values
Normal
Vestibular-ocular reflex: Normal nystagmus accompanying head turning is expected.
Procedure
The test is usually done in a darkened room with the patient sitting or lying.
Remove any earwax before testing.
Tape five electrodes at designated positions around the eye.
During the study, ask the patient to look at different objects, to open and close his or her eyes, and to change head position.
Toward the end of the test, gently blow air into each external ear canal, first on the affected side. Instill cold water, then warm water, into the ears during the test to record eye movement in response to various stimuli.
Follow guidelines in Chapter 1 for safe, effective, informed intratest care.
 PROCEDURAL ALERT
Water irrigation of the ear canal should not be done when there is a perforated eardrum. Instead, a finger cot may be inserted into the ear canal to protect the middle ear.
Clinical Implications
Prolonged nystagmus and postural instability following a head turn is abnormal and can be caused by lesions of the vestibular or ocular system, as in the following conditions:
Cerebellar disease
Brainstem lesion
Peripheral lesion occurring in elderly person; head trauma; middle ear disorders
Congenital disorders
Ménière’s disease
Interfering Factors
Test results are altered by the inability of the patient to cooperate, poor eyesight, blinking of the eyes, or poorly applied electrodes.
The patient’s anxiety or medications such as central nervous system depressants, stimulants, or antivertigo agents can cause false-positive test results.
Interventions
Pretest Patient Care
Explain the test purpose and procedure. No pain or known risks are associated with the test. The procedures to stimulate involuntary rapid eye movement are uncomfortable.
Have the patient remove makeup.
Have the patient abstain from all caffeinated and alcoholic beverages for at least 48 hours. Heavy meals should be avoided before testing.
In most cases, medications such as tranquilizers, stimulants, or antivertigo agents should be withheld for 5 days before the test. If in doubt, consult the clinician who ordered the test.
Follow guidelines in Chapter 1 for safe, effective, informed pretest care.
The test is contraindicated in persons who have pacemakers.
Posttest Patient Care
Allow the patient to rest as necessary.
If present, nausea, vertigo, and weakness may require treatment and medication. Check with the clinician who ordered the test.
Interpret test results and monitor appropriately for brain disease, which may manifest as loss of balance, or middle ear disease, which may cause spasmodic eye movement, vertigo, or hearing loss.
Follow guidelines in Chapter 1 for safe, effective, informed posttest care.
HEART
An ECG records the electrical impulses that stimulate the heart to contract. It also records dysfunctions that influence the conduction ability of the myocardium. The ECG is helpful in diagnosing and monitoring the origins of pathologic rhythms; myocardial ischemia; myocardial infarction; atrial and ventricular hypertrophy; atrial, atrioventricular, and ventricular conduction delays; and pericarditis. It can be helpful in diagnosing systemic diseases that affect the heart, determining cardiac drug effects (especially digitalis and antiarrhythmic agents), evaluating disturbances in electrolyte balance (especially potassium and calcium), and analyzing cardiac pacemaker or implanted defibrillator functions.
An ECG provides a continuous picture of electrical activity during a complete cycle. Heart cells are charged or polarized in the resting state, but they depolarize and contract when electrically stimulated. The intracellular body fluids are excellent conductors of electrical current and are an important component of this process. When the depolarization (stimulation) process sweeps in a wave across the cells of the myocardium, the electrical current generated is conducted to the body’s surface, where it is detected by special electrodes placed on the patient’s limbs and chest. An ECG tracing shows the voltage of the waves and the time duration of waves and intervals. By studying the amplitude of the waves and measuring the duration of the waves and intervals, disorders of impulse formation and conduction can be diagnosed.
NOTE
New technology, the LightSpeed (GE Healthcare, Waukesha, WI) volume computed tomography (VCT), allows for imaging of an organ (e.g., heart, brain) and display of a three-dimensional anatomic view. Clinical applications include comprehensive views of heart and coronary vessels, ability to rule out (or in) aortic dissection and pulmonary embolism, and dynamic acquisition of perfusion of the brain.
Reference Values
Normal
Normal positive and negative deflections in an ECG recording
Normal cardiac cycle components (one normal cardiac cycle is represented by the P wave, QRS complex, and T wave; additionally, a U wave may be observed). This cycle is repeated continuously and rhythmically (Fig. 16.4).
The P wave indicates atrial depolarization; QRS complex indicates ventricular depolarization; T wave indicates ventricular repolarization/resting stage between beats; and U wave indicates nonspecific recovery after potentials.
Normal Waves
The P wave is normally upright; it represents atrial depolarization and indicates electrical activity associated with the original impulse that travels from the sinus node through the atrial sinus. If P waves are present; are of normal size, shape, and deflection; have normal conduction intervals to the ventricles; and demonstrate rhythmic timing variances between cardiac cycles, it can be assumed that they began in the sinoatrial node.
The Ta or Tp designation is used to differentiate atrial repolarization, which ordinarily is obscured by the QRS complex, from the more conventional T wave, which signifies ventricular repolarization (see number 8 below).
The Q(q) wave is the first downward/negative deflection in the QRS complex; it results from ventricular depolarization. The Q(q) wave may not always be apparent.
The R(r′) wave is the first upright/positive deflection after the P wave (or in the QRS complex); it results from ventricular depolarization.
The S(s′) wave is the downward/negative deflection that follows the R wave.
The Q and S waves are negative deflections that do not normally rise above the baseline.
The T wave is a deflection produced by ventricular repolarization. There is a pause after the QRS complex, and then a T wave appears. The T wave is a period of no cardiac activity before the ventricles are again stimulated. It represents the recovery phase after the ventricular contraction.
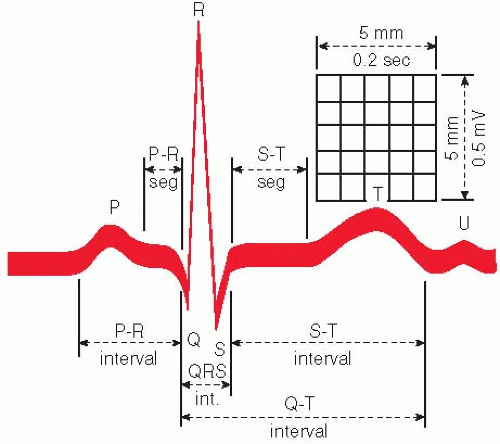
FIGURE 16.4. Commonly measured complex components. (From Smeltzer SC, Bare BG: Brunner and Suddarth’s Textbook of Medical-Surgical Nursing, 8th ed. Philadelphia, Lippincott-Raven, 1996.)
The U wave is a deflection (usually positive) following the T wave. It represents late ventricular repolarization of Purkinje’s fibers or the intraventricular papillary muscles. This wave may or may not be present on an ECG. If it appears, it may be abnormal, depending on its configuration.
NOTE
In some cases, capital letters are used to refer to relatively large waves (>5 mm) and small letters to refer to relatively small waves (<5 mm). Example: qRS rather than QRS.
Normal Intervals
The R-R interval (normally, 0.83 second at a heart rate of 72 beats/minute) is the distance between successive R waves. In normal rhythms, the interval, in seconds or fractions of seconds, between two successive R waves divided into 60 seconds provides the heart rate per minute.
The P-P interval (normally, 0.83 second at a heart rate of 72 beats/minute) will be the same as the R-R interval in normal sinus rhythm. The responsiveness of the sinus node to physiologic activity (e.g., exercise, rest, respiratory cycling) produces a rhythmic variance in P-P intervals.
The PR interval (˜0.16 second) measures conduction tone and includes the time it takes for atrial depolarization and normal conduction delay in the atrioventricular node to occur. It terminates with the onset of ventricular depolarization. It is the period from the start of the P wave to the beginning of the QRS complex. This interval represents the time it takes for the impulse to traverse the atria, proceed through the atrioventricular node, and reach the ventricles and initiate ventricular depolarization.
The QRS interval (normally, 0.12 second) represents ventricular depolarization time and tracks the electrical impulse as it travels from the atrioventricular node through the bundle branches to Purkinje’s fibers and into the myocardial cells. Normal waves consist of an initial downward deflection (Q wave), a large upward deflection (R wave), and a second downward deflection (S wave). It is measured from the onset of the Q wave (or R if no Q is visible) to the termination of the S wave.
QT interval measures the duration of ventricular activation and recovery. It is measured from the beginning of the QRS complex to the end of the T wave. The QT interval varies with the heart rate, gender, and time of day. Normal QT interval is 350 to 430 milliseconds.
Normal Segments and Junctions
The PR segment is normally isoelectric and is the portion of the ECG tracing from the end of the P wave to the onset of the QRS complex.
The J junction (or J point) is the point at which the QRS complex ends and the ST segment begins.
The ST segment is that part of the ECG from the J point to the onset of the T wave. Elevation or depression is determined by comparing its location with the portion of the baseline between the end of the T wave and the beginning of the P wave or relating it to the PR segment. This segment represents the period between the completion of depolarization and onset of repolarization (i.e., recovery) of the ventricular muscles.
The TP segment (˜0.25 second) is the portion of the ECG record between the end of the T wave and the beginning of the next P wave. It is usually isoelectric.
Normal Voltage Measurements
Voltage from the top of the R wave to the bottom of the S wave is 1 mV. Voltage of the P wave is ˜0.1 to 0.3 mV. Voltage of the T wave is ˜0.2 to 0.3 mV. Upright deflection voltage is measured from the upper part of the baseline to the peak of the wave.
Negative deflection voltage is measured from the lower portion of the baseline to the nadir of the wave.
Recording the Electrical Impulses
Because cardiac electrical forces extend in several directions at the same time, a comprehensive view of heart activity is possible only if the flow of current in several different planes is recorded.
For a 12-lead ECG, 12 leads are simultaneously used to present this comprehensive picture:
Limb leads (I, II, III, AVL, AVF, AVR) record events in the frontal plane of the heart.
Chest leads (V1, V2, V3, V4, V5, and V6) record a horizontal view of the heart’s electrical activity.
Occasionally, an esophageal lead, which is swallowed or placed in the esophagus, can supply additional information. This type of lead is frequently used during surgical procedures.
His bundle electrography is a very specialized procedure that requires placement of an intravenous catheter, which is then advanced into the heart. An ECG is simultaneously being recorded while the electrical activity of the bundle of His is measured by a sensor at the end of the catheter. This test measures the electrical activity between contractions (Fig. 16.5).
ECG Versus Vectorcardiogram
The vectorcardiogram, like the ECG, records the electrical forces of the heart. The major difference between these two methods is the way in which these forces are displayed (Table 16.1). A vectorcardiogram records a three-dimensional display of the heart’s electrical activity, whereas the ECG is a single-plane representation. The following are the three planes of the vectorcardiogram:
Frontal plane (combines the Y and X axes)
Sagittal plane (combines the Y and Z axes)
Horizontal plane (combines the X and Z axes)
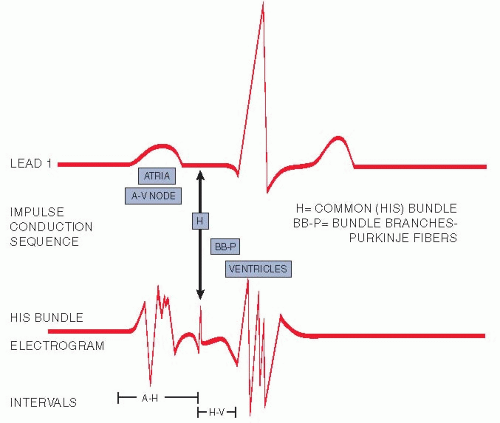 FIGURE 16.5. His bundle electrogram. Note that electrophysiologic events are presented in relation to the surface electrocardiogram. (From Phillips RE, Feeney MK: The Cardiac Rhythms, 3rd ed. Philadelphia, WB Saunders, 1990.) |
TABLE 16.1 Comparison of the ECG and Vectorcardiogram | ||||||||
|---|---|---|---|---|---|---|---|---|
| ||||||||
Procedure
The following steps apply to both the ECG and the vectorcardiogram:
Have the patient assume a supine position; however, recordings can be taken during exercise.
Prepare the skin sites and, if necessary, shave, and place electrodes on the four extremities and on specific chest sites. Ensure that the right leg is the ground (Fig. 16.6).
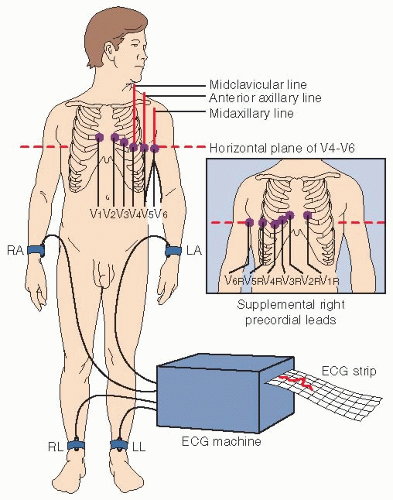
FIGURE 16.6. Electrocardiogram electrode placement. (From Smeltzer SC, Bare BG: Brunner and Suddarth’s Textbook of Medical-Surgical Nursing, 8th ed. Philadelphia, Lippincott-Raven, 1996.)
A typical rhythm strip is a 2-minute recording from a single lead, usually lead II. It is frequently used to evaluate dysrhythmias.
Follow guidelines in Chapter 1 for safe, effective, informed intratest care.
 PROCEDURAL ALERT
Chest pain, if present, should be noted on the ECG strip.
The presence of a pacemaker and the use of a magnet in testing should be documented.
Marking the position on the chest wall in ink ensures a reproducible precordial lead placement.
Clinical Implications
ECG
The ECG does not depict the actual mechanical state of the heart or functional status of the valves.
An ECG may be normal in the presence of heart disease unless the pathologic process disturbs the electrical forces. It cannot predict future cardiac events.
An ECG should be interpreted and treatment ordered within the context of a comprehensive clinical picture.
ECG abnormalities are categorized according to five general areas:
Heart rate
Heart rhythm
Axis or position of the heart
Hypertrophy
Infarction/ischemia
Typical abnormalities include the following:
Pathologic rhythms
Conduction system disturbances
Myocardial ischemia
Myocardial infarction
Hypertrophy of the heart
Pulmonary infarction
Altered potassium, calcium, and magnesium levels
Pericarditis
Effects of drugs
Ventricular hypertrophy
Vectorcardiogram
The vectorcardiogram is more sensitive than the ECG for diagnosing myocardial infarction; it is probably not any more specific.
Vectorcardiography is more specific than the ECG in determining hypertrophy or ventricular dilation.
Differentiation of intraventricular conduction abnormalities is possible.
Interfering Factors
Race: ST elevation with T-wave inversion is more common in African Americans but disappears with maximal exercise effort.
Food intake: High carbohydrate content is especially associated with an intracellular shift of potassium in association with intracellular glucose metabolism. Nondiagnostic ST depression and T-wave inversion are evident with hypokalemia.
Anxiety: Episodic anxiety and hyperventilation are associated with prolonged PR interval, sinus tachycardia, and ST depression with or without T-wave inversion. This may be due to autonomic nervous system imbalances.
Deep respiration: The position of the heart in the chest shifts more vertically with deep inspiration and more horizontally with deep expiration.
Exercise/movement: Strenuous exercise before the test can produce misleading results. Muscle twitching can also alter the tracing.
Position of heart within the thoracic cage: There may be an anatomic cardiac rotation in both horizontal and frontal planes.
Position of precordial leads: Inaccurate placement of the bipolar chest leads and the transposition of right and left arm and left leg electrodes will affect test results. In normal persons, lead reversal produces the typical ECG findings of dextrocardia (congenital anomaly resulting in the heart being on the right side of the chest) in frontal plane leads and can mimic a myocardial infarction pattern.
A leftward shift in the QRS axis occurs with excess body weight, ascites, and pregnancy.
Age: At birth and during infancy, the right ventricle is hypertrophied because the fetal right ventricle performs more work than the left ventricle. T-wave inversion in leads V1 to V3 persists into the second decade of life and into the third decade in black persons.
Gender: Women exhibit slight ST-segment depression.
Chest configuration and dextrocardia: In this congenital anomaly in which the heart is transposed to the right side of the chest, the precordial leads must also be placed over the right side of the chest.
Severe drug overdose, especially with barbiturates, and many other medications can influence ECG configuration. Antiarrhythmics, antihistamines, and antibiotics can widen QT intervals.
The serious effects of electrolyte imbalances show up on the ECG as follows:
Increased Ca++: shortened QT; less frequently, prolonged PR interval and QRS complex
Decreased Ca++: prolonged QT
Alterations in K+ may produce cardiac arrhythmias.
Interventions
Pretest Patient Care
Explain the test purpose, procedure (ECG is a graphic record of electric pulses associated with the contraction and relaxation of heart), and interfering factors. Emphasize that ECG is painless and does not deliver electrical current to the body. A resting ECG is no more than a 1-minute record of the heart’s electrical activity (the amount of voltage generated by the heart and the time required for that voltage to travel through the heart).
Have the patient completely relax to ensure a satisfactory tracing.
Be aware that ideally, the person should rest for 15 minutes before ECG recording. Have the patient avoid heavy meals and smoking for at least 30 minutes before the ECG, and longer if possible.
Follow guidelines in Chapter 1 for safe, effective, informed pretest care.
Posttest Patient Care
Recognize the limitations of an ECG. A normal ECG does not rule out coronary artery disease or areas of cardiac ischemia. Conversely, an abnormal ECG in and of itself does not always signify heart disease.
Interpret test results and counsel and monitor the patient appropriately. A resting ECG is usually normal in those patients who experience only angina. It can provide evidence of prior heart damage. The ECG is one diagnostic tool within a repertoire of diagnostic modalities and should be viewed as such. The presence or absence of heart disease should not be presumed solely on the basis of the ECG.
Follow guidelines in Chapter 1 for safe, effective, informed posttest care.
When an ECG shows changes that indicate ischemia, injury, or infarction, these changes must be reported and acted on immediately. The goal of diagnosis and treatment is to increase myocardial blood supply and reduce oxygen demand.
When ECG changes represent stages of ischemia, injury, or necrosis and symptoms of possible myocardial infarction appear, the primary concern is balancing myocardial oxygen supply and demand as follows:
Nitroglycerin dilates blood vessels.
Narcotics relieve pain and anxiety.
Calcium channel blockers relieve coronary spasm.
Oxygen increases O2 supply available to the myocardium.
β-Blocking drugs slow rapid heart rates.
Antiarrhythmic agents correct abnormal rhythms.
Frequent reassurances alleviate patient anxiety.
Monitoring for cardiac rhythm disturbances is an essential component of care. Potentially lethal dysrhythmias, especially ventricular tachyarrhythmias, require immediate intervention and may signal the need for possible cardiopulmonary resuscitation.
Serious diagnostic errors can be made if the ECG is not interpreted in the broader context of the patient’s history, signs, and symptoms.
The electrical axis is not synonymous with the anatomic position of the heart.
The signal-averaged ECG (SAE) is a noninvasive tool for identifying patients at risk for malignant ventricular dysrhythmias, particularly after myocardial infarction. During the later phase of the QRS complex and ST segment, the myocardium produces high-frequency, low-amplitude signals termed late potentials. These late potentials correlate with delayed activation of certain areas within the myocardium, a condition that predisposes to reentrant forms of ventricular tachycardia.
Indications
SAEs are performed to evaluate the etiology of ventricular dysrhythmias or as a precursor to electrophysiologic studies. Disorders that may produce regions of delayed myocardial conduction include myocardial infarction, nonischemic dilated cardiomyopathy, left ventricular aneurysm, and some forms of healed ventricular incisions (e.g., scar from tetralogy of Fallot surgical intervention).
Reference Values
Normal
Normal QRS complexes and ST segments
Procedure
The SAE, which is a modification of the conventional ECG, uses computerized techniques to provide signal averaging, amplification, and filtering of electrical potentials.
Place electrodes on the abdomen and anterior and posterior thorax. The signals received are converted to a digital signal. A typical QRS complex is used as a template against which subsequent cardiac cycles are compared. Typically, several hundred beats are averaged to analyze for late potentials.
Data collection usually takes about 20 minutes. Optimal recordings require that the patient be in a comfortable position and remain quiet, the proper application of electrodes, and elimination of interference from other electrical equipment.
Follow guidelines in Chapter 1 for safe, effective, informed intratest care.
Clinical Implications
SAE provides predictive values for potential ventricular tachycardias in patients who have a history of myocardial infarction or coronary artery disease.
Late potentials are stronger predictors of sudden death or sustained ventricular tachycardias than are ventricular dysrhythmias from a Holter monitor recording.
Evidence shows that late potentials associated with ventricular tachycardias are abolished following successful surgical intervention.
Patients who experience late potentials have a 17% incidence of sustained ventricular tachycardia or sudden death, compared with a 1% incidence in patients without late potentials. The incidence is even greater in the presence of decreased ejection fractions.
SAE may explain the cause of syncope subsequently identified as ventricular tachycardia during electrophysiologic study.
Interfering Factors
Increased time is required for recording beats in the presence of slow heart rates or frequent ventricular ectopics. Patient movement, talking, and restlessness also delay data procurement.
Bundle branch block can interfere with impulse averaging.
SAE does not provide information about antiarrhythmic drug effectiveness.
Late potentials do not occur in every patient with ventricular tachycardia.
Ventricular pacing prolongs ventricular activation time and obscures late potentials. Conversely, atrial pacing, even at rapid rates, does not alter ventricular late potentials.
Interventions
Pretest Patient Care
Explain the test purpose and procedure.
Follow Chapter 1 guidelines for safe, effective, informed pretest care.
Posttest Patient Care
Interpret test outcome and monitor appropriately.
Stay updated, free articles. Join our Telegram channel

Full access? Get Clinical Tree


