|
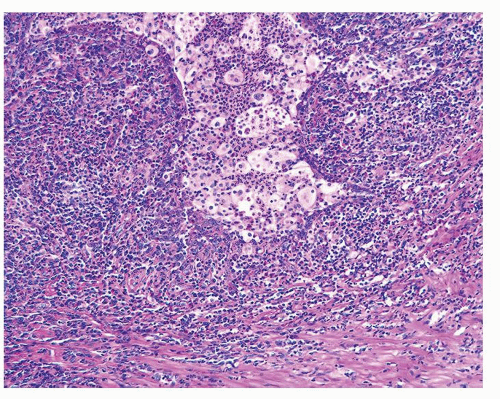
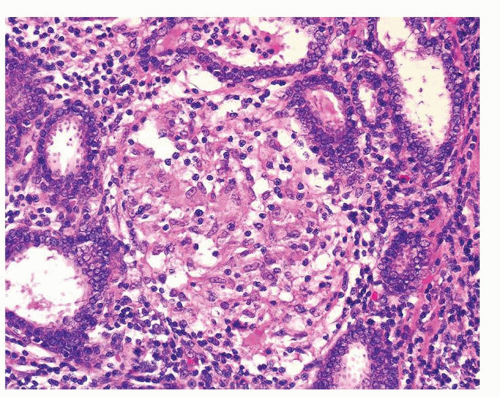
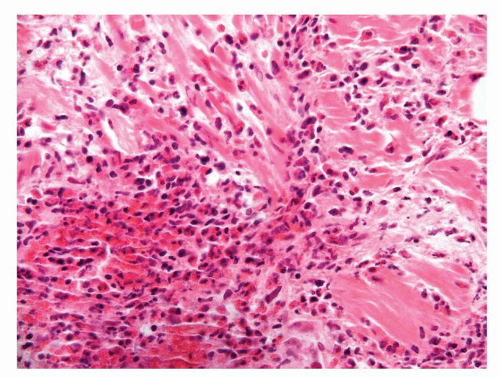
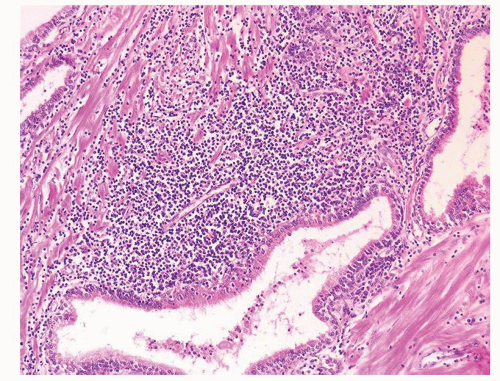
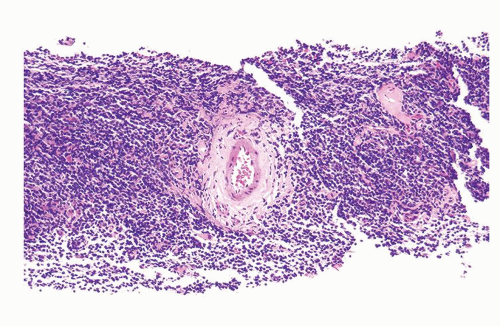
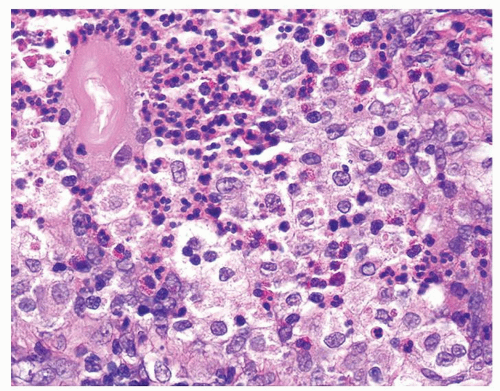 Figure 1.1.3 Central area of NSGP with microabscess formation, yet lacking caseation. In addition to neutrophils, there are histiocytes, lymphocytes, and eosinophils. |
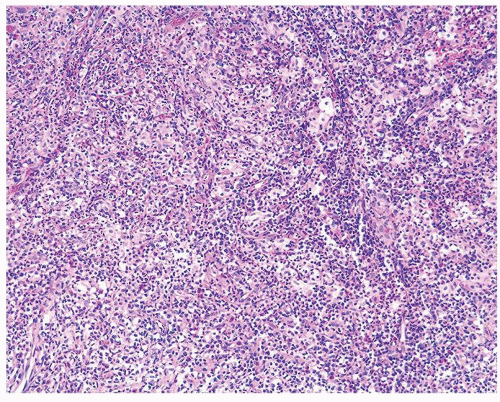
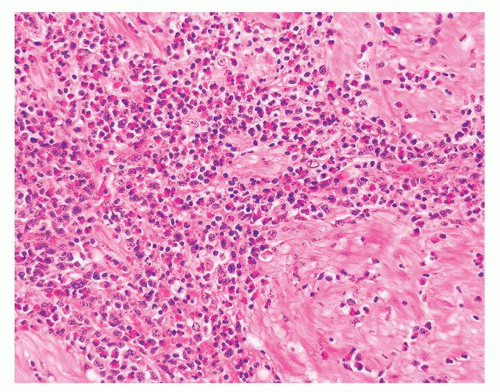
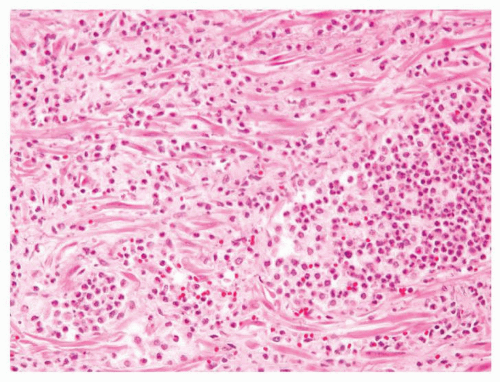
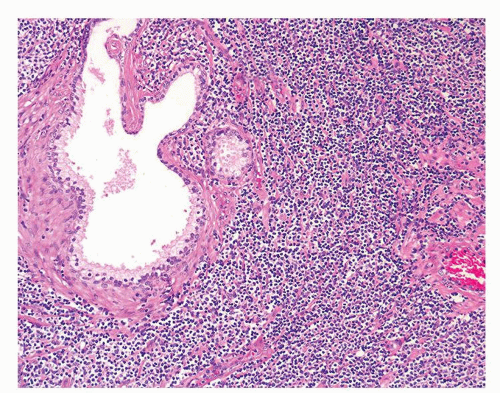
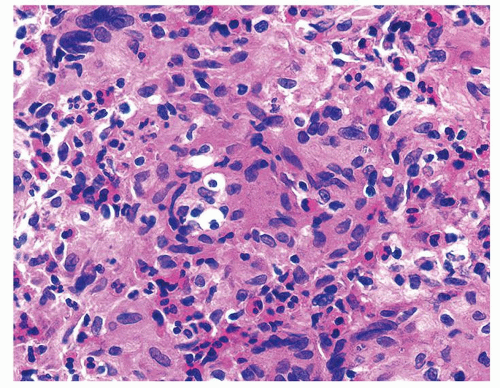 Figure 1.1.5 NSGP with more histiocytes, yet admixed eosinophils and neutrophils more typical of NSGP than of infectious granuloma. |
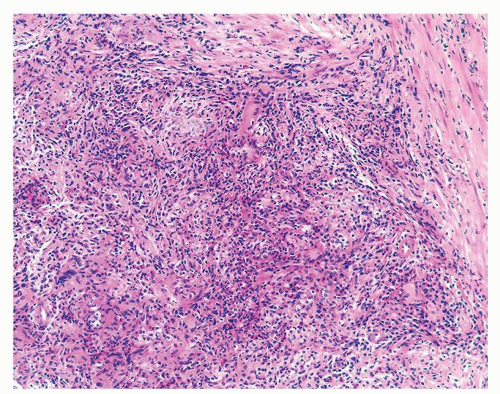
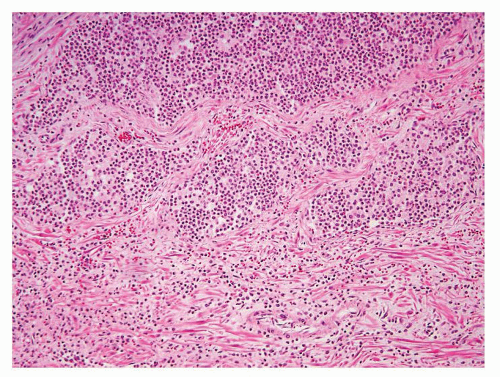
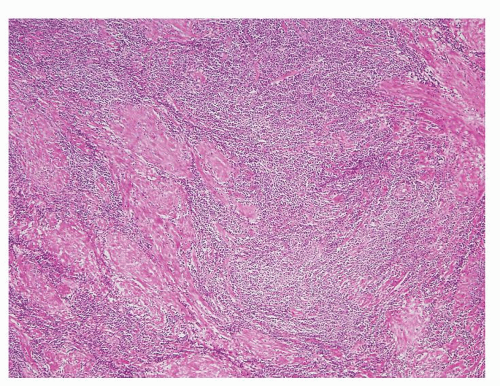
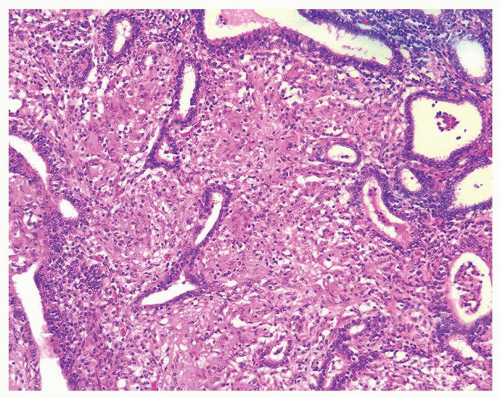 Figure 1.1.6 Infectious granuloma with periglandular granulomas consisting of histiocytes and lymphocytes without admixed plasma cells, neutrophils, or eosinophils. |
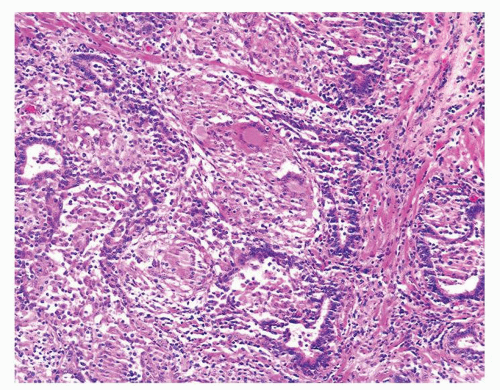
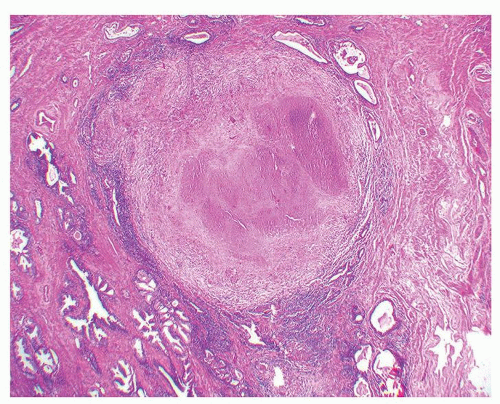
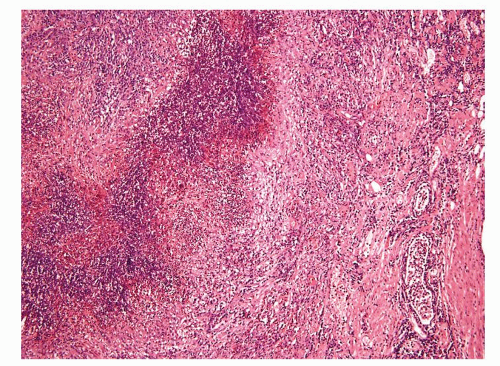
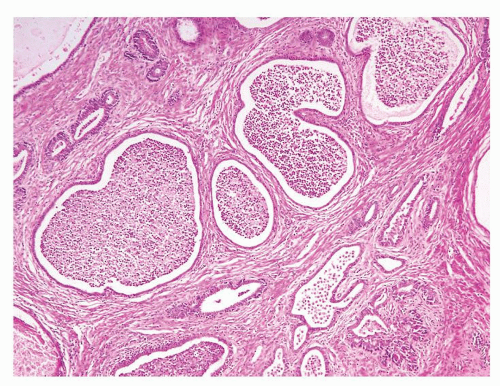
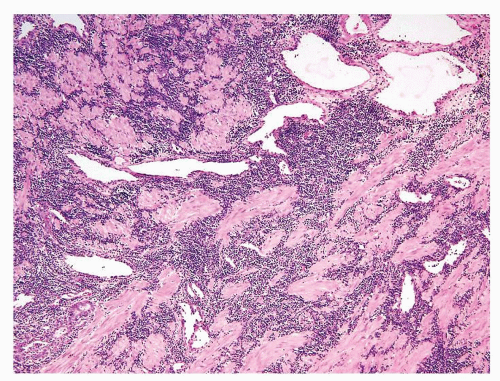
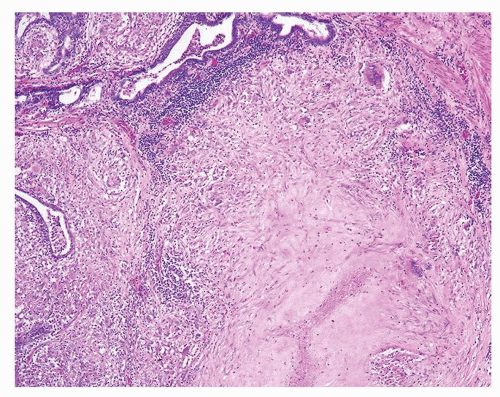 Figure 1.1.9 Infectious granuloma with focal intact glands (left) and larger granulomas (center) that have destroyed glands. |
|
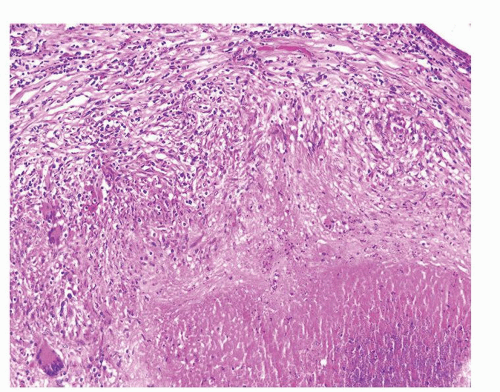
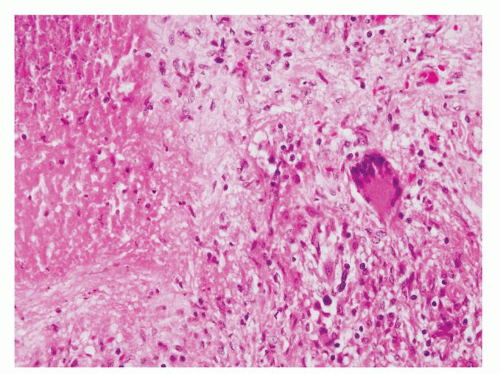
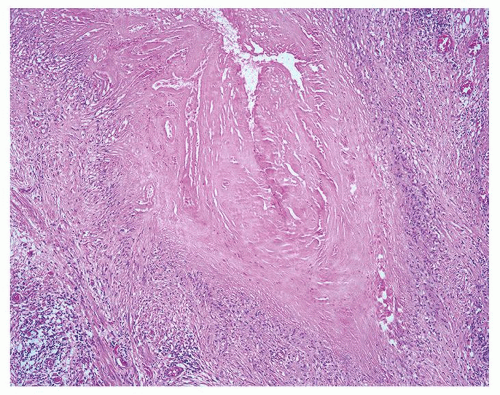
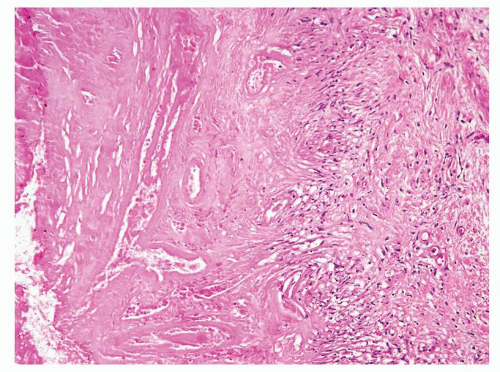
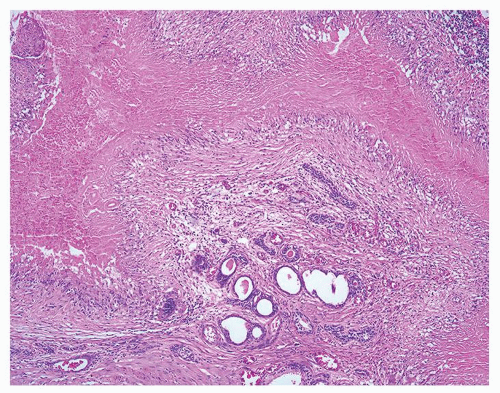
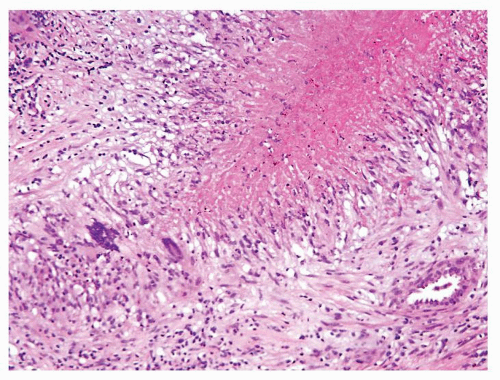 Figure 1.2.7 Postbiopsy ovoid granuloma mimicking an infectious granuloma with palisading histiocytes and scattered multinucleated histiocytes. |
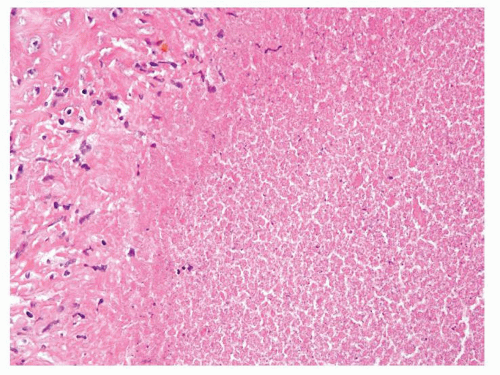
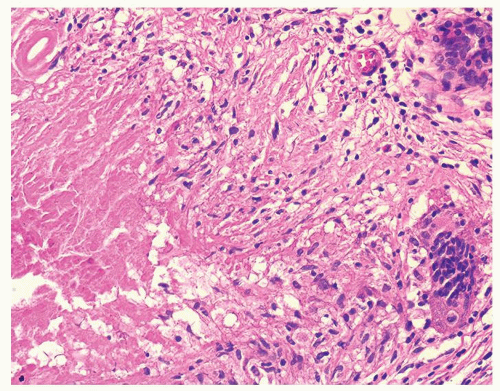 Figure 1.2.8 Higher magnification of Figure 1.2.7 with central necrosis lacking the fine granular amorphous appearance of infectious granulomas. |
|
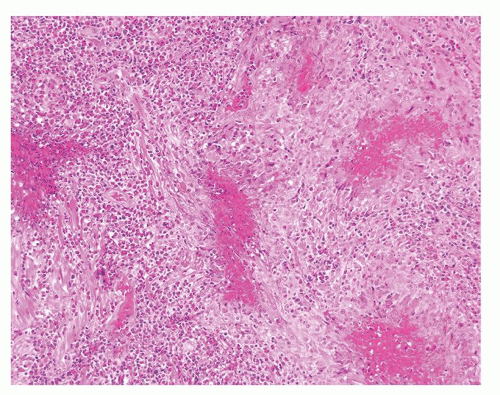 Figure 1.3.4 Allergic granuloma with multiple relatively uniformly sized and shaped ovoid necrotic granulomas. |
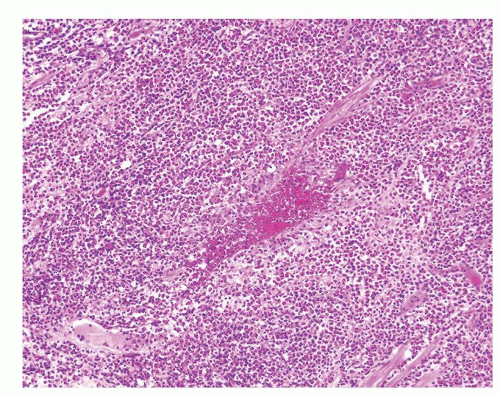 Figure 1.3.5 Allergic granuloma central eosinophilic necrosis surrounded by histiocytes and numerous eosinophils. |
|
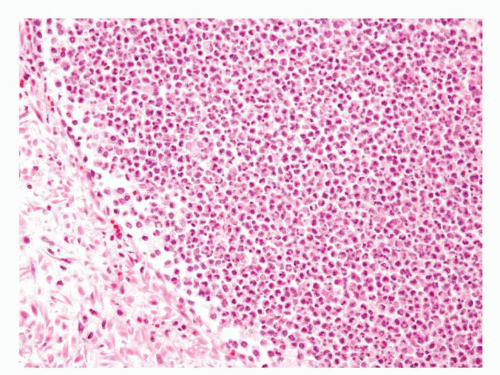 Figure 1.4.3 Higher magnification of Figure 1.4.2 with abscess formation. |
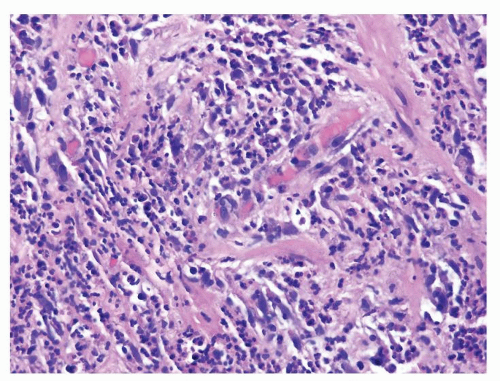 Figure 1.4.6 Higher magnification of Figure 1.4.5 showing numerous neutrophils infiltrating prostatic stroma. |
|
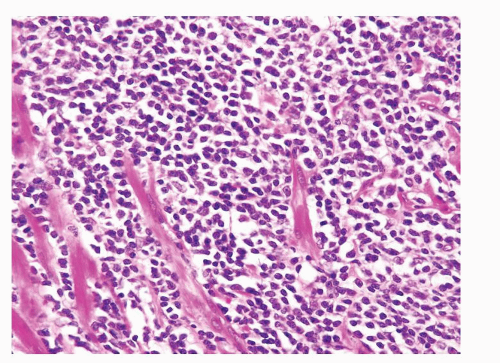
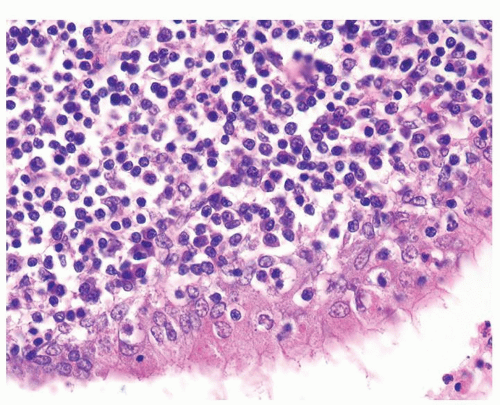 Figure 1.5.2 Higher magnification of Figure 1.5.1 with lymphocytes and plasma cells. |
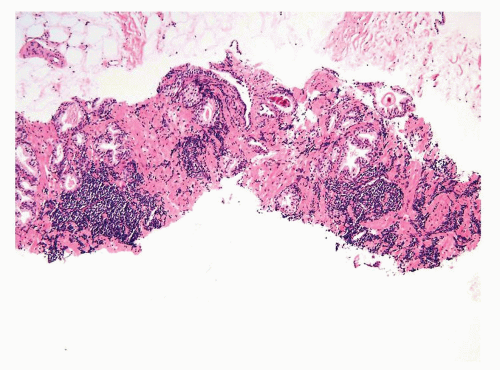 Figure 1.5.6 Needle biopsy with scattered dense infiltrates of CLL not in a periglandular distribution. |
|
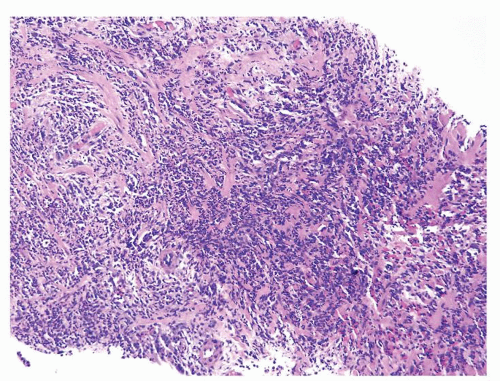
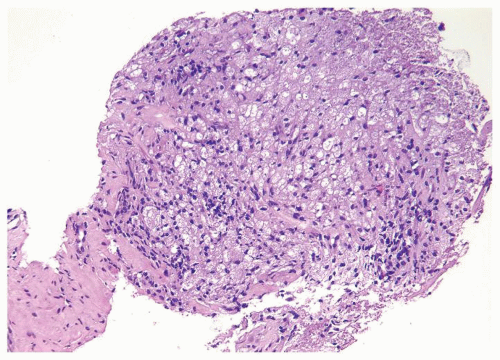
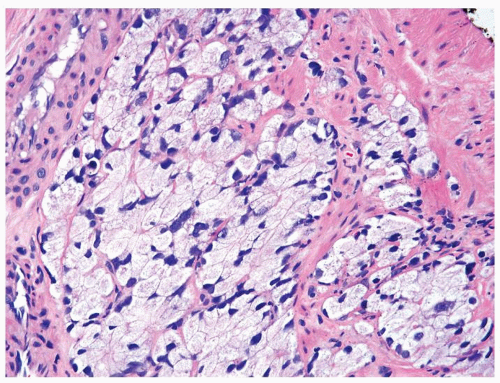
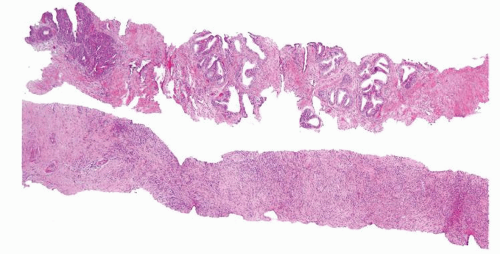 Figure 1.6.1 NSGP at low magnification (bottom core) can extensively involve a core destroying underlying benign glands and stroma, mimicking carcinoma. |
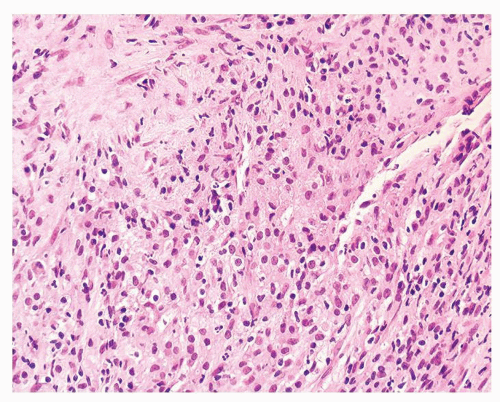
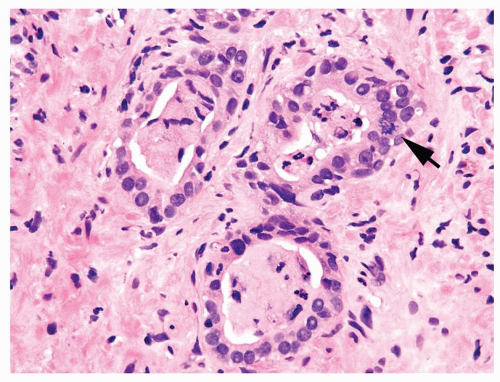
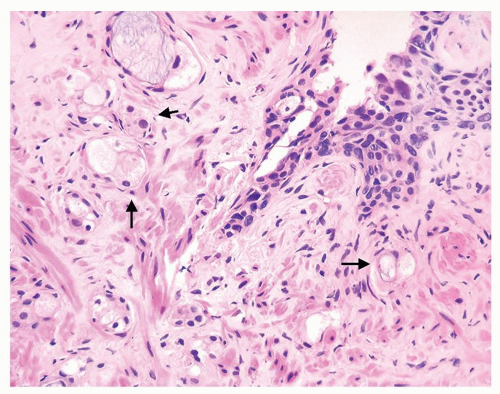
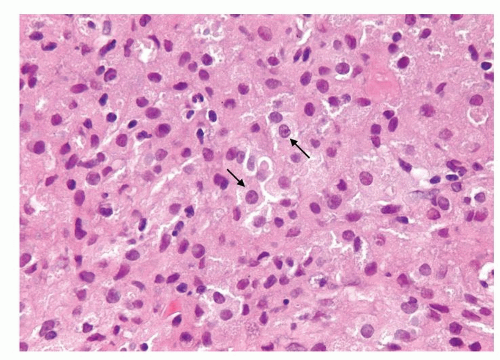 Figure 1.6.3 Higher magnification of Figure 1.6.2 with epithelioid histiocytes having prominent nucleoli (arrows). |
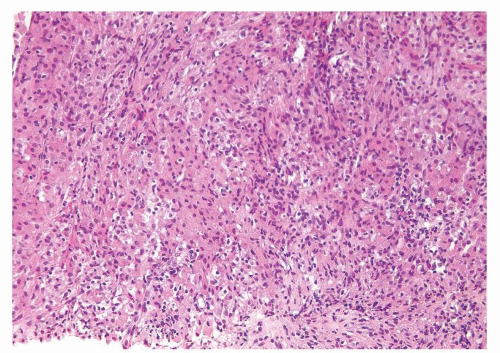
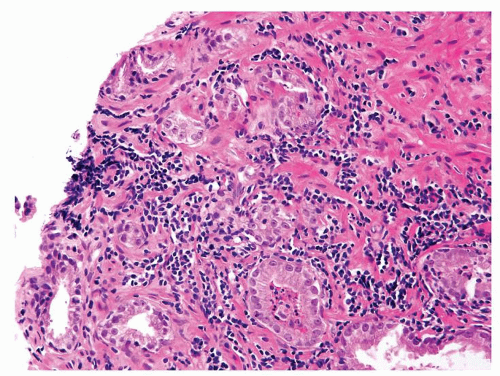
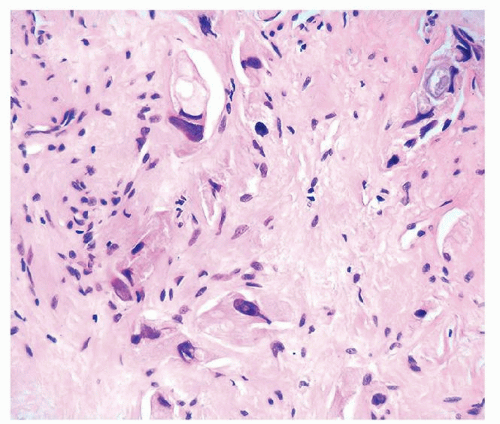
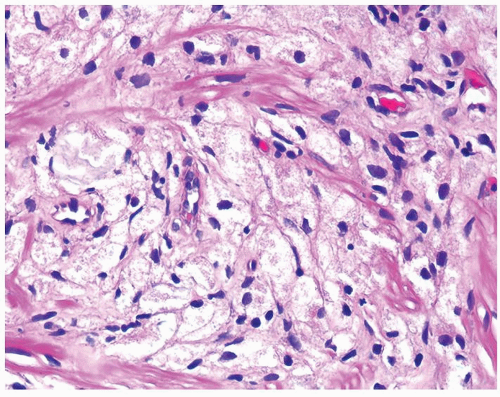
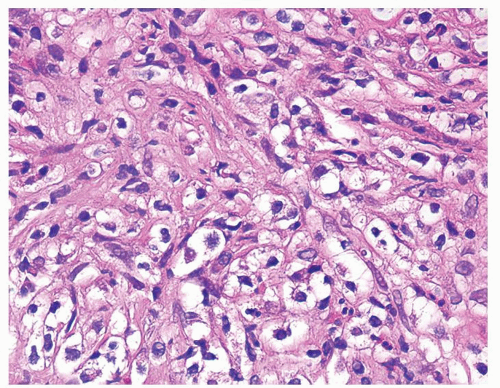 Figure 1.6.7 Higher magnification of Figure 1.6.6 with epithelioid histiocytes and admixed neutrophils and lymphocytes. |
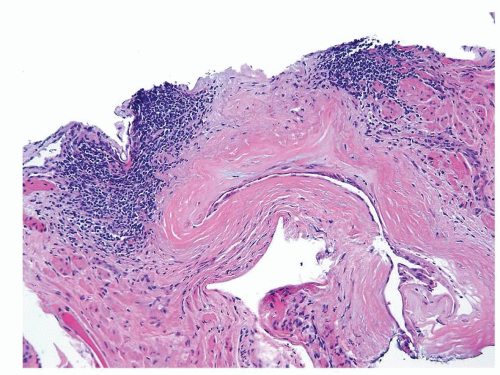
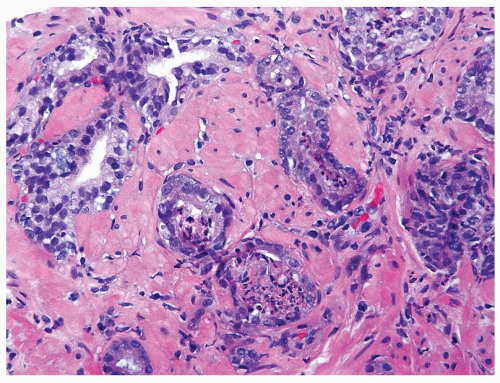
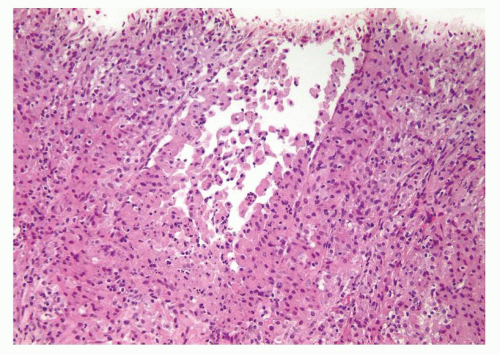 Figure 1.6.8 Partially ruptured dilated prostatic gland with intraluminal and periglandular epithelioid histiocytes. |
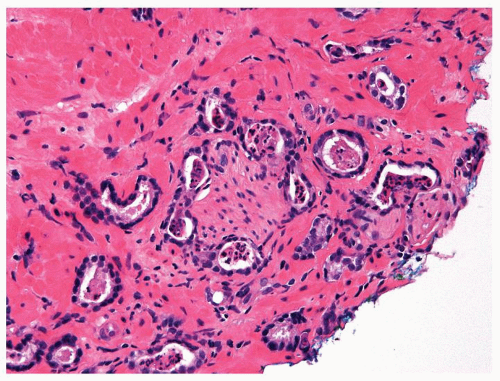
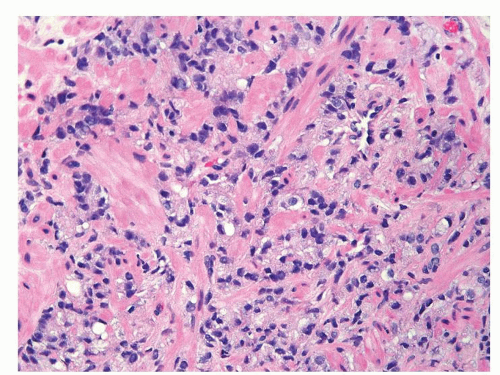 Figure 1.6.9 Cords of infiltrating relatively bland Gleason score 10 adenocarcinoma without admixed inflammation. |
|
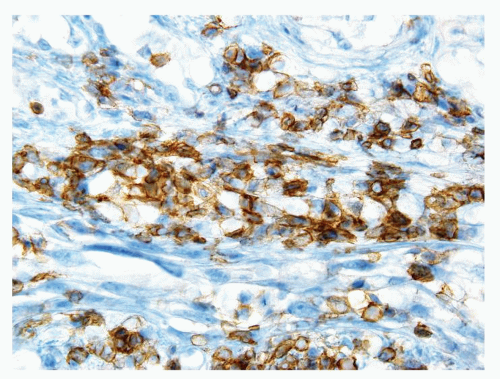 Figure 1.7.4 CD20 staining of signet-ring cell lymphocytes (same case as Fig. 1.7.3). |
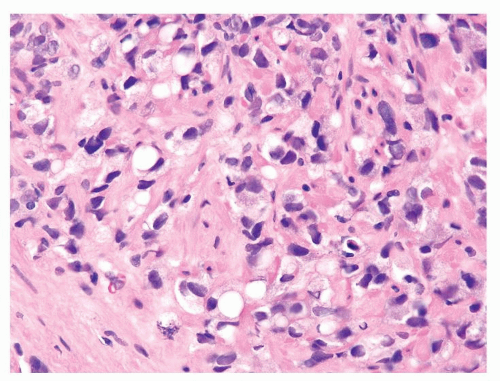 Figure 1.7.5 Gleason score 10 adenocarcinoma with vacuoles. Nuclei are more variably shaped, hyperchromatic, and larger than of lymphocytes. |
|
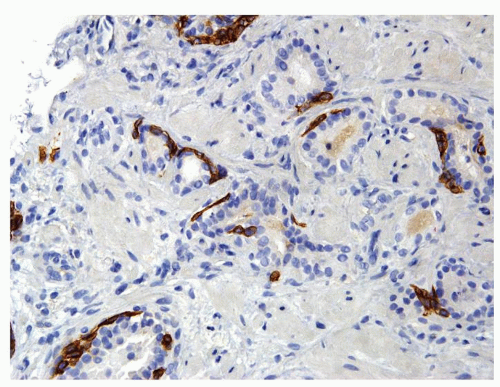 Figure 1.8.2 Same case as Figure 1.8.1 with a patchy basal cell layer for high molecular weight cytokeratin ruling out carcinoma. |
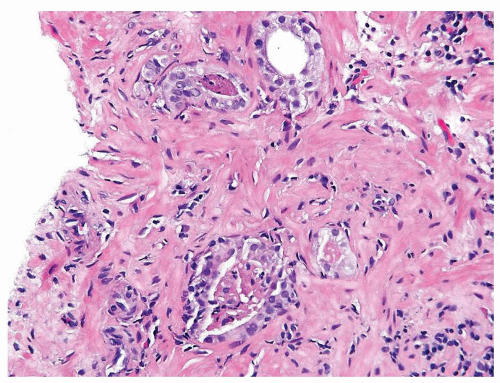 Figure 1.8.4 Cluster of crowded glands suspicious for carcinoma, yet a definitive diagnosis cannot be made due to associated inflammation. |
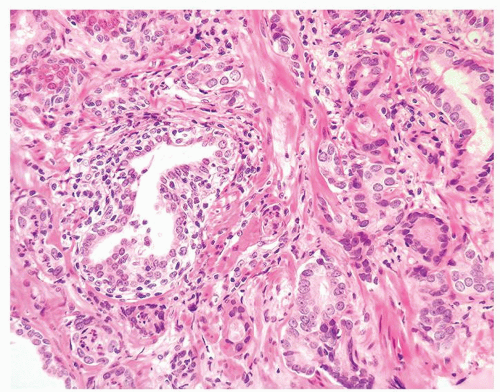 Figure 1.8.5 Small atypical glands of carcinoma associated with a lymphocytic infiltrate around benign gland (left). |
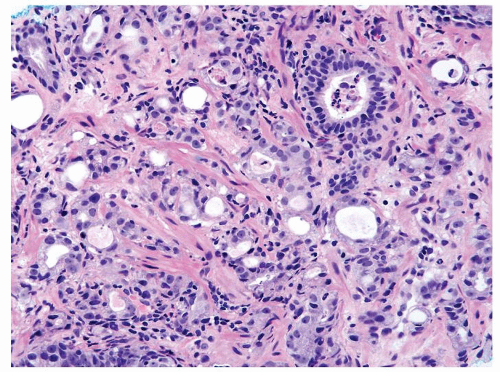 Figure 1.8.7 Inflamed cancer with greater degree of cytologically atypia compared to adjacent benign inflamed gland (upper right). |
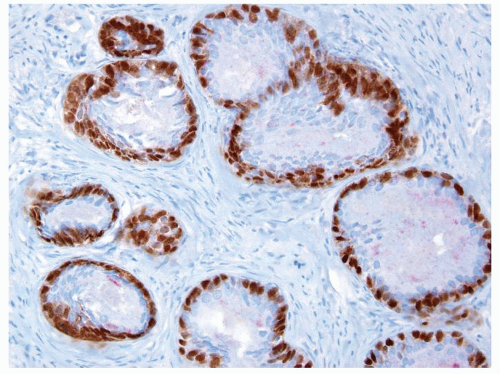
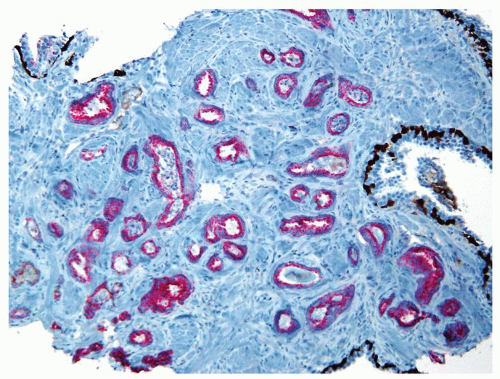 Figure 1.8.10 Same case as Figure 1.8.9 with numerous inflamed atypical glands negative for p63 and high molecular weight cytokeratin (brown) and positive for AMACR (red), consistent with carcinoma. |
|
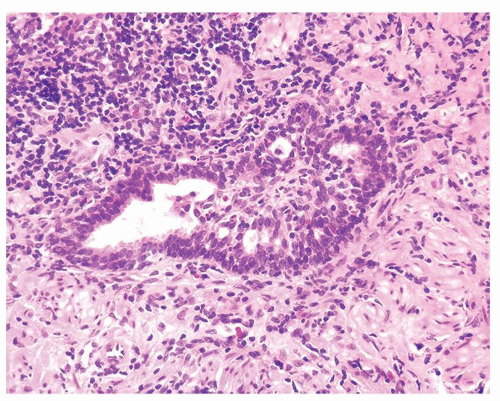 Figure 1.9.1 Partially involved inflamed benign gland with cribriform pattern. Nuclei have a slightly spindled appearance. |
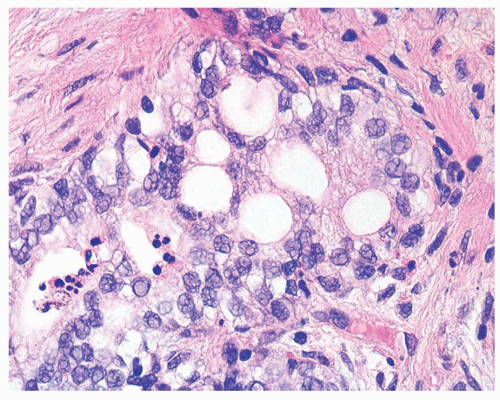 Figure 1.9.2 Inflamed benign cribriform gland with intraluminal acute inflammation. Nuclei are enlarged with visible nucleoli yet lack nuclear hyperchromasia. |
|
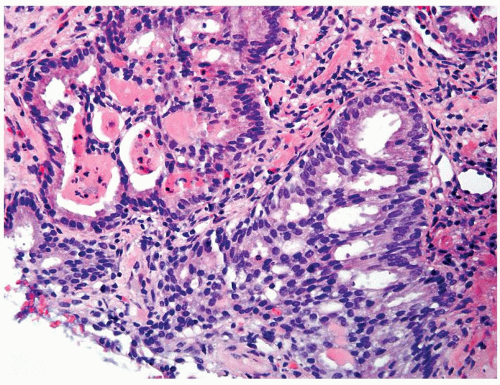
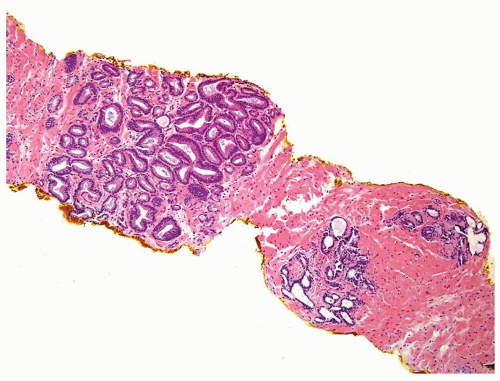 Figure 1.10.1 Benign atrophic glands (lower right) with very basophilic appearance compared to adenocarcinoma with amphophilic cytoplasm (upper left). |
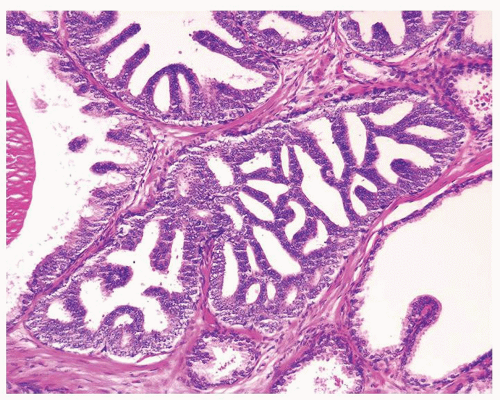
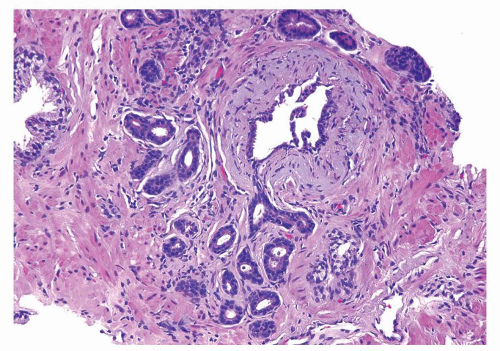 Figure 1.10.3 Post-atrophic hyperplasia with central dilated glands and surrounding smaller atrophic glands. |
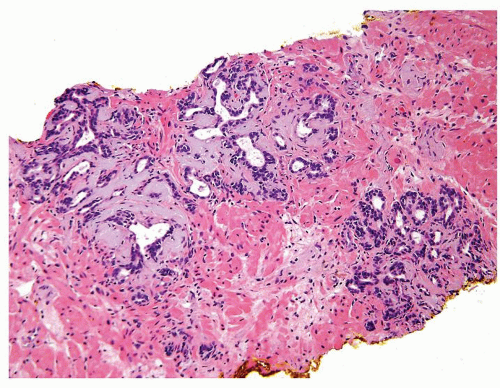
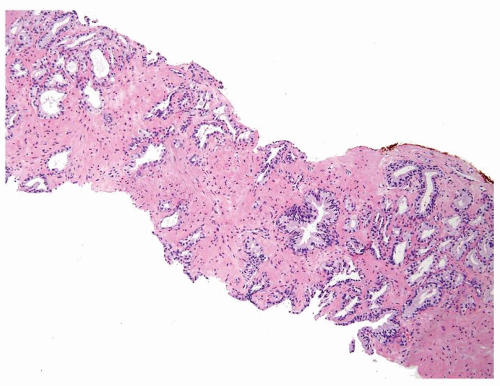
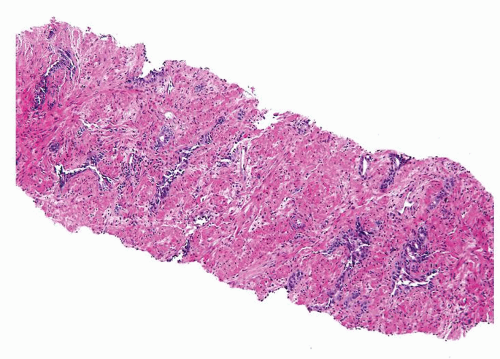
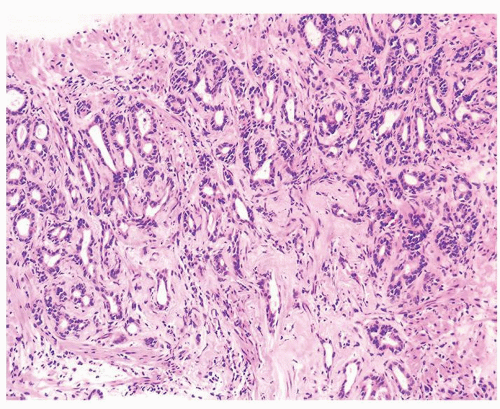 Figure 1.10.4 Post-atrophic hyperplasia with sclerosis imparting an infiltrative pattern on needle biopsy where the entire lesion is not visualized. |
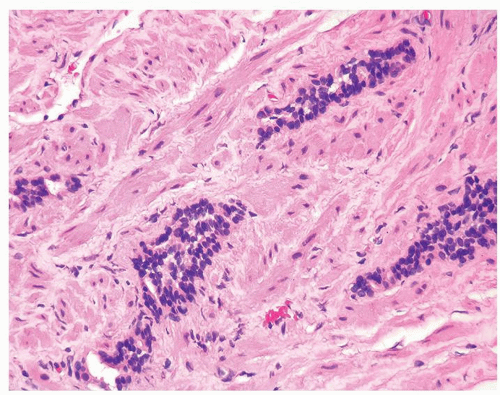 Figure 1.10.6 Tangential section of PAH with columns composed of cells with bland, small nuclei and scant cytoplasm. |
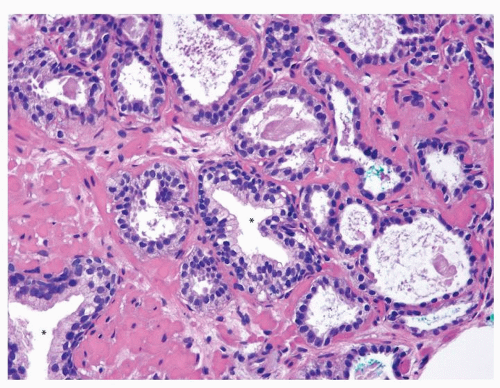
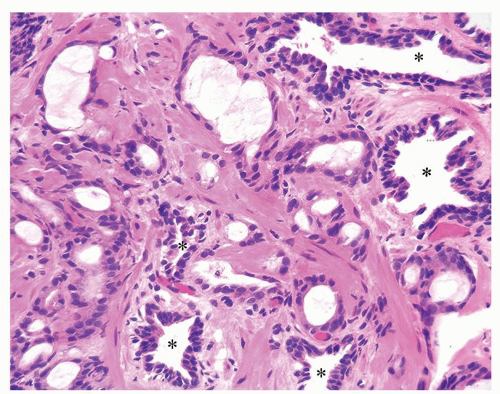 Figure 1.10.7 Small glands of atrophic adenocarcinoma infiltrating between larger benign glands with luminal undulations (asterisk). |
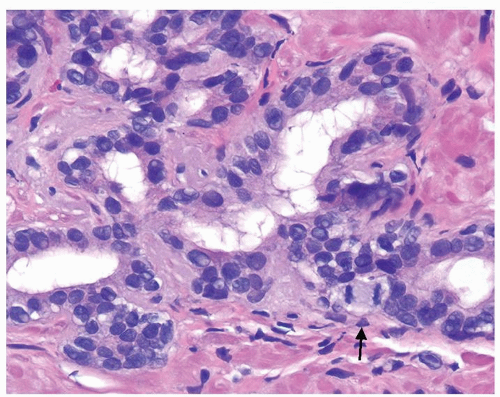
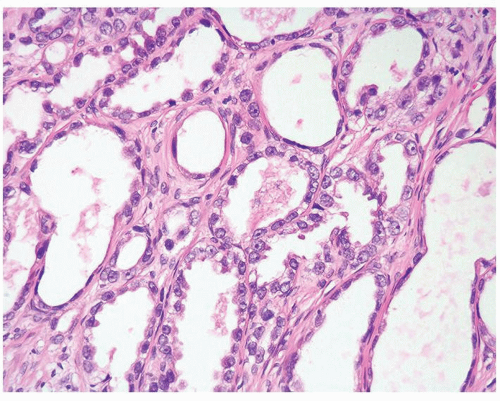
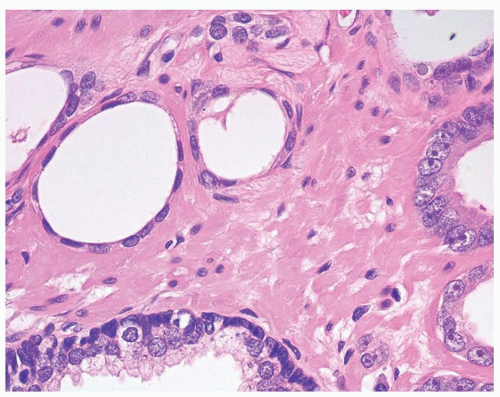
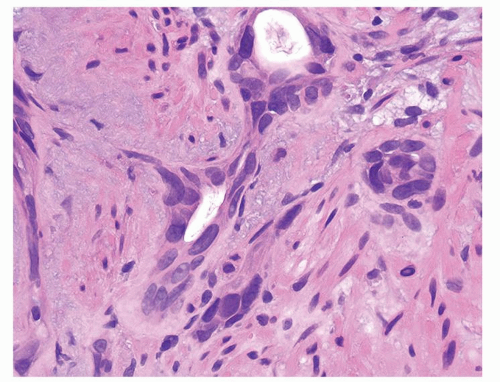
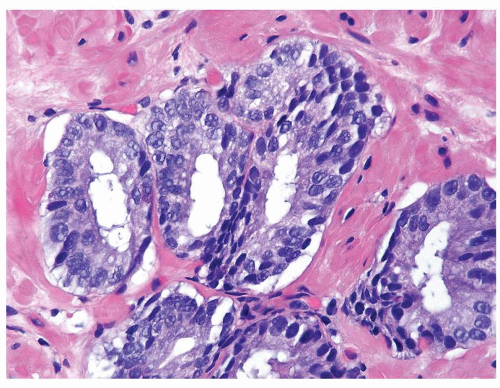
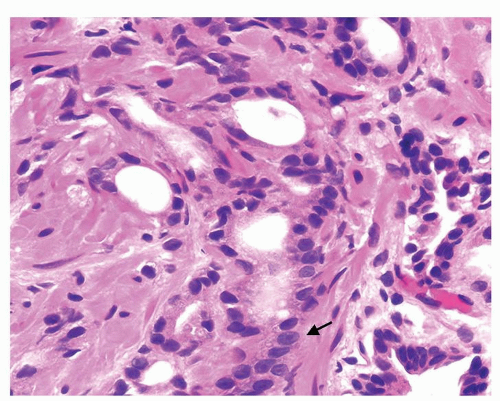 Figure 1.10.8 Higher magnification of Figure 1.10.7 showing some of the small atrophic glands of adenocarcinoma with prominent nucleoli (arrow). |
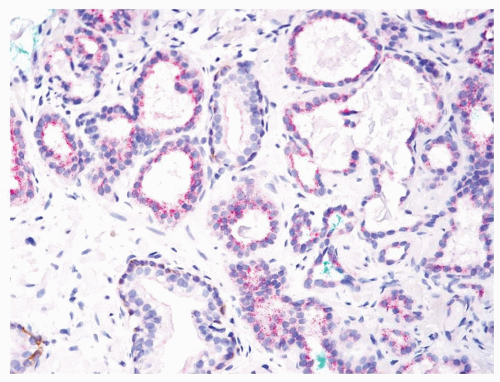 Figure 1.10.10 Triple stain of Figure 1.10.9 with atrophic adenocarcinoma lacking basal cells (brown) and positive for AMACR (red). |
|
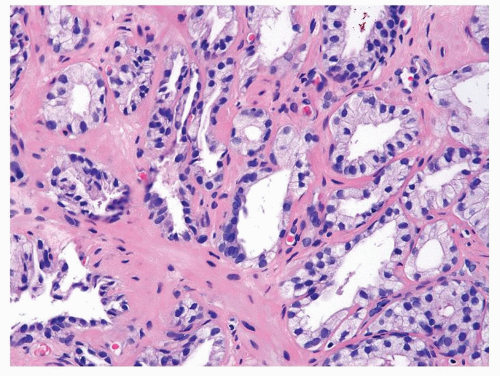 Figure 1.11.2 Higher magnification of Figure 1.11.1. |
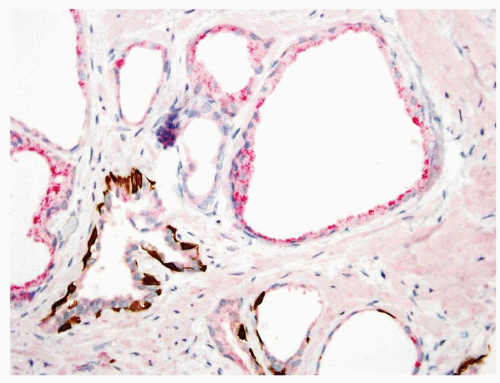 Figure 1.11.4 Triple stain of Figure 1.11.3 with several glands of partial atrophy having a patchy basal cell layer (bottom) with others negative for basal cells and positive for AMACR (top). |
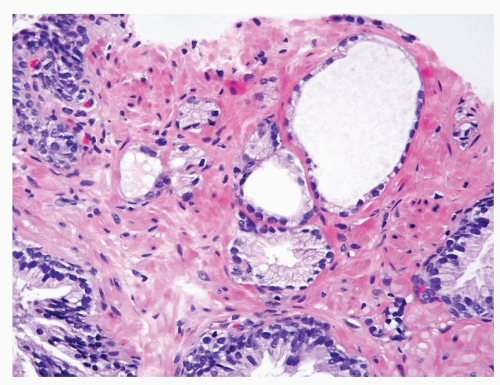 Figure 1.11.6 Partial atrophic glands admixed with some benign glands having more abundant cytoplasm. |
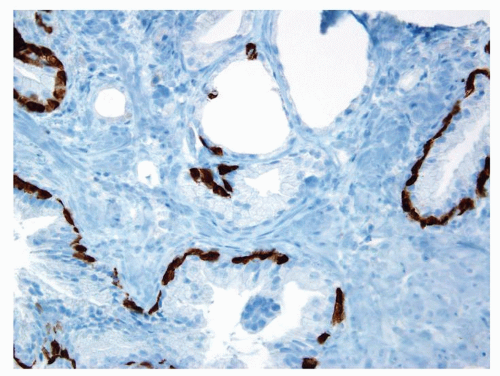 Figure 1.11.7 Some of the partially atrophic glands have patchy basal cells with others lacking high molecular weight cytokeratin staining. |
|
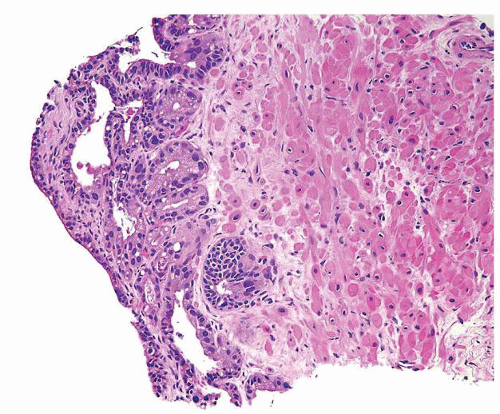 Figure 1.12.2 Needle biopsy with strip of seminal vesicle at edge (left) surrounded by small crowded glands. |
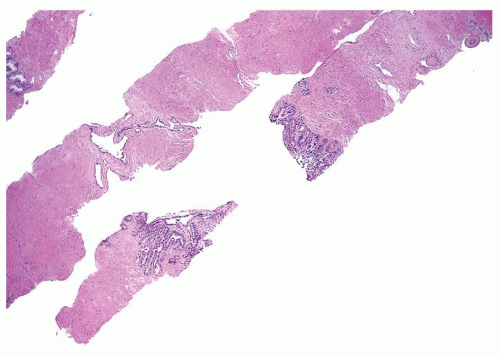 Figure 1.12.3 Needle biopsy with seminal vesicle epithelium on each side of break in tissue representing seminal vesicle lumen (bottom core). |
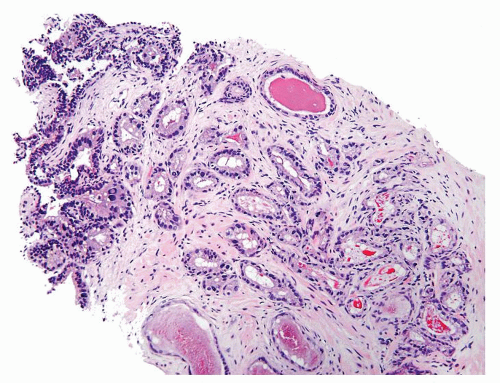 Figure 1.12.4 Needle biopsy with strip of seminal vesicle at edge (left) surrounded by small crowded glands. |
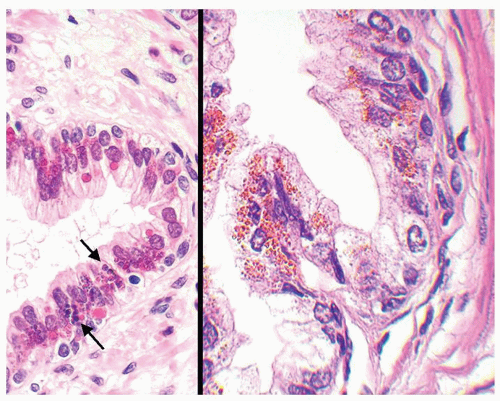
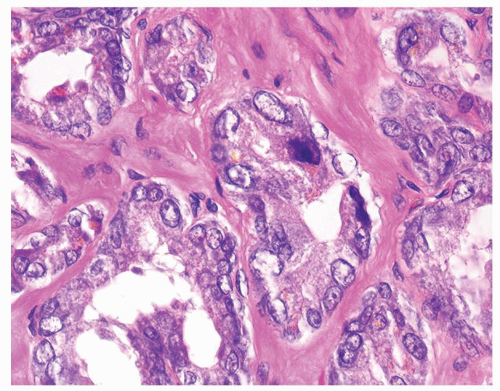 Figure 1.12.6 Higher magnification of Figure 1.12.5 where glands have degenerative atypia and golden brown lipofuscin pigment. |
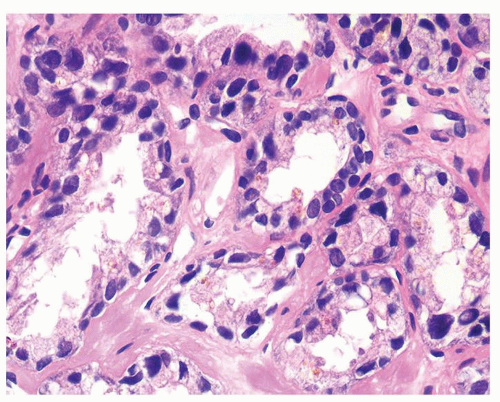 Figure 1.12.8 Same case as Figure 1.12.7 with glands showing degenerative atypia and golden brown lipofuscin pigment. |
|
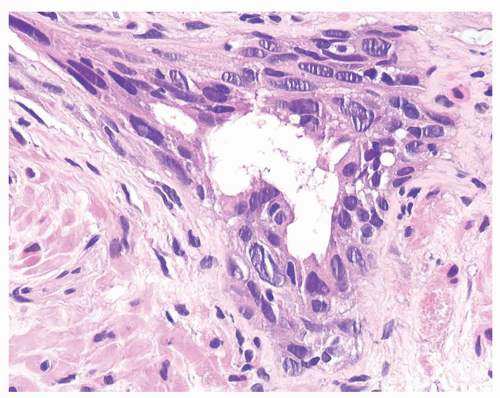 Figure 1.13.3 Multilayered benign-radiated gland with cells streaming parallel to the basement membrane. |
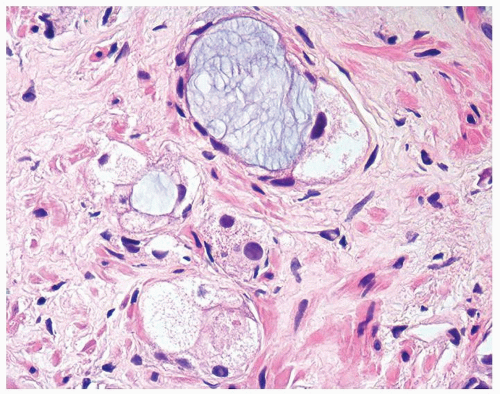 Figure 1.13.5 Higher magnification of Figure 1.13.4 with vacuolated crowded glands lined by bland nuclei. |
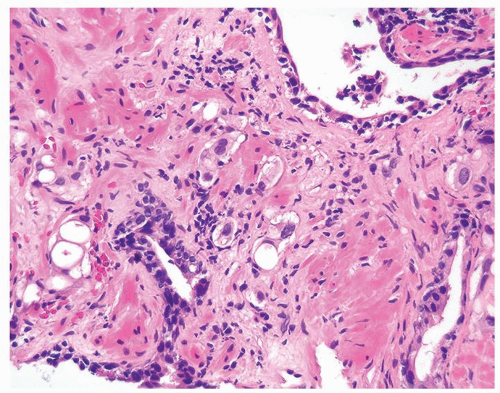 Figure 1.13.6 Radiated carcinoma with clusters of vacuolated cells invading between larger benign atrophic glands with radiation atypia. |
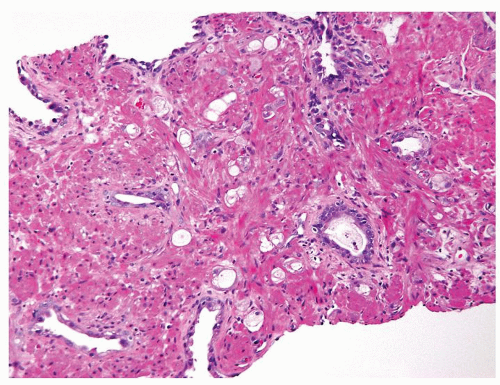 Figure 1.13.7 Crowded smaller glands with vacuolated cytoplasm diagnostic of adenocarcinoma with treatment affect in between darker, larger, more evenly spaced benign glands. |
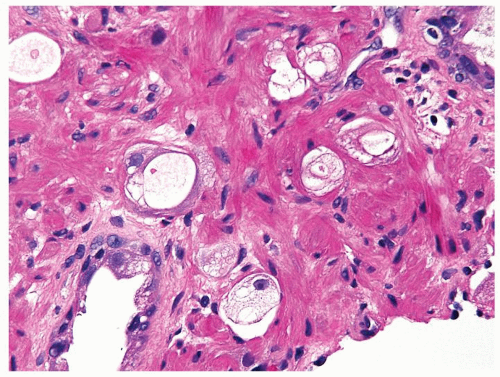 Figure 1.13.8 Higher magnification of Figure 1.13.7 with small vacuolated cancer glands (center) lacking prominent atypia invading between benign glands (lower left and upper right). |
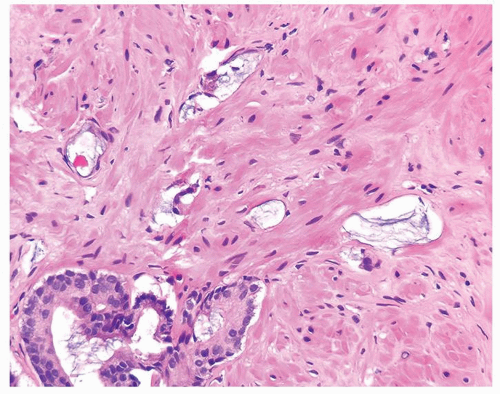 Figure 1.13.9 Atrophic glands of adenocarcinoma with abundant mucin showing treatment affect (top) adjacent to adenocarcinoma without treatment affect (lower left). |
|
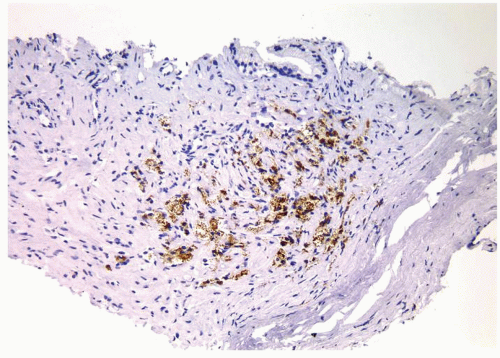 Figure 1.14.7 Same case as Figure 1.14.6 with positive staining for CD68. |
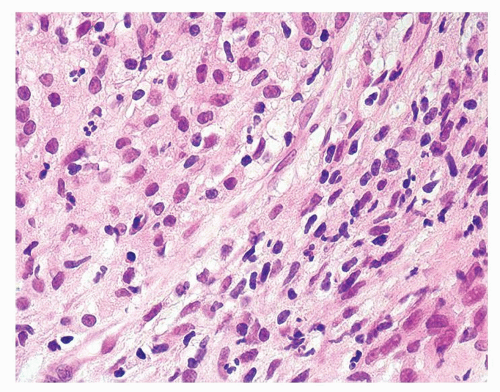
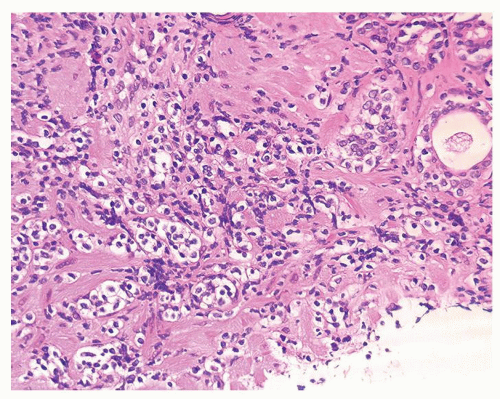
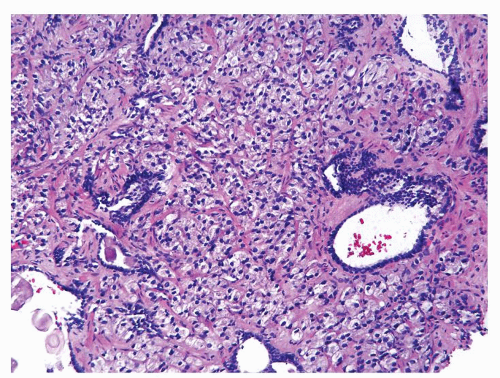
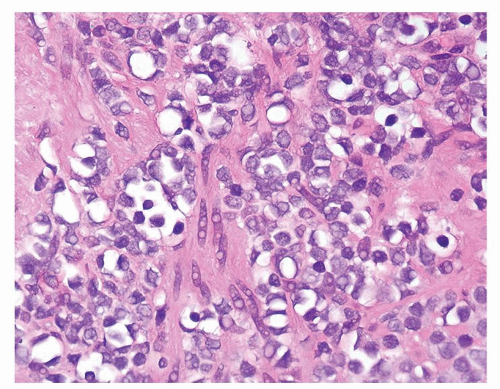
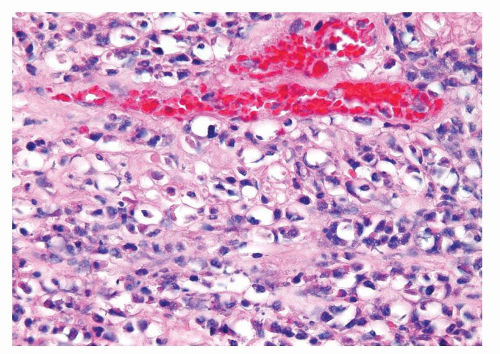
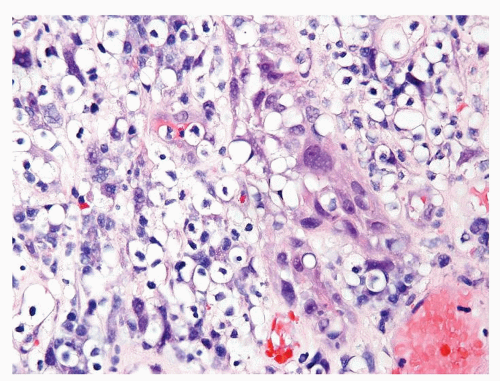
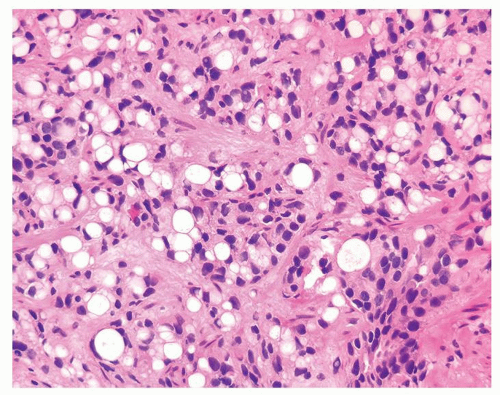
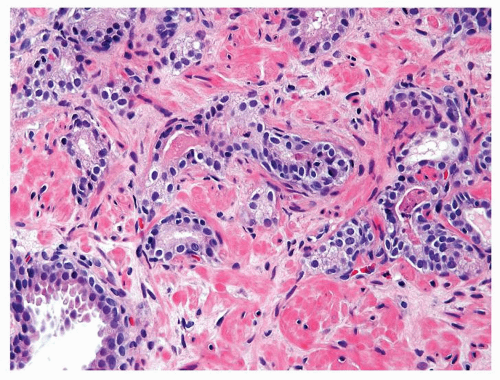
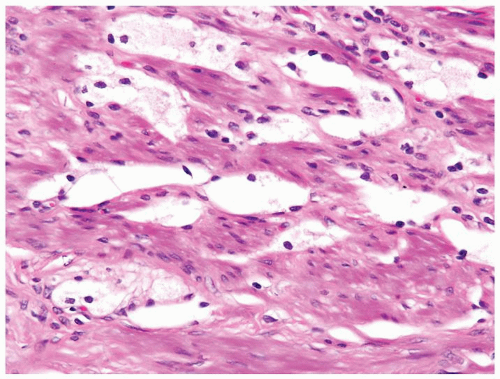
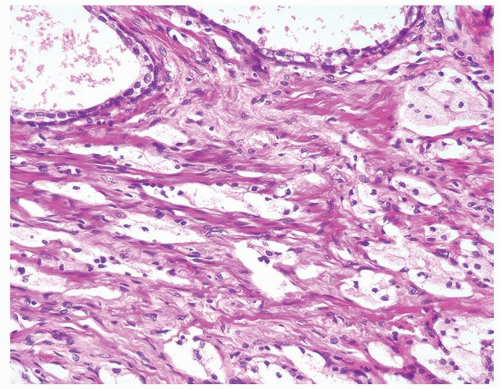 Figure 1.14.8 Adenocarcinoma with hormone treatment affect consisting of nests of cells with foamy cytoplasm in a slightly fibrotic stroma. |
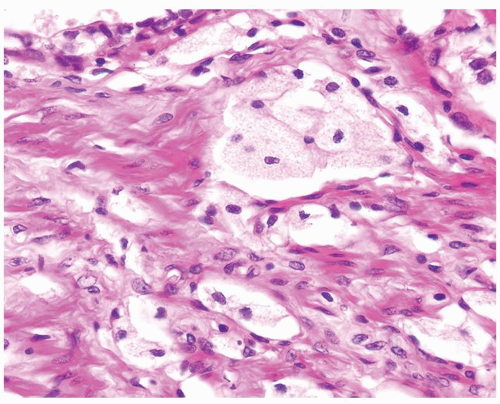 Figure 1.14.9 Higher magnification of Figure 1.14.8 showing cords of cells resembling xanthoma. Focal glandular differentiation is noted (top). |
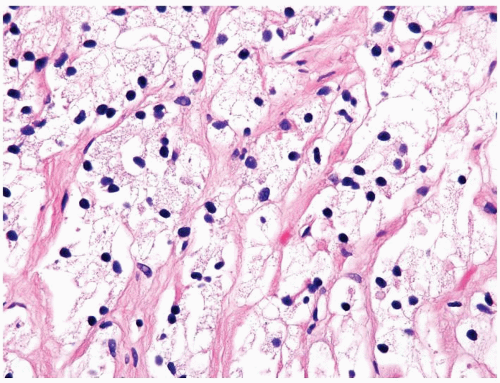 Figure 1.14.11 Hormone-treated prostate cancer with pyknotic hyperchromatic nuclei and abundant xanthomatous cytoplasm. |
|
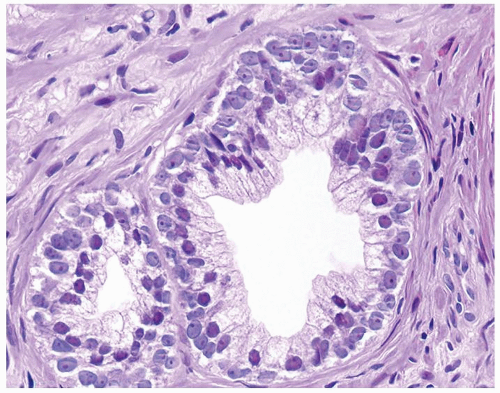 Figure 1.15.1 Basal cells with blue-gray nuclei containing prominent nucleoli undermine secretory cells with red-violet nuclei. |
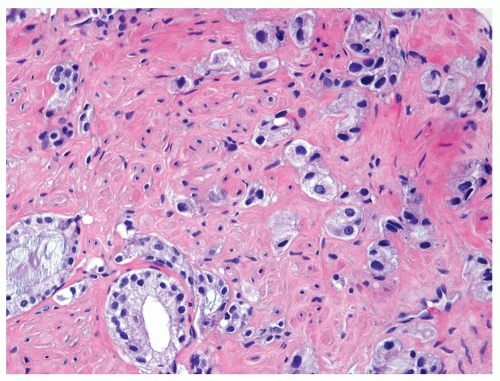
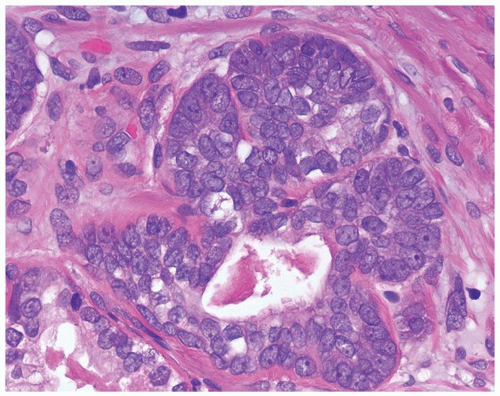 Figure 1.15.3 Basal cell hyperplasia with prominent nucleoli composed of solid nests surrounding the central lumen with atrophic cytoplasm. |
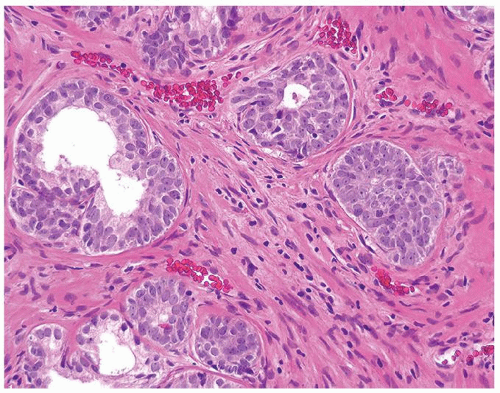
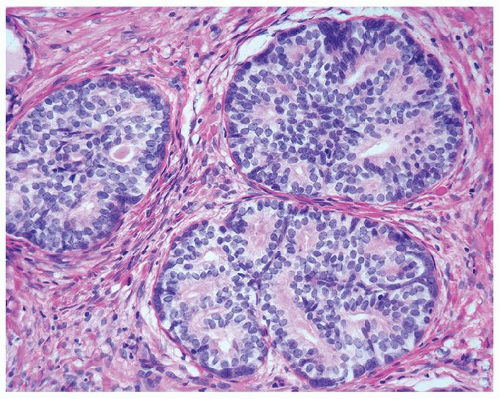 Figure 1.15.6 Pseudocribriform hyperplasia back-to-back glands of basal cell hyperplasia. Each gland maintains its integrity, where one can still identify each gland surrounding a lumen. |
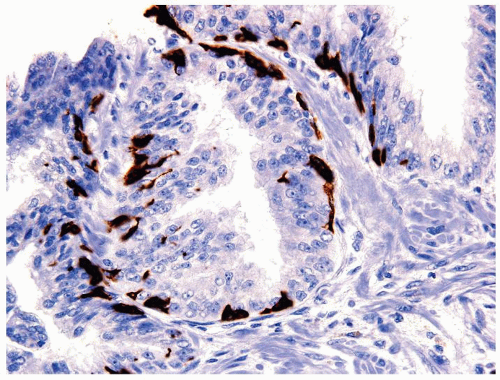
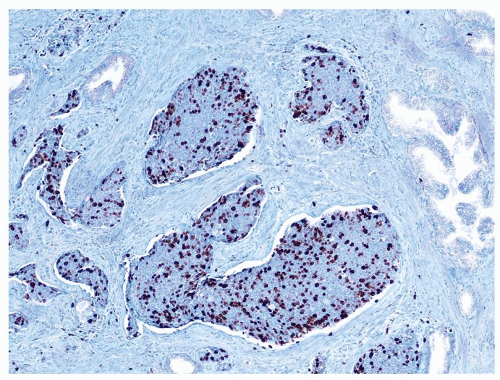
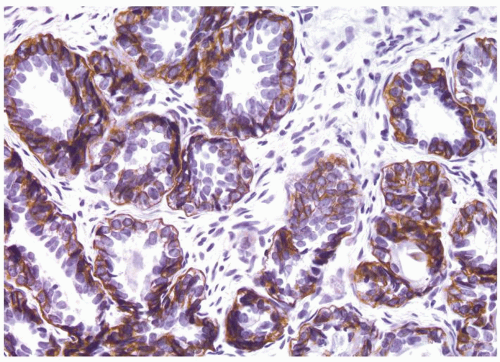 Figure 1.15.7 High molecular weight cytokeratin stain of basal cell hyperplasia labeling multilayered peripheral cells with prominent nucleoli. |
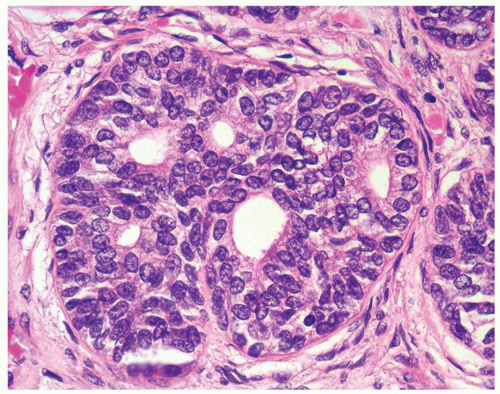
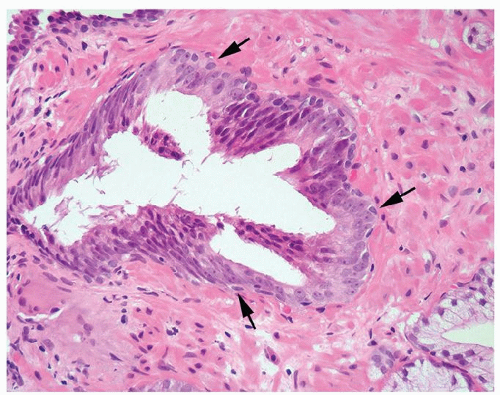
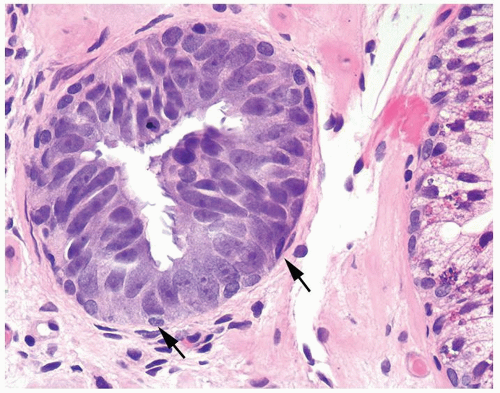 Figure 1.15.8 Tufted high-grade PIN with small basal cells (arrows) and overlying columnar PIN nuclei with prominent nucleoli. |
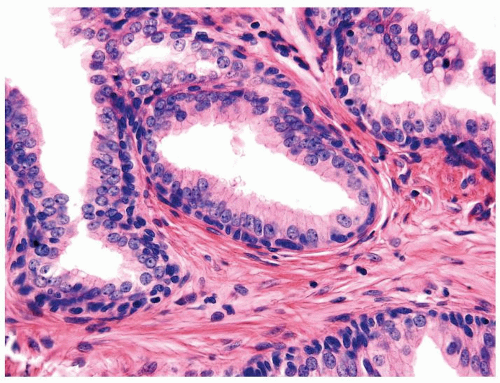 Figure 1.15.9 Flat high-grade PIN with small bland basal cells undermines columnar cells with nuclei containing prominent nucleoli. |
|
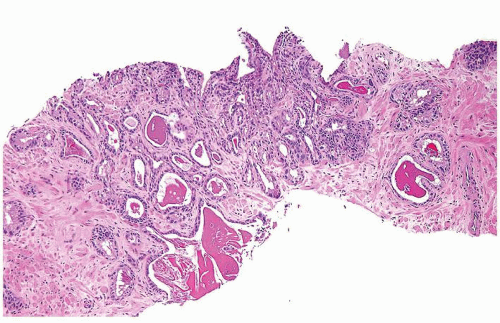
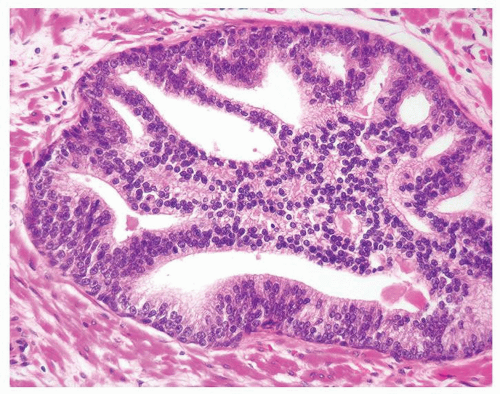
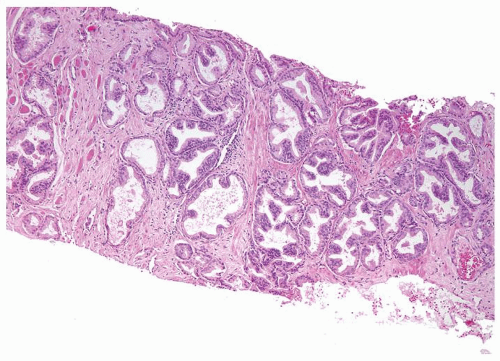
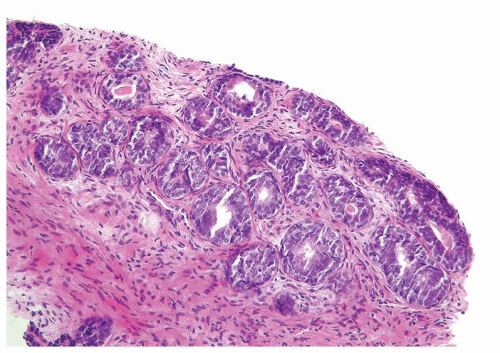 Figure 1.16.1 Basal cell hyperplasia on needle biopsy consisting of multilayered glands and solid nests. |
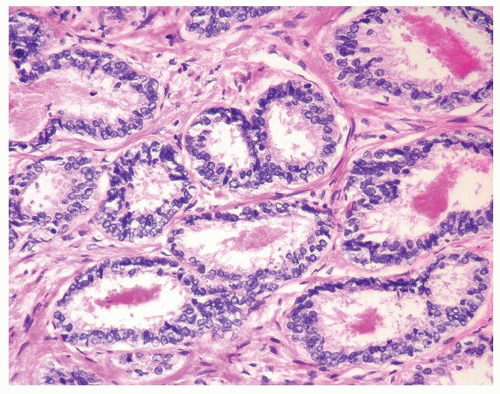 Figure 1.16.3 Same case as Figure 1.16.2 with two rows of basal cells and scant cytoplasm. |
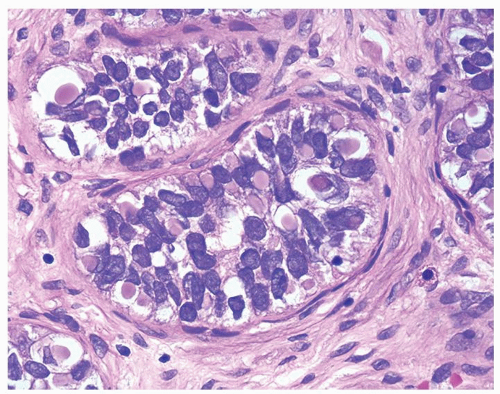 Figure 1.16.7 Same case as Figure 1.16.6 with numerous intracytoplasmic globules. |
|
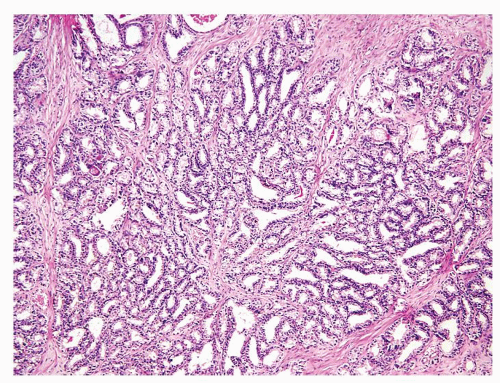
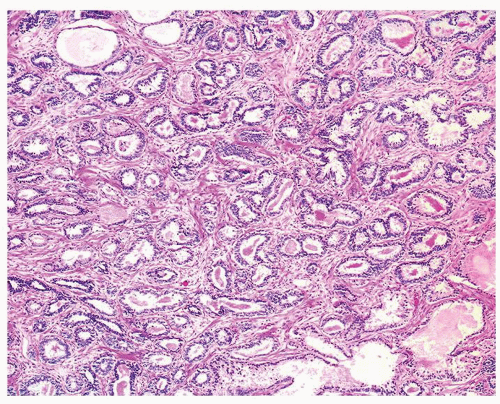
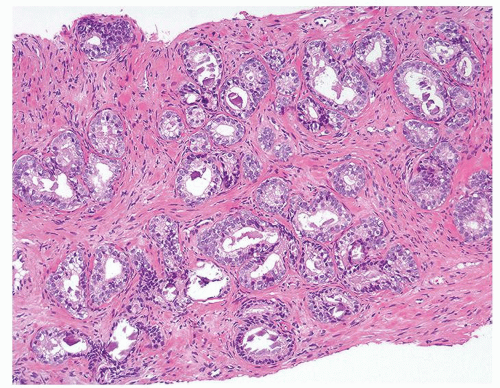 Figure 1.17.1 Basal cell hyperplasia on needle biopsy consisting of crowded, uniformly sized, and distributed small glands in prostatic stroma without a desmoplastic reaction. |
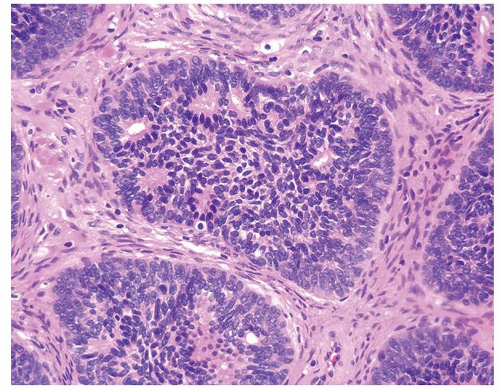 Figure 1.17.3 Pseudocribriform structure with individual well-defined glands surrounded by solid cells. |
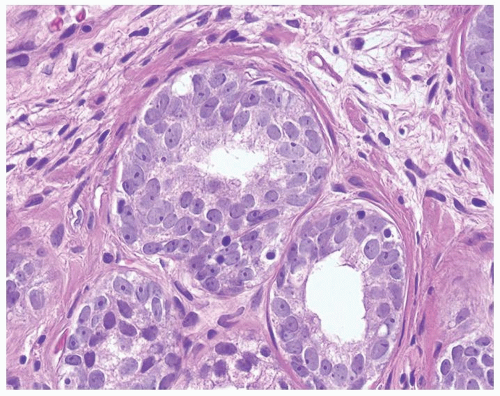
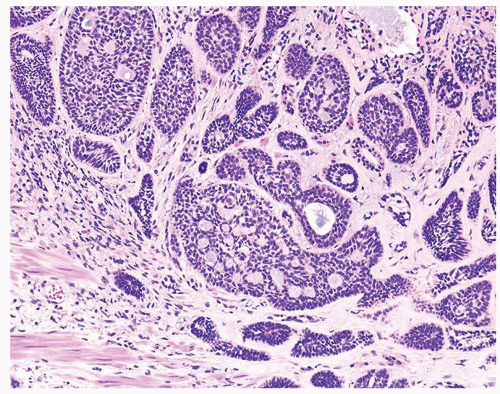
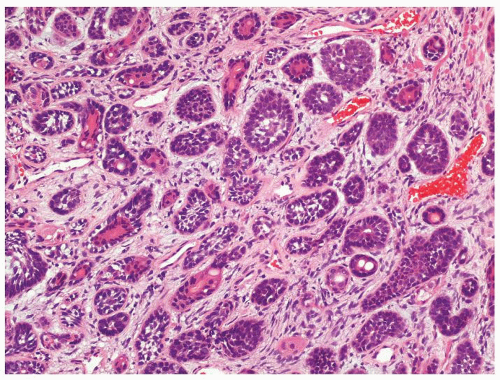
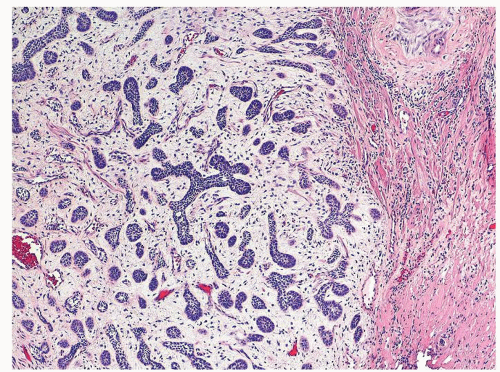
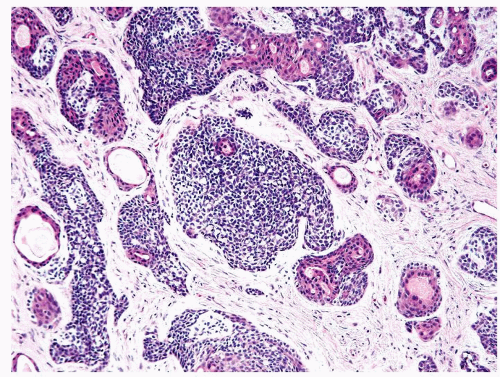 Figure 1.17.5 Basal cell carcinoma with irregular variably sized glands and nests in a desmoplastic stroma. Within inner aspect of some nests are tubules lined by eosinophilic cytoplasm. |
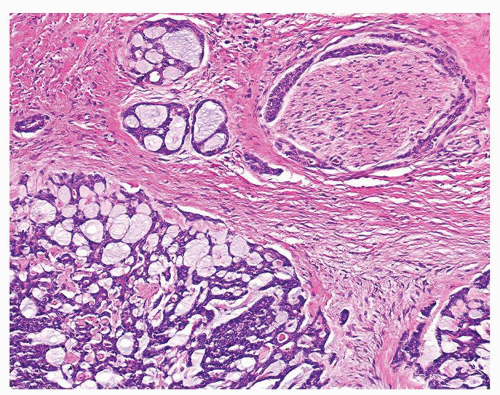
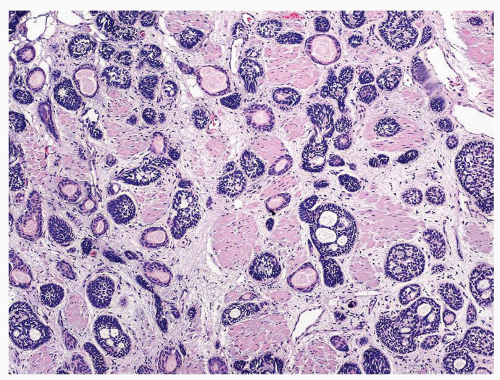 Figure 1.17.10 Basal cell carcinoma resembling basal cell hyperplasia. Nests and tubules infiltrated thick bladder neck muscle diagnostic of carcinoma. |
|
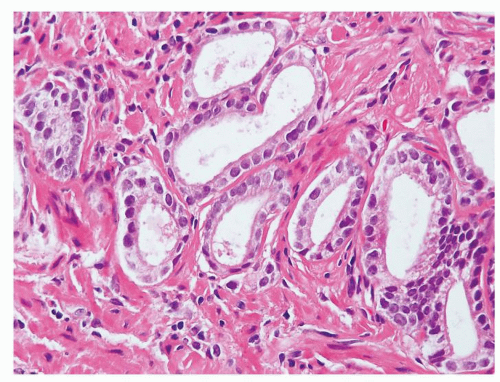
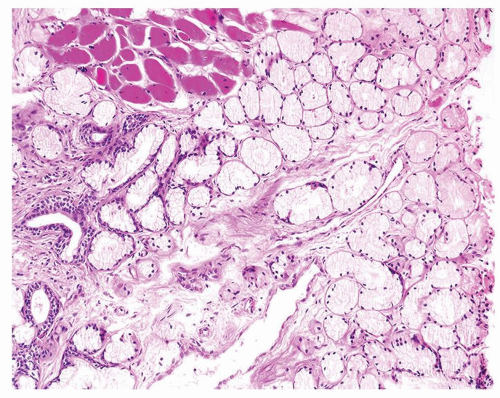
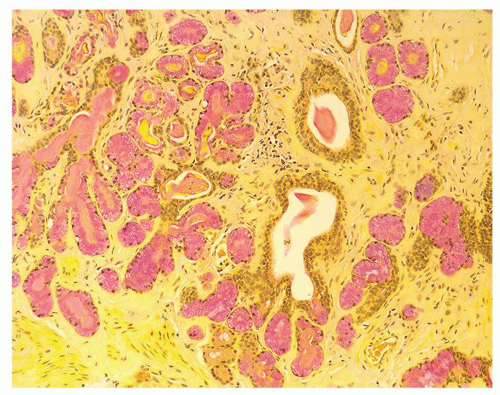
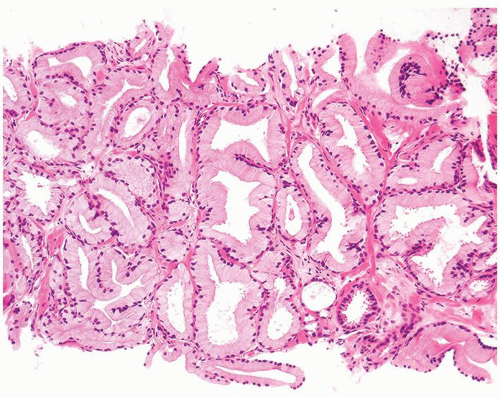
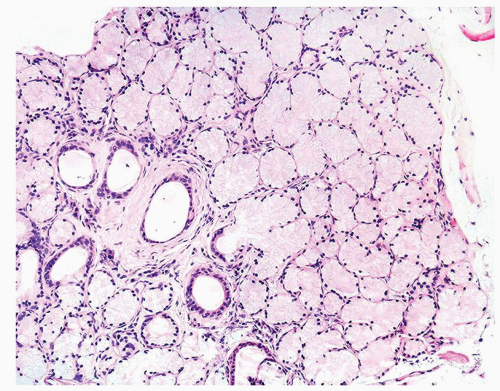 Figure 1.18.2 Lobular Cowper glands with mucinous glands and atrophic ducts lined by cuboidal nonmucinous epithelium. Distended cytoplasm results in small central lumina. |
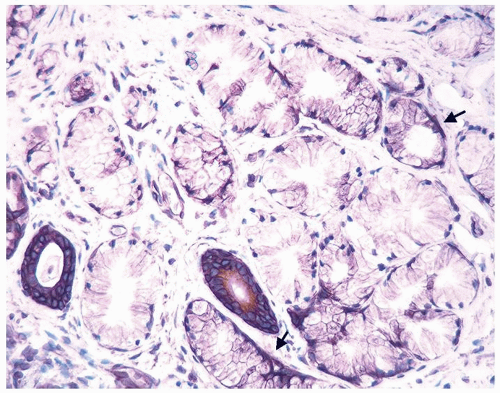
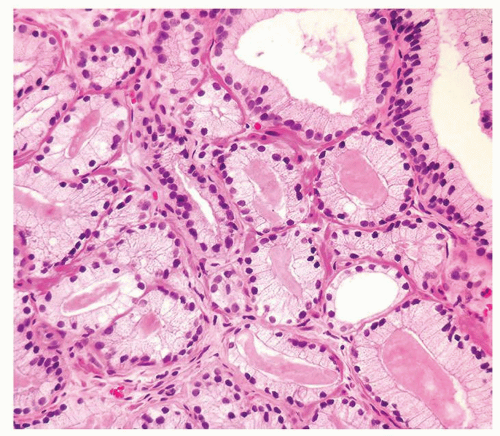
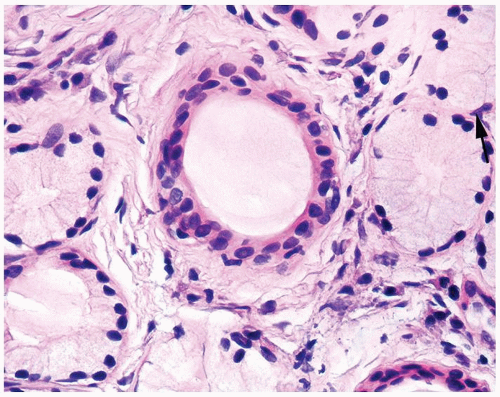 Figure 1.18.3 Higher magnification of Figure 1.18.2 with central duct and surrounding mucinous glands. Some cells have rounded distended appearance (arrow). |
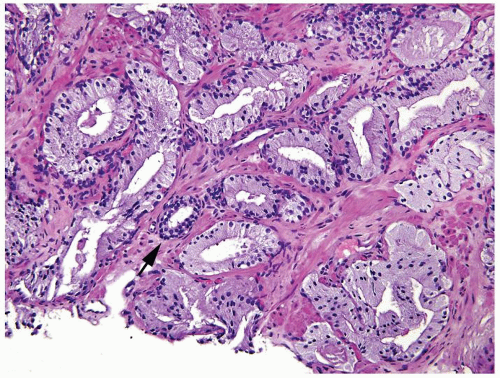 Figure 1.18.6 Foamy gland carcinoma infiltrating in prostate stroma around the benign gland (arrow). |
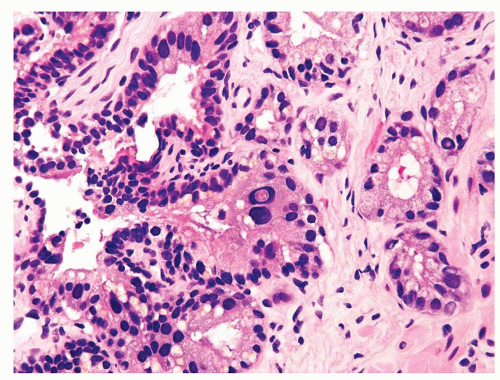
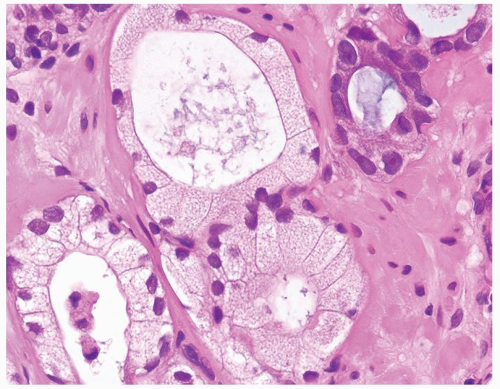 Figure 1.18.9 Foamy gland carcinoma with cuboidal to columnar bland nuclei. More atypical nuclei are seen in adjacent nonfoamy gland carcinoma (upper right). |
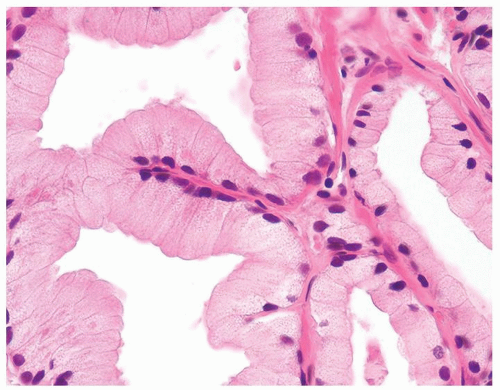 Figure 1.18.10 Foamy gland carcinoma with bland nuclei and columnar cells with abundant xanthomatous-appearing cytoplasm. |
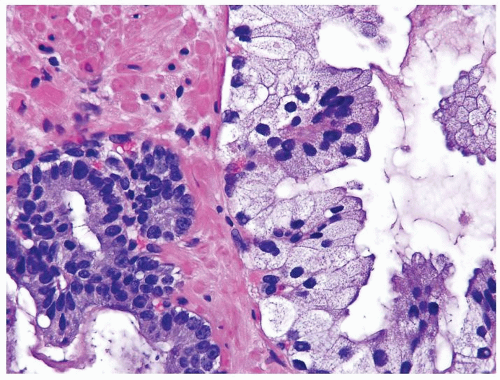 Figure 1.18.11 Foamy gland carcinoma (right) with bland nuclei compared to usual prostate cancer with greater cytologic atypia (left). |
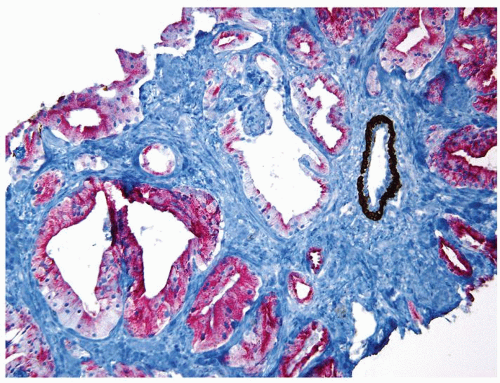 Figure 1.18.12 Foamy gland carcinoma lacking basal cells (brown) and positive for AMACR (red). An entrapped benign gland surrounded by basal cells is present (same case as Fig. 1.18.6). |
|
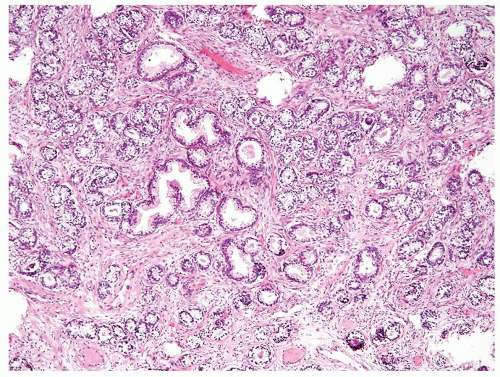
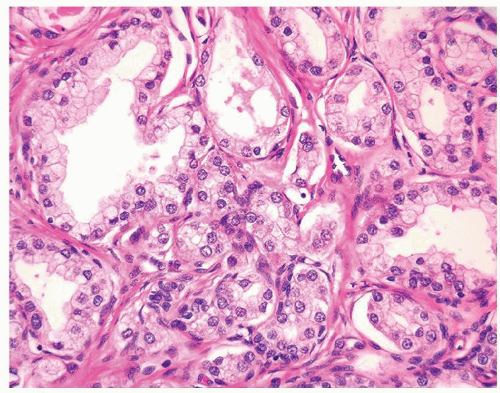 Figure 1.19.4 Same case as Figure 1.19.1 with small crowded glands sharing cytoplasmic and nuclear features with more benign-appearing glands (left). |
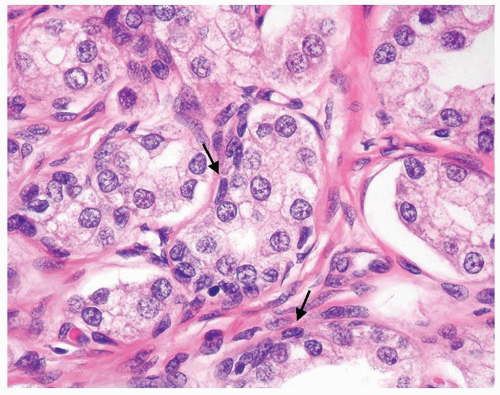 Figure 1.19.5 Same case as Figure 1.19.1 with some glands with a visible basal cell layer (arrows). Some of the glands are tangentially sectioned (left). |
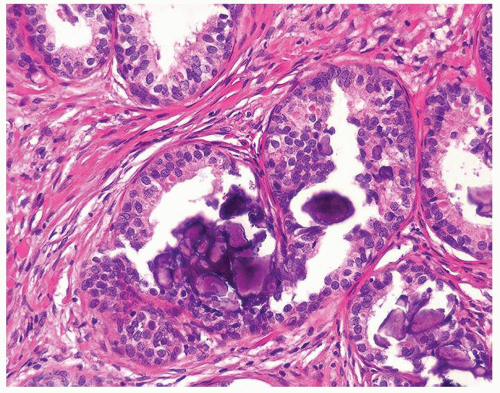
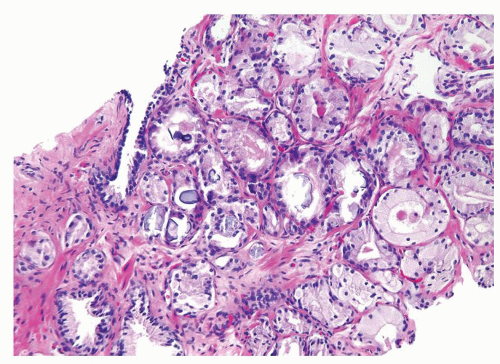
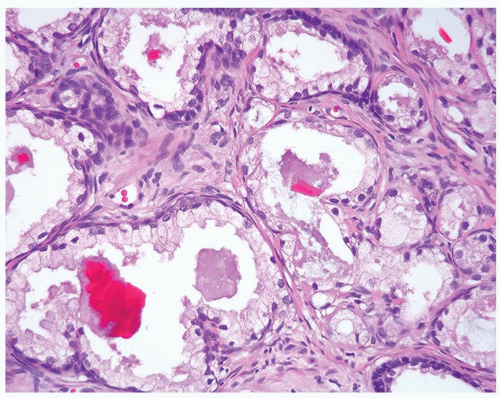 Figure 1.19.7 Same case as Figure 1.19.1 with crystalloids. |
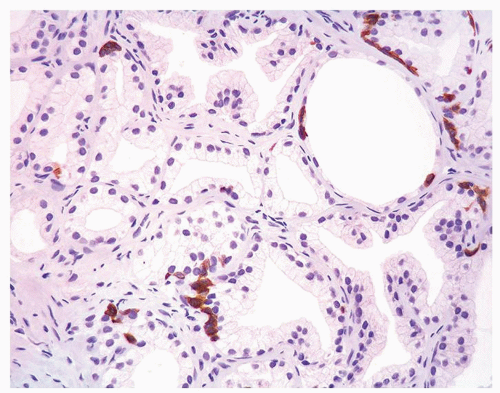 Figure 1.19.8 Same case as Figure 1.19.1 with adenosis showing some glands with HMWCK patchy, positive basal cells and other glands negative. Negative glands have the same morphology as positive glands. |
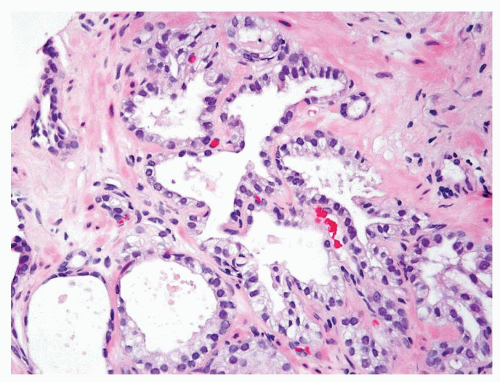
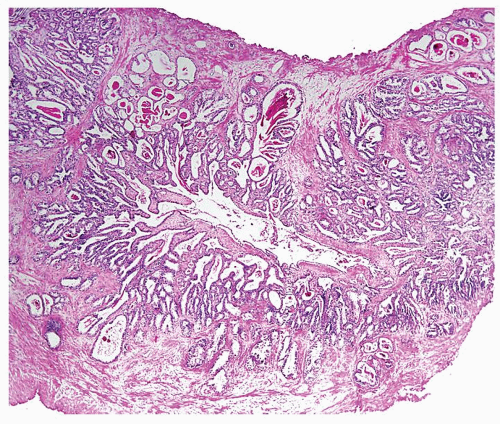
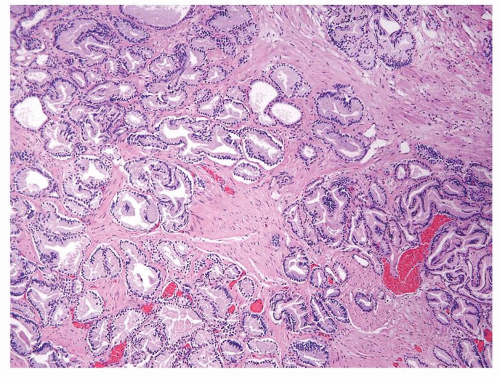 Figure 1.19.9 Irregular growth pattern of cancer with glands interspersed between large bundles of smooth muscle. |
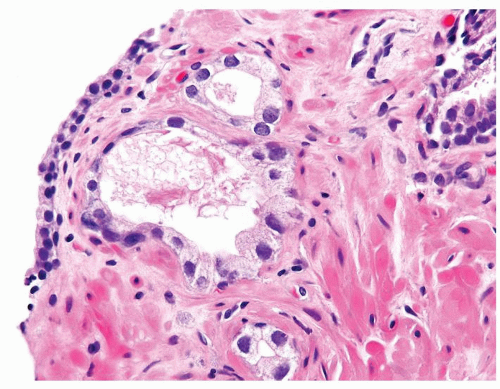
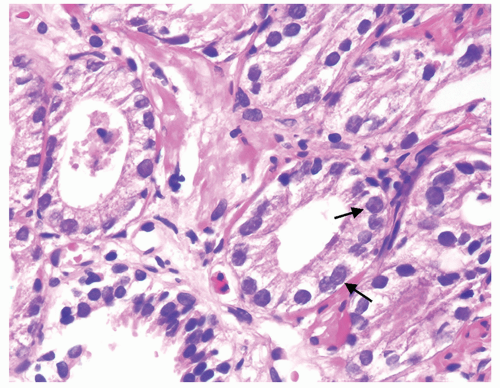 Figure 1.19.11 Same case as Figure 1.19.10 with adenocarcinoma showing prominent nucleoli (arrows) compared to benign gland (lower left). |
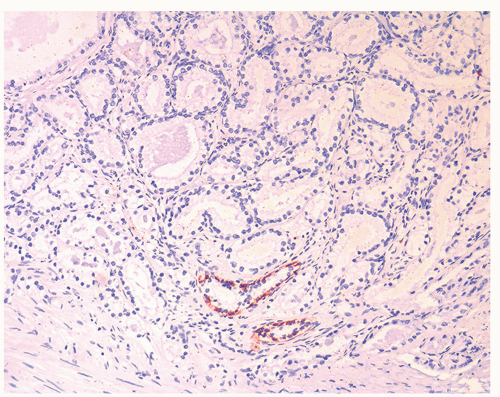 Figure 1.19.12 Negative stains for HMWCK (same case as Figs. 1.19.10 and 1.19.11). Note entrapped benign glands (bottom) with circumferential staining. |
|
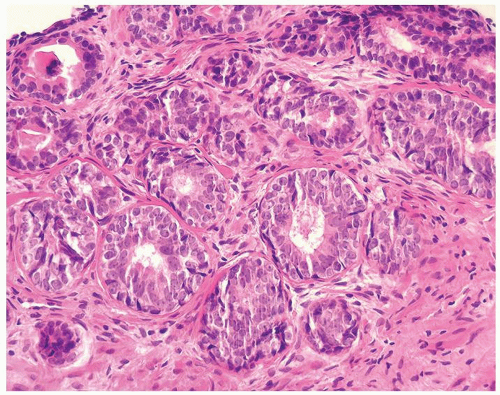
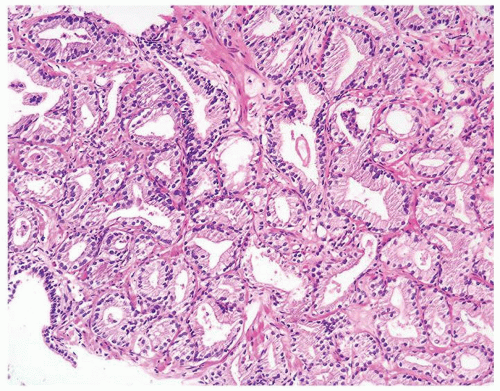
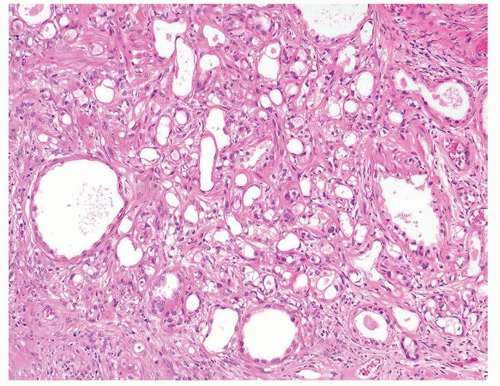
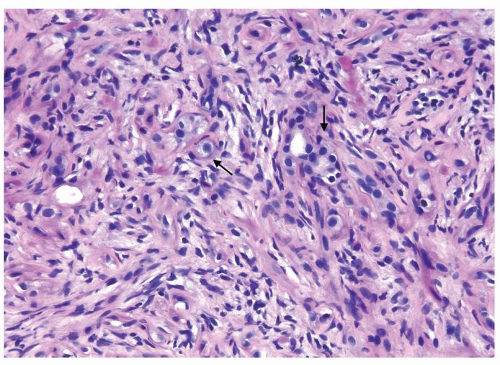 Figure 1.20.1 Sclerosing adenosis with scattered glands and single epithelial cells (arrows) with cellular stroma background. |
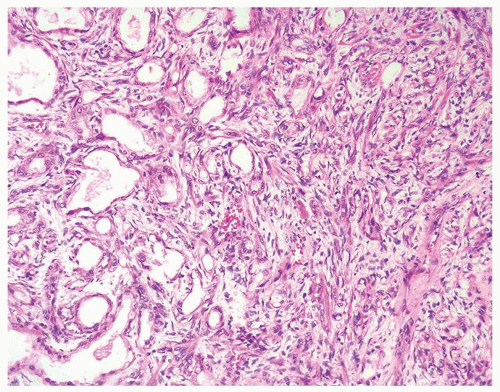
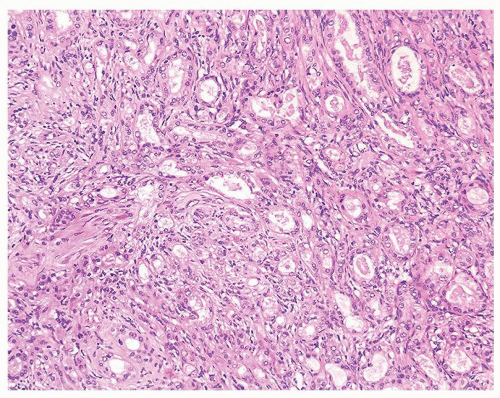 Figure 1.20.3 Sclerosing adenosis consisting of well-formed glands (right) and poorly formed glands (left) with cellular spindle cells in background. |
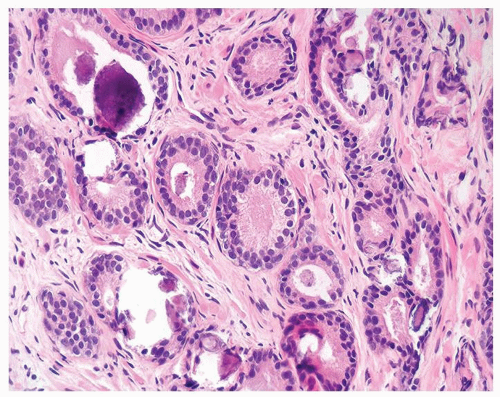
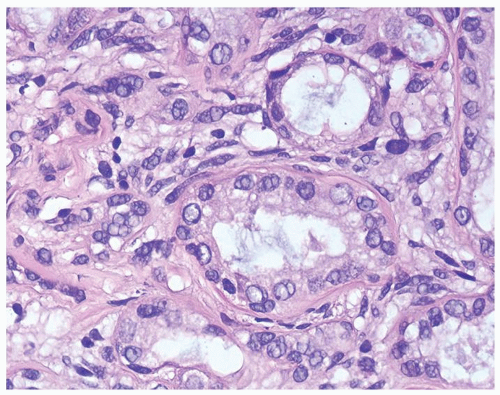 Figure 1.20.4 Higher magnification of Figure 1.20.2 showing a gland surrounded by hyaline rim of connective tissue. Background of cellular spindle cells. |
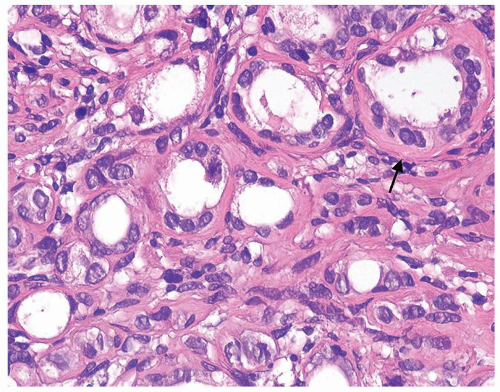 Figure 1.20.5 Higher magnification of Figure 1.20.3 with atrophic glands having hyaline rim (arrow). |
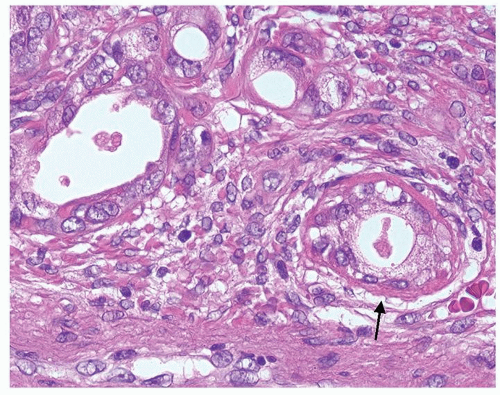 Figure 1.20.7 Higher magnification of Figure 1.20.6 with a gland having hyaline rim of connective tissue (arrow). Glands have nuclei with prominent nucleoli. |
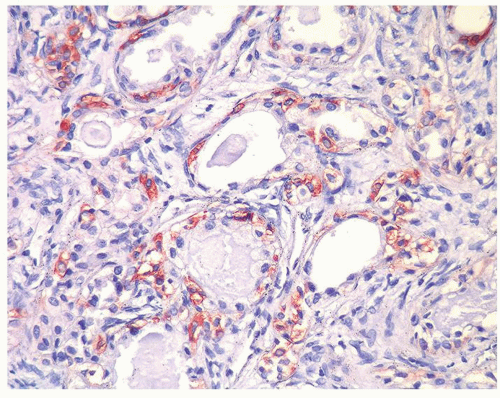
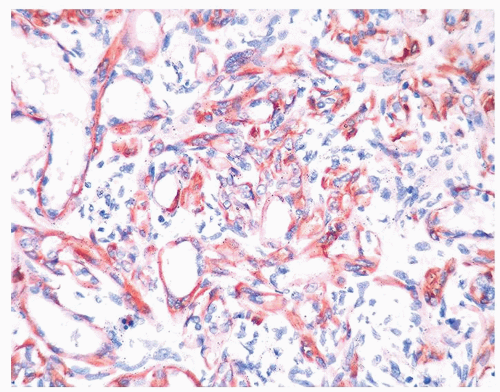 Figure 1.20.9 Same case as Figures 1.20.6, 1.20.7, 1.20.8 with S100 protein showing myoepithelial cell differentiation in basal and some spindle cells. |
|
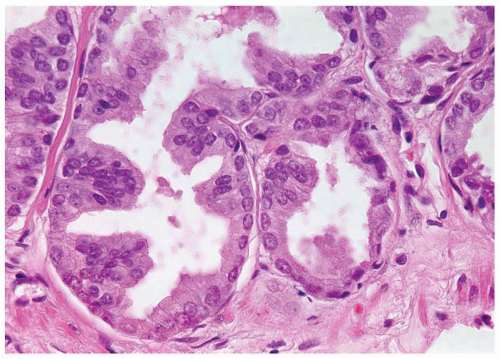 Figure 1.21.2 Same case as Figure 1.21.1 with numerous prominent nucleoli. |
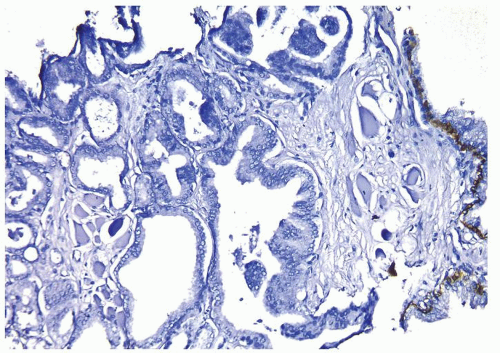 Figure 1.21.3 Same case as Figures 1.21.1 and 1.21.2 with absence of a basal cell layer. Note benign gland with basal cells (right). |
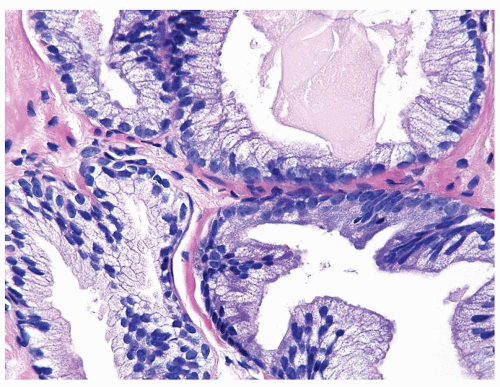 Figure 1.21.5 Same case as Figure 1.21.4 with numerous prominent nucleoli in cancer glands (right) compared to benign gland (lower left). Stains showed an absence of basal cells. |
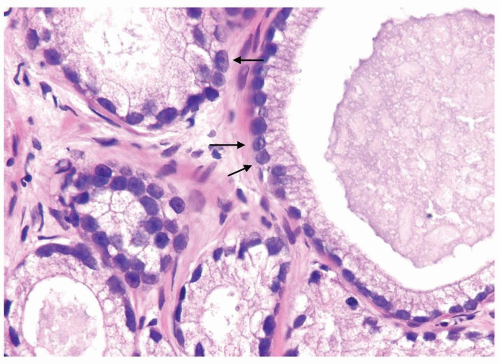 Figure 1.21.6 Pseudohyperplastic carcinoma with large glands with straight luminal borders and abundant cytoplasm and prominent nucleoli (arrows). |
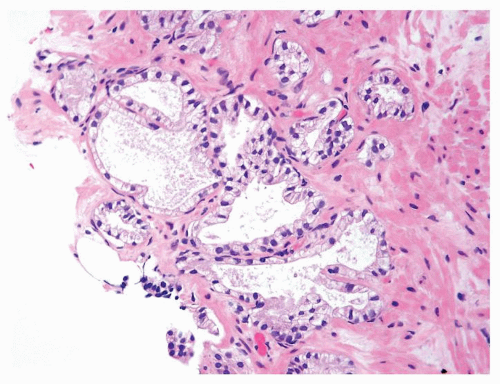
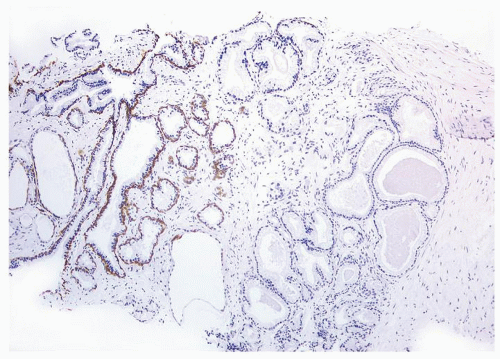 Figure 1.21.7 Same case as Figure 1.21.6 with absence of a basal cell layer in large glands with straight luminal border (right). Less crowded benign glands without atypia have a basal cell layer (left). |
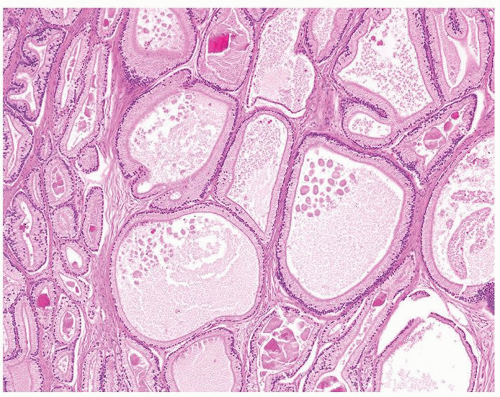 Figure 1.21.8 Pseudohyperplastic carcinoma with large glands with straight luminal borders and abundant cytoplasm. |
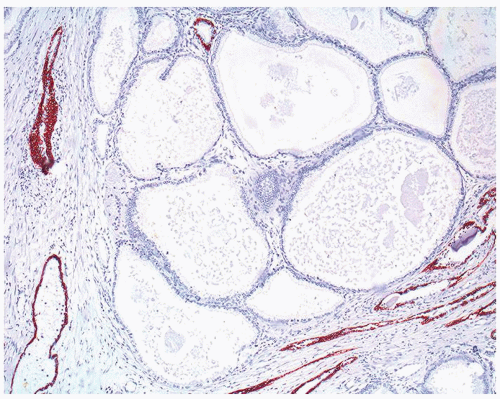 Figure 1.21.9 Same case as Figure 1.21.8 with absence of a basal cell layer in large glands with straight luminal border. |
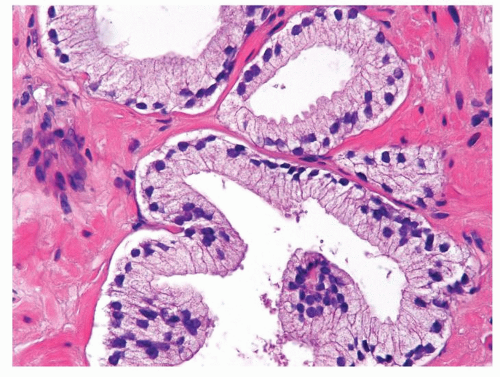 Figure 1.21.11 Same case as Figure 1.21.10 with totally benign cytology. |
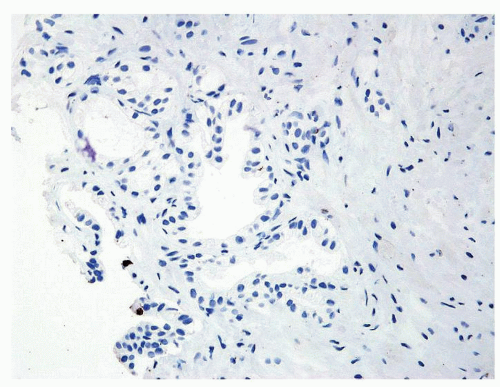
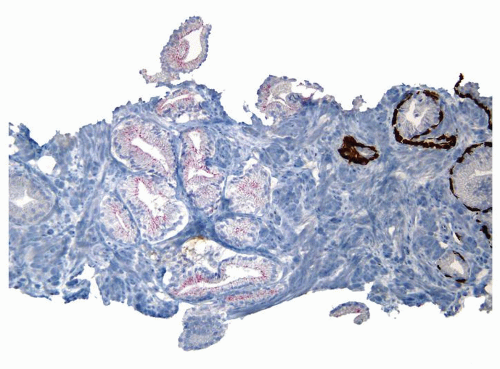 Figure 1.21.12 Same case as Figures 1.21.10 and 1.21.11 with absence of a basal cell layer. As the focus on H&E is totally benign, negative staining for basal cells in a small focus of glands is still consistent with a benign diagnosis. |
|
Stay updated, free articles. Join our Telegram channel

Full access? Get Clinical Tree


