Dr. Joshua Worthy is chief of neurology at a large staff model health maintenance organization (HMO) and serves as the physician representative to the HMO’s executive committee. The federal government has just taken the unprecedented step of imposing mandatory cost controls. The HMO’s budget for the coming year will be frozen at the current year’s level. In past years, the annual growth in the HMO’s budget has averaged 8%.
The health plan CEO begins the committee meeting by groaning, “These cuts are draconian! To meet these new budget limits we’ll have to cut staff and ration life-saving technologies. Patients will suffer.” A consumer member responds, “We all know there’s fat in the system. Why, in the newspaper just the other day there was an article about how rates of back surgery in our city are twice the national average. And if we’re going to talk about cuts, maybe we should start by looking at your salary and the number of administrators working here. I’m not so sure patients have to suffer just because we’re adopting the kind of reasonable spending limits that they have in most countries.”
Dr. Worthy remains silent for much of the meeting. He wonders to himself, “Is the CEO right? Is cost containment inevitably a painful process that will deprive our patients of valuable health services? Or, could we be doing a better job with the resources we’re already spending? Is there a way that our HMO could implement these cost controls in a relatively painless fashion as far as our patients’ health is concerned?” Interpreting Dr. Worthy’s silence as an indication of great wisdom and judgment, the committee assigns him to chair the HMO’s task force charged with developing a cost-control strategy to meet the new budgetary realities.
INTRODUCTION
Concerns about the rise of health care costs dominate the health policy agenda in the United States. The lack of adequate insurance and access to care for tens of millions of people—which spawned the Affordable Care Act—is in part attributable to the problem of rising costs. Health care inflation made health insurance and health services unaffordable to many families and employers.
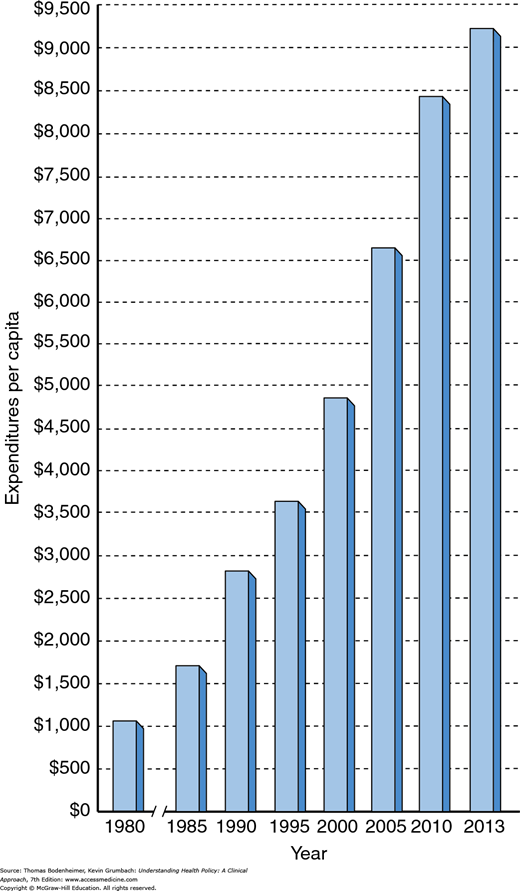
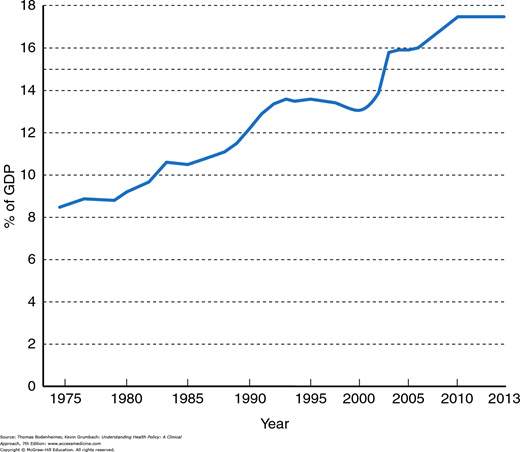
Private and public payers in the United States have taken aim at health care cost increases and discharged volleys of innovative strategies attempting to curb expenditure growth, such as creating new approaches to utilization review, encouraging HMO and Accountable Care Organization (ACO) enrollment, making patients pay more out-of-pocket for care, and a multitude of other measures. Yet national health expenditures per capita increased over sevenfold between 1980 and 2013, rising from $1,110 to $9,255 per capita (Fig. 8-1). Viewed as a percentage of gross domestic product (GDP), US health expenditures increased from 9.2% in 1980 to 17.4% in 2013 (Fig. 8-2). While growth slowed from 2009 to 2013 due to the economic recession, growth is expected to accelerate starting in 2015. Health expenditures as a percentage of GDP are projected to rise to 19.3% by 2023 (Hartman et al., 2015; Sisko et al., 2014).
Health care providers are discovering that they have to adjust to the prospect of practicing in an era of finite resources. Like Dr. Worthy, physicians and other health caregivers need to deliberate about how constraints on expenditure growth may affect patients’ health. Must cost control necessarily be painful, leading to rationing of beneficial services? Or, is there a painless route to containing costs, reached by eliminating unnecessary medical treatments and administrative expenses?
In this chapter, the painful–painless cost-control debate will be explored. First, a model will be constructed describing the relationship between health care costs and benefits in terms of improved health outcomes. Then different general approaches to cost containment and their potential for achieving painless cost control will be discussed. Chapter 9 will describe specific cost-control measures in more detail.
HEALTH CARE COSTS AND HEALTH OUTCOMES
Before entering medical school, Dr. Worthy worked in the Peace Corps in a remote area in Central America. At the time he first arrived in the region, the infant mortality rate was quite high, with many deaths due to infectious gastroenteritis. Dr. Worthy participated in the creation of a sewage treatment system and clean well-water sources for the region, as well as a program for implementing oral rehydration techniques for infants. By the end of Dr. Worthy’s 2-year stay, the infant mortality rate had dropped by nearly 25%. The cost for the entire program amounted to 15 cents per capita, paid for by the World Health Organization.
Conditions have been very different for Dr. Worthy as a practicing neurologist in the United States. Over 20 new magnetic resonance imaging (MRI) scanners have been installed in the city in which his HMO is located, an urban area with a population of 800,000. Dr. Worthy has found that MRI scans provide images that are better than those of computed tomography (CT) scans, allowing him to more accurately diagnose conditions such as multiple sclerosis in earlier stages. But 10 MRIs for the city would be plenty, and many scans are ordered unnecessarily.
From society’s point of view, the value of health care expenditures lies in purchasing better health for the population. The concept of “better health” is a broad one, encompassing improved longevity and quality of life, reduced mortality and morbidity rates from specific diseases, relief of pain and suffering, enhanced ability to function independently for those with chronic illnesses, and reduction in fear of illness and death. It is important to know whether investing more resources in health care buys improved health outcomes for society, and if so, the magnitude of the improvement in outcomes relative to the amount of resources invested.
Figure 8-3, drawn from the work of the health economist Robert Evans (1984), illustrates a theoretic relationship between health care resource input and health care outcomes. Initially, as health care resources increase, these outcomes improve, but above a certain level, the slope of the curve diminishes, signifying that increasing investments in health care yield more marginal benefits. In terms of Dr. Worthy’s experiences, the Central American region in which he worked lay on the steep slope of this cost–benefit curve: A small investment of resources to create more sanitary water supplies and to administer inexpensive rehydration therapy yielded dramatic improvements in health. On the other hand, purchasing more MRI scanners represents a health care system operating on the flatter portion of the curve: Large investments of resources in new technologies may produce more marginal and difficult-to-measure improvements in the overall health of a population.
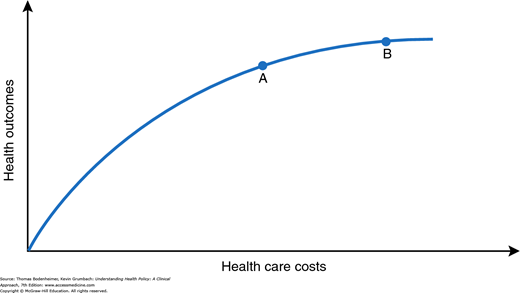
Naturally, different medical interventions lie on steeper (e.g., childhood immunizations) or on flatter (e.g., the costly prolongation of life for an anencephalic infant) portions of the curve. The curve in Figure 8-3 may be viewed as an aggregate cost–benefit curve for the functioning of a health care system as a whole. The system may be an entire nation or a smaller entity such as an HMO, with its defined population of enrollees.
Overall, the US health care system currently operates along the flatter portion of the curve. Let us assume that Dr. Worthy’s HMO system lies at point A on the curve in Figure 8-3, with average total health care expenditures per HMO enrollee being the same as the average overall per capita health care cost in the United States (roughly $9,000 in 2013). If stringent new cost containment policies forced the HMO to virtually freeze spending at point A rather than increasing annual expenditures at their usual clip to move to point B, then Figure 8-3 implies that the HMO would sacrifice improving the health of its enrollees by an amount equal to the distance between points A and B on the vertical axis.
Such an analysis would confirm the opinion of those who argue that cost containment requires painful choices that affect the health of the population. Forceful proponents of this view are Aaron and Schwartz (1984 and 1990), who described cost containment as a “painful prescription” requiring rationing of beneficial care. In Figure 8-3, the distance between points A and B on the y axis measures how much health “pain” accompanies the decision to limit spending at point A instead of advancing to point B. Some degree of pain is inherent in the curve. As Evans (1984) observes, “if its slope is everywhere positive, then in a world of finite resources, unmet needs are inevitable.” No matter where we sit on the curve, it will always be true that if we spent more we could do a little better.
In Figure 8-3, the distance between points A and B on the y axis is small, given the relatively flat slope of the curve at these points. But reassurances about relatively mild cost containment pain bring to mind the physician, scalpel in hand, hovering over a patient and declaring that “it will only hurt a little bit.” A little pain, necessary as it may be, is not the same as no pain; or as Fuchs (1993) puts it, “‘low yield’ medicine is not ‘no yield’ medicine.”
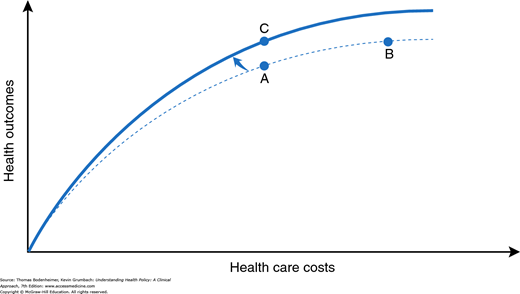
Before allowing ourselves (and Dr. Worthy) to become overly chagrined at the inevitable painfulness of cost containment, let us add the new dimension of efficiency. We can picture a point C (Fig. 8-4) at which spending is the same as that at point A, but outcomes improve. How does the model account for point C, a point off the curve?
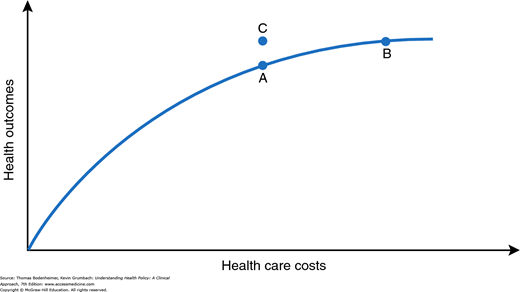
The move to point C requires a shifting of the curve (Fig. 8-5), signifying a new, more efficient (or productive) relationship between costs and health outcomes (Donabedian, 1988). There are numerous possible routes to greater efficiency. For example, diagnostic radiographic imaging services are a rapidly inflating expenditure in the United States. Research has concluded that 20 to 40% of imaging studies are not clinically necessary, and that radiation exposure from CT scans carries a risk of inducing malignant cancers (Brenner & Hricak, 2010). Eliminating unnecessary diagnostic radiographic procedures, such as head CT scans for patients with uncomplicated tension headaches, could simultaneously decrease health care costs and improve health. In the remainder of this chapter, we will examine in greater detail the various possible methods that Dr. Worthy’s cost-control task force could consider to achieve more health “bang” for the health care “buck.” Before turning to this discussion, however, it is necessary to make explicit three assumptions about this model of costs and outcomes.
Implicit in the model is the notion that the relevant outcome of interest is the overall health of a population rather than of any one individual patient. A number of authors have emphasized the need for physicians to broaden their perspective to encompass the health of a general population, as well as their narrower traditional focus on providing the best possible care for each patient (Eddy, 1991; Krieger, 2012). The population-oriented model of costs and outcomes depicted in Figures 8–3 to 8–5 may not fit easily with many physicians’ experiences of caring for a particular patient. At the level of the individual patient, the outcome may be all or nothing (e.g., the patient will almost certainly live if he or she receives an operation and die without it) and not easily thought about in terms of curves and slopes. Rather than focusing on any one particular intervention or patient, the curve attempts to represent the overall functioning of a health care system in the aggregate for the population under its care. (The ethical issues of the population health perspective are discussed in Chapter 13.)

Stay updated, free articles. Join our Telegram channel

Full access? Get Clinical Tree


